|
|
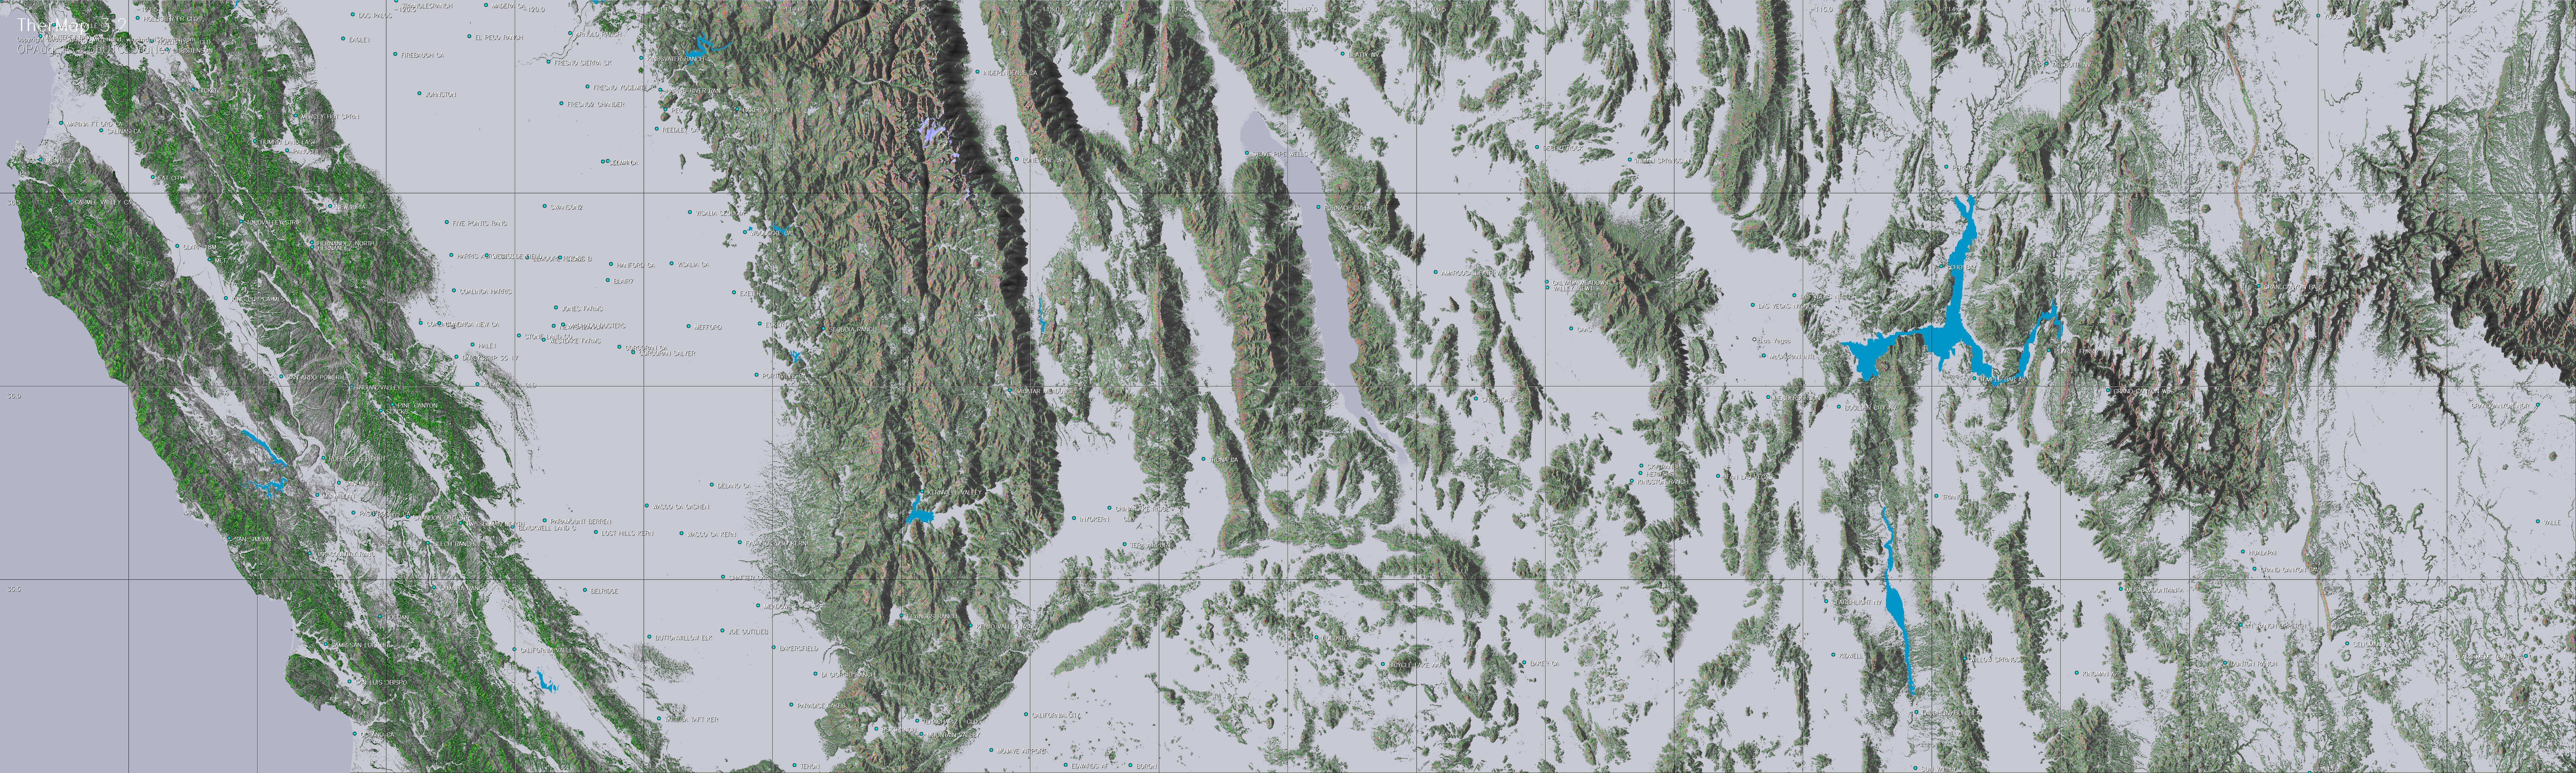
TherMap
3.0
Released March 2017
Maps
showing the expected thermal
hotspots of selected mountain regions
For ridge wind
maps see WindMap
|
These maps
have been calculated on the basis of the empirical model outlined
in the model description below. Hundreds of validations with actual
flight records have confirmed their validity.
A particular advantage of this approach is that the maps also
show the thermal potential of less visited regions.
©
The utilization of the maps for noncommercial purposes remains
free. For commercial uses, quotations, as well for further publication,
written
copyright permission must be obtained via the mail address mentioned
at the end of this site.
Menu
Introduction
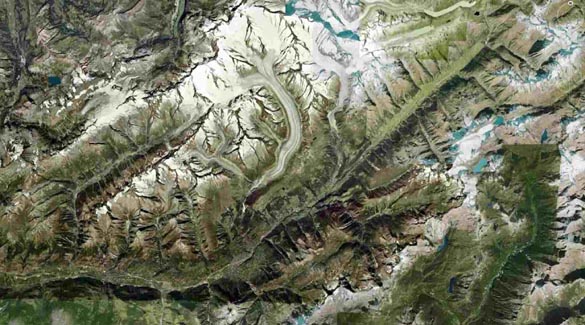
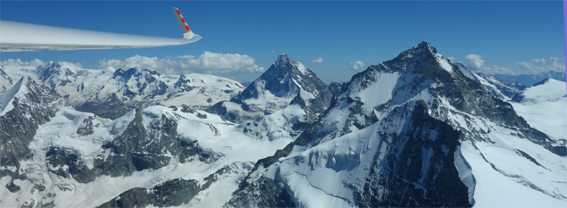
Position the cursor on the above picture to
see a TherMap of same region. TherMap is a tool for glider pilots,
to visualize the local potential of thermals on digital maps
on a given date and hour, assuming favorable meteorological
conditions (sunshine, unstable atmosphere). For any sensible
time and date of interest, such thermal hotspot maps can
be downloaded from this site free of charge.
A second possibility is to directly overlay
the maps on Google Earth, which offers further viewing facilities
such as 3D perspectives. However according to our experience,
this works so far only with Google Earth versions running on
PCs.
Unlike other thermal maps, which are usually
based on statistical analyses of flight records, the maps of
TherMap have been derived solely from the orography ( cf. Model
). The maps therefore also show the potential of thermals
in less known territory.
Before the flights TherMap maps permit to study
the best itineraries, or to explain them to less experienced
pilots, particularly across less known regions. After the flight,
flight logs (typically IGC-files converted to KML for use with
Google Earth) may be superimposed to these maps, to find out
where more promising paths might have been followed.
What is new in TherMap 3.0 ?
One of the limitations of TherMap 2.0 was that
the same filter limit for the thermal potential had been applied
across the entire map. As a result, some areas with high thermal
potentials remained too colored whereas the potentials of weaker
locations were hardly displayed at all. In TherMap 3.0 filters
have therefore been adapted to the local areas in order to reduce
this undesirable effect and to make the underlying topography
still more visible, as outlined in the model
description. To best interpret the maps, it may however be
necessary to use a slightly larger zoom level.
Secondly, since during the peak months the length
of the day is longer, the reference hours of the morning and the
evening maps have been shifted accordingly. This modification
had actually been proposed by paraglider pilots.
|
Using
the Maps
|
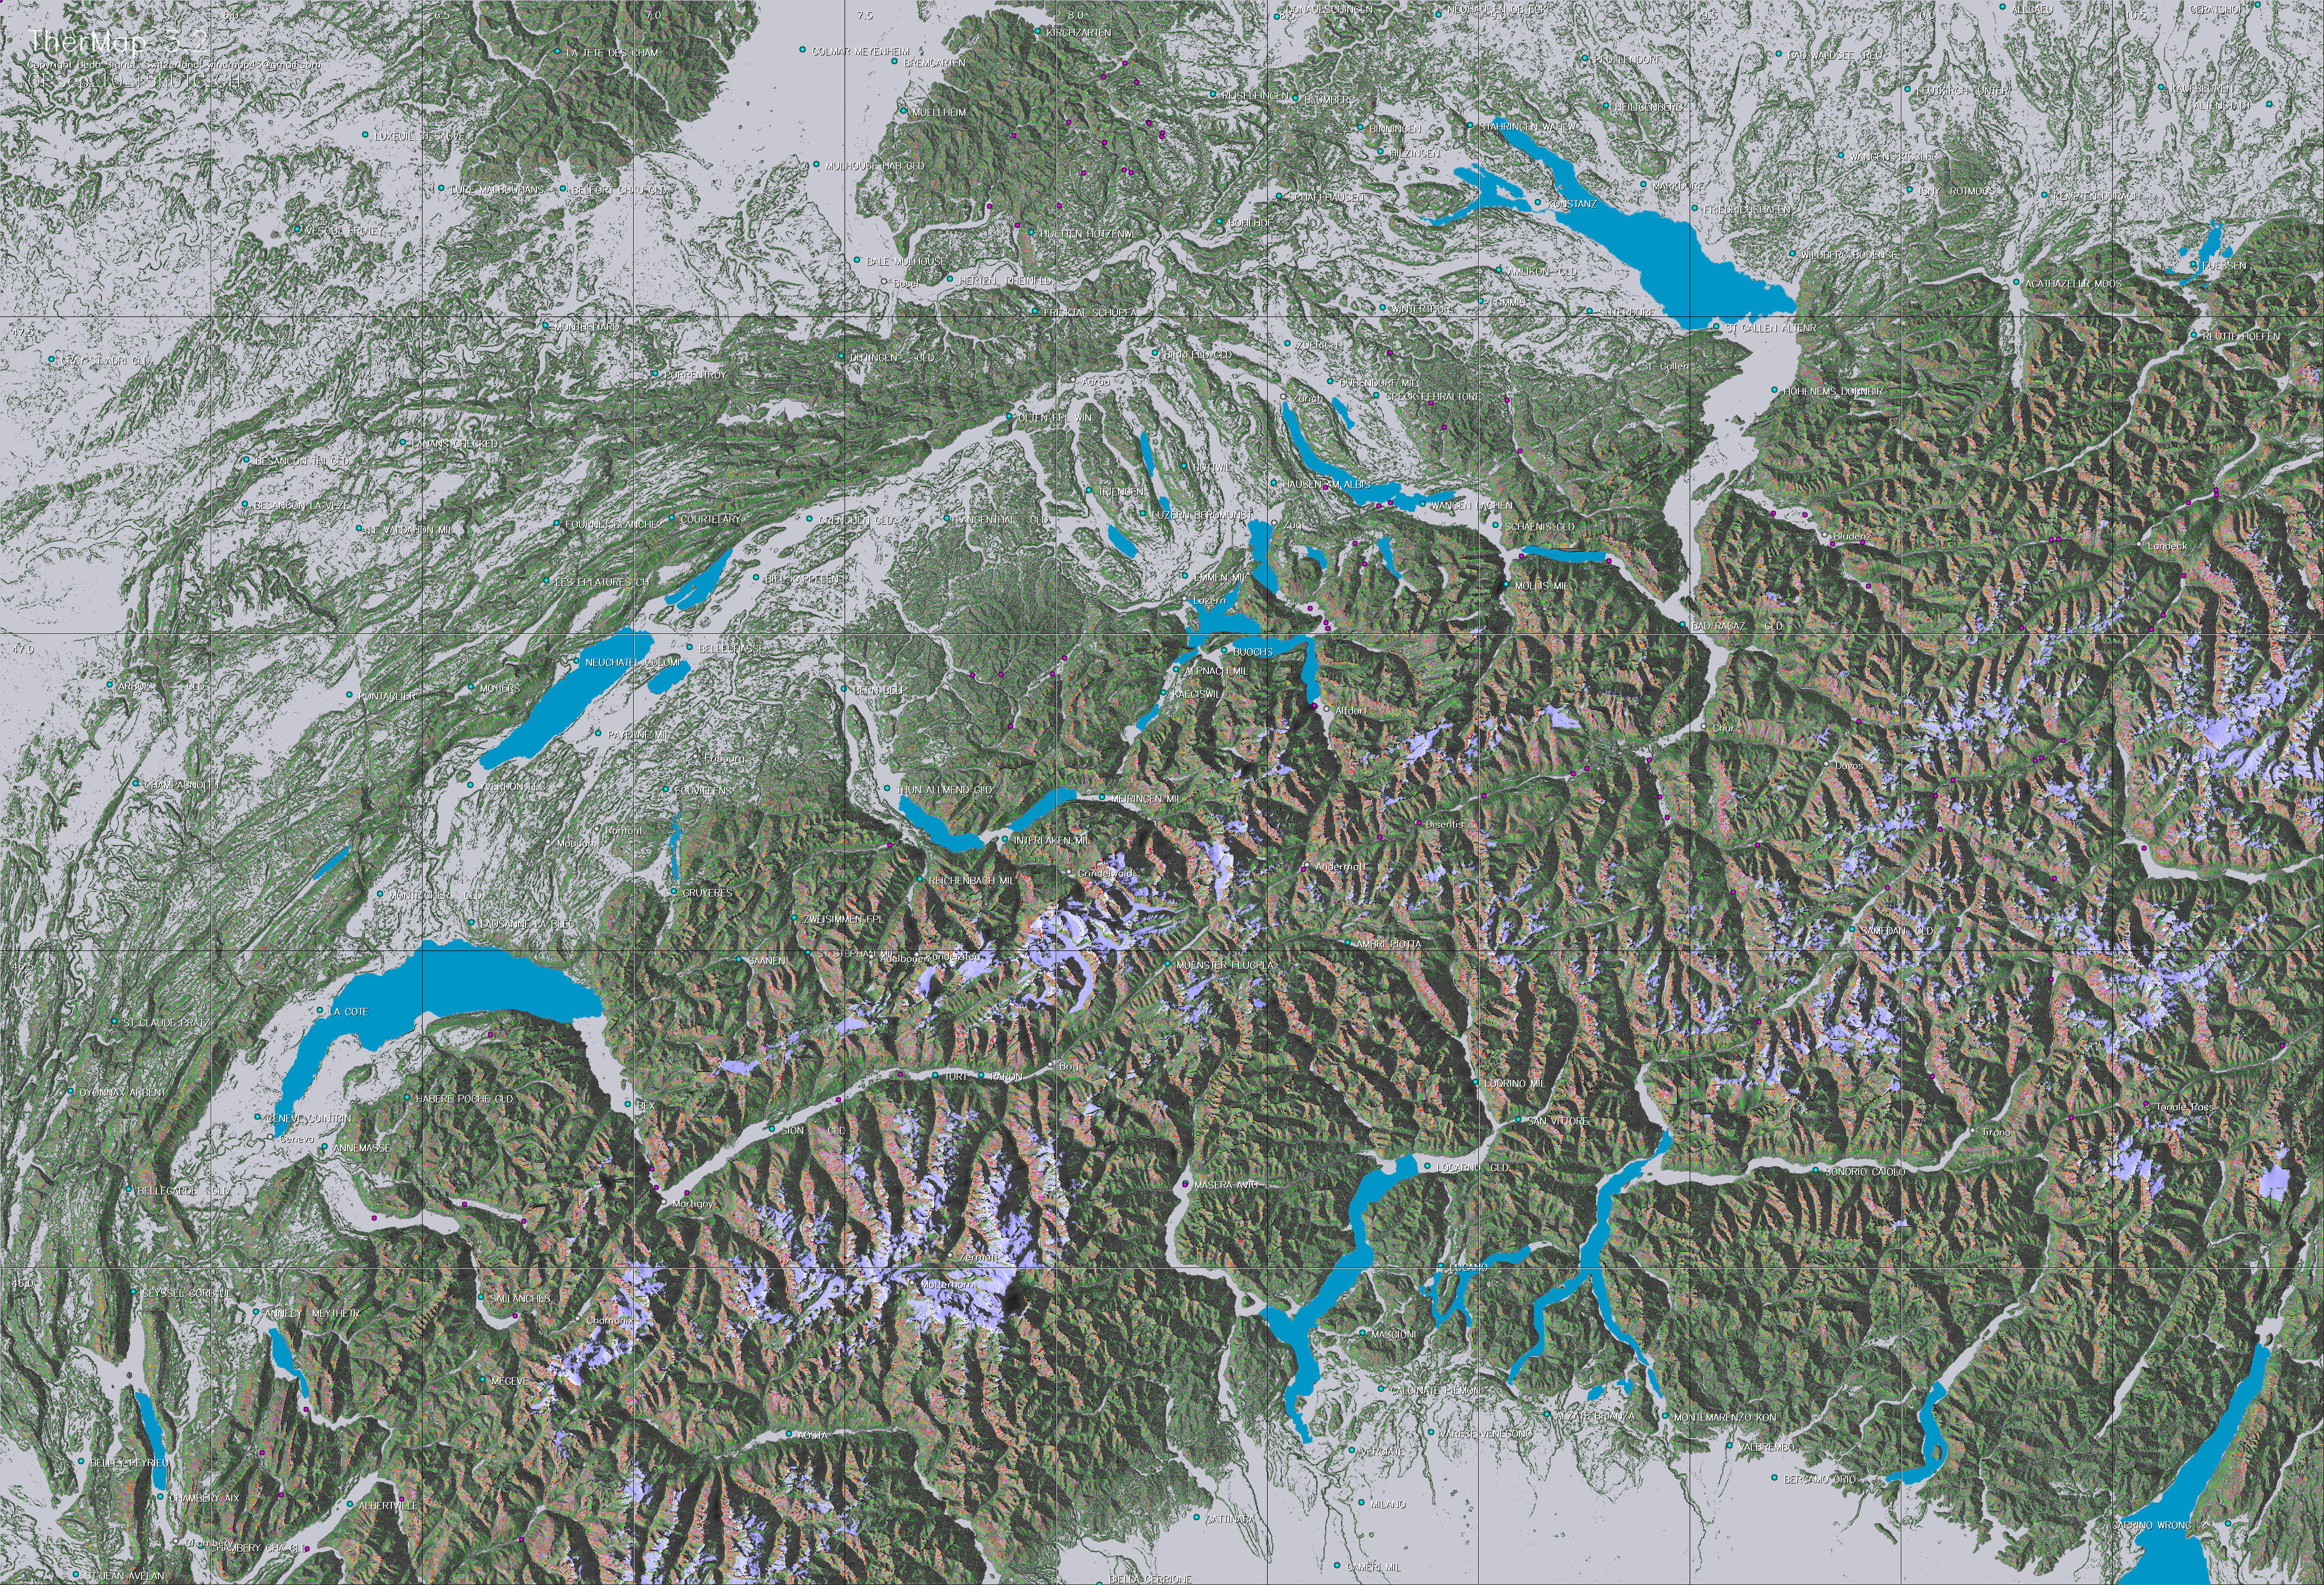
a. How to read the maps
b. Flight preparation
c. Reviewing flights
d. Limitations of TherMap approach
|
-
Zooming:
The maps should be zoomed at least to 100 percent. Original
maps may contain about 10 Mb in JPG format, which corresponds
to about 30 standard screens. The maps should be studied in
detail, if necessary by zooming above 100 percent, due to
their huge information content. For your convenience it is
recommended to use viewers (e.g. MS Picture Manager®)
permitting to maintain the zooming level and the selected
window frame while paging between different downloaded images.
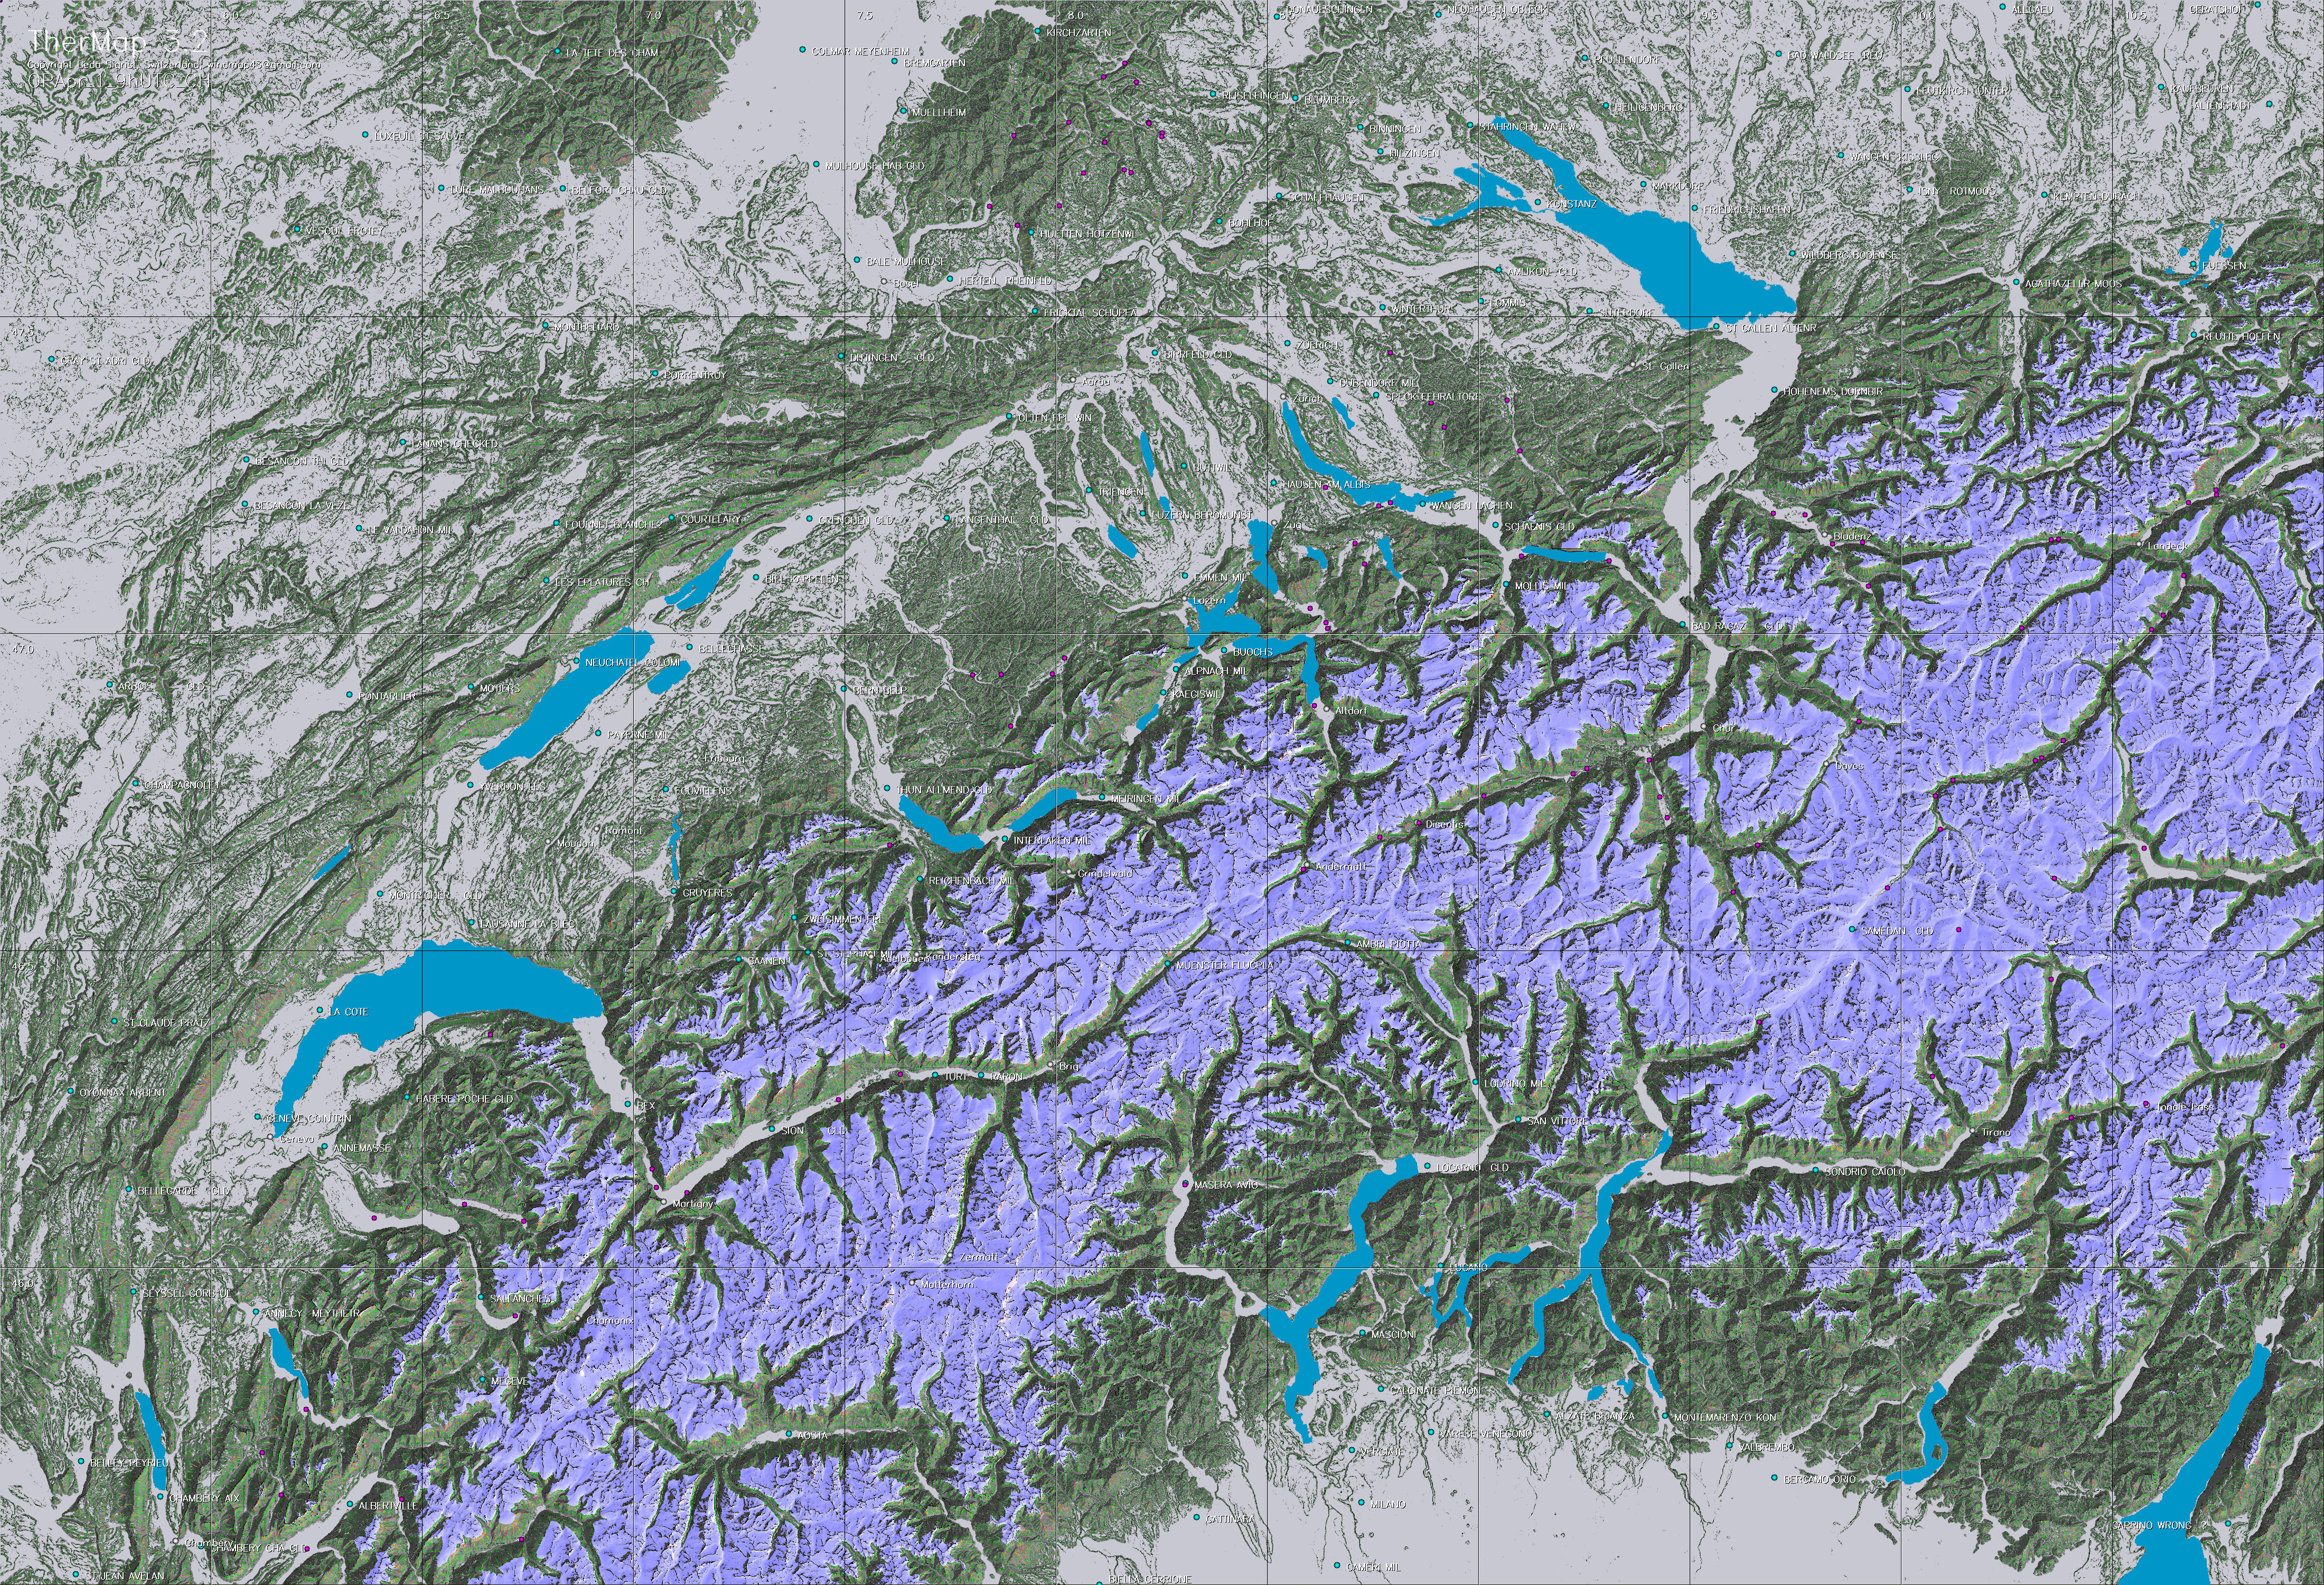
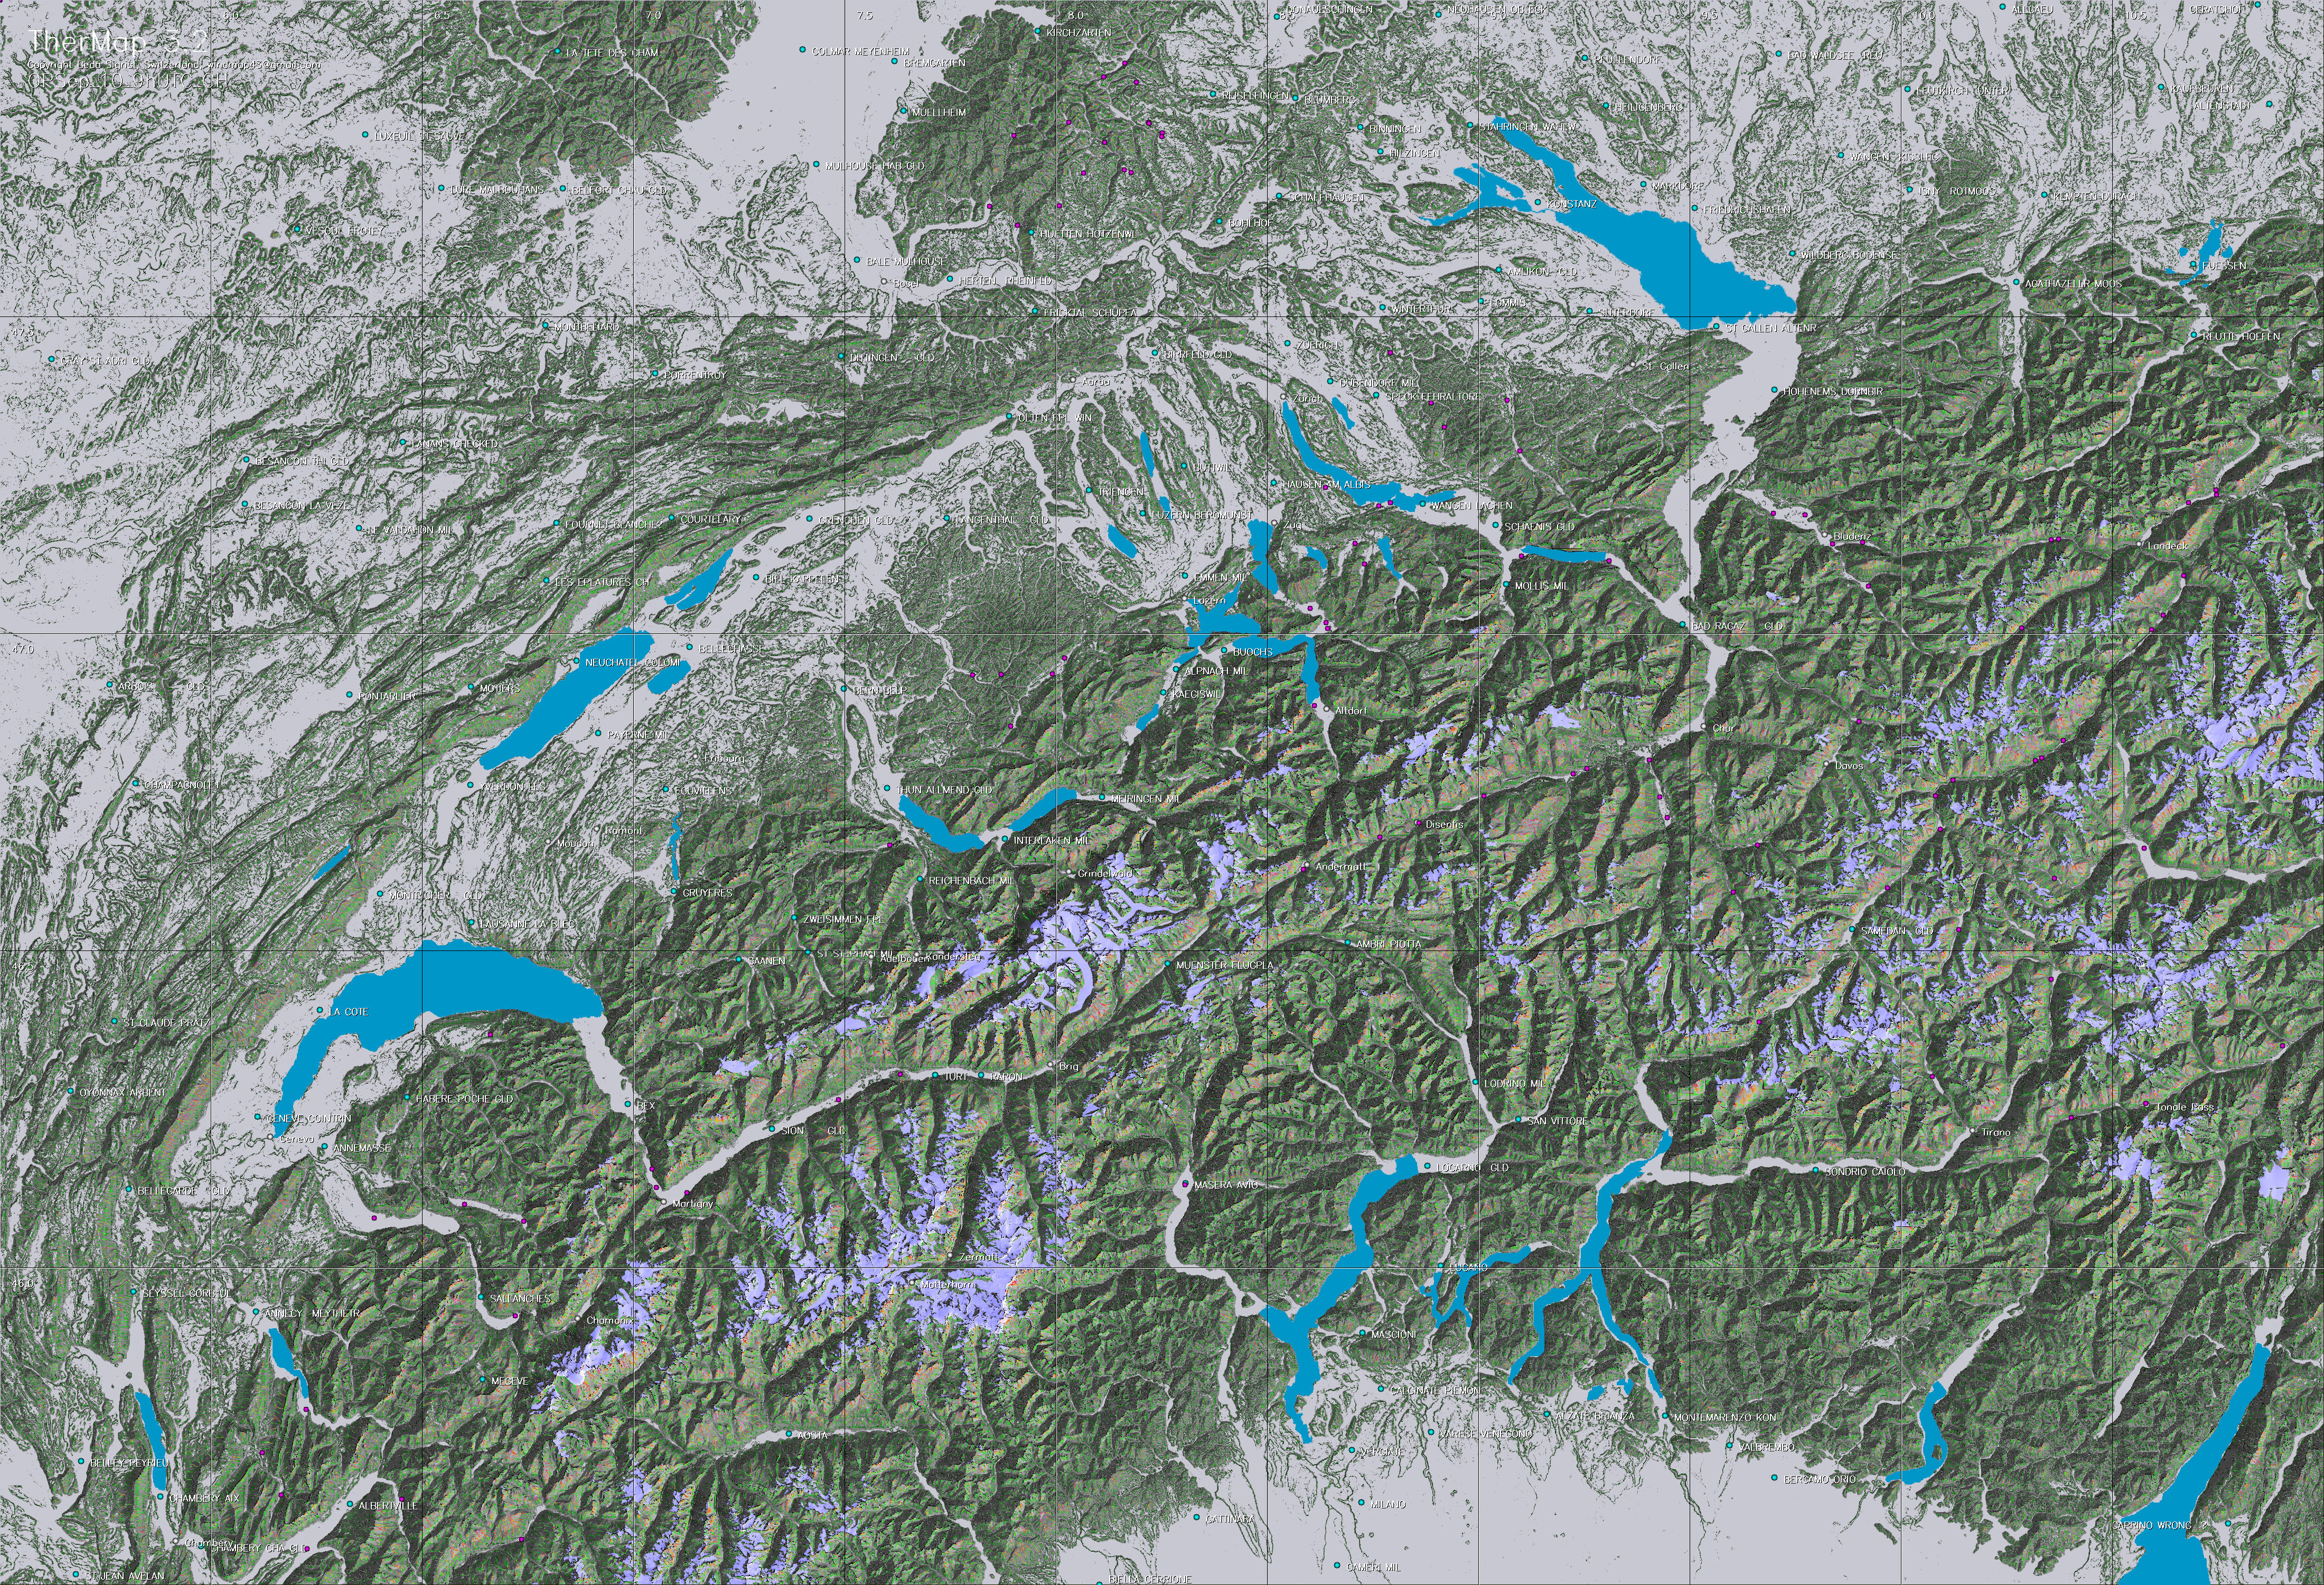
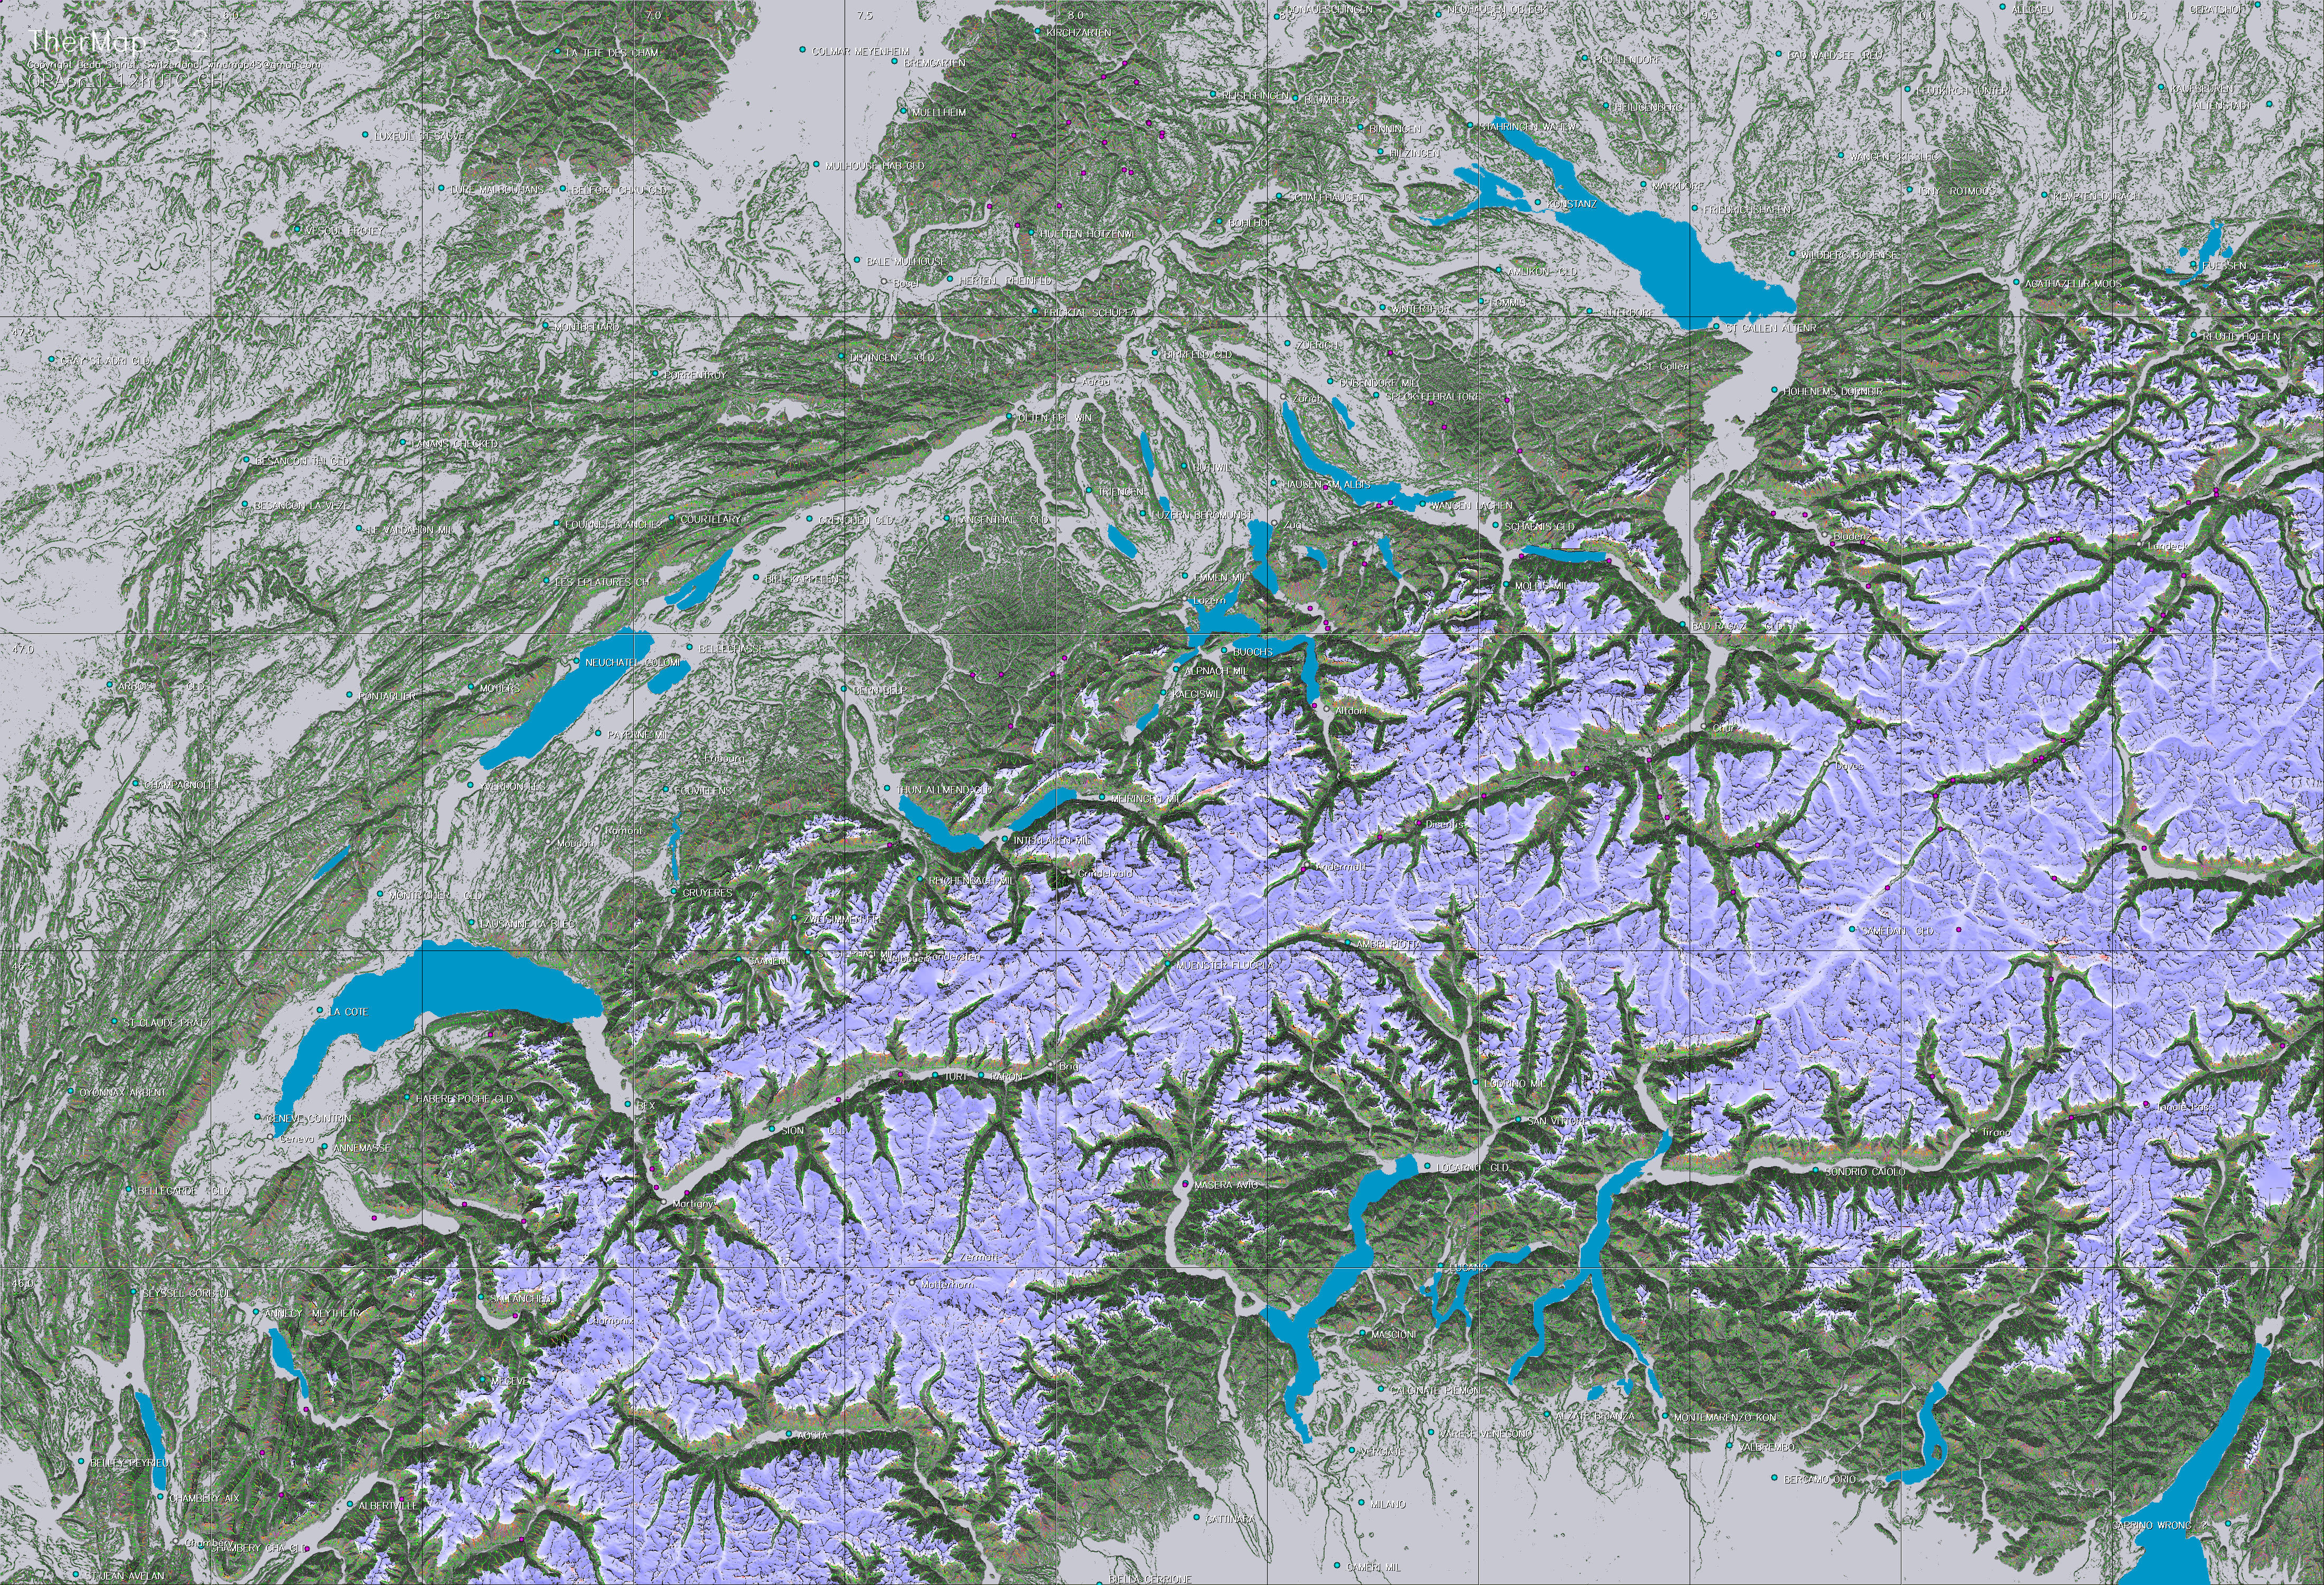
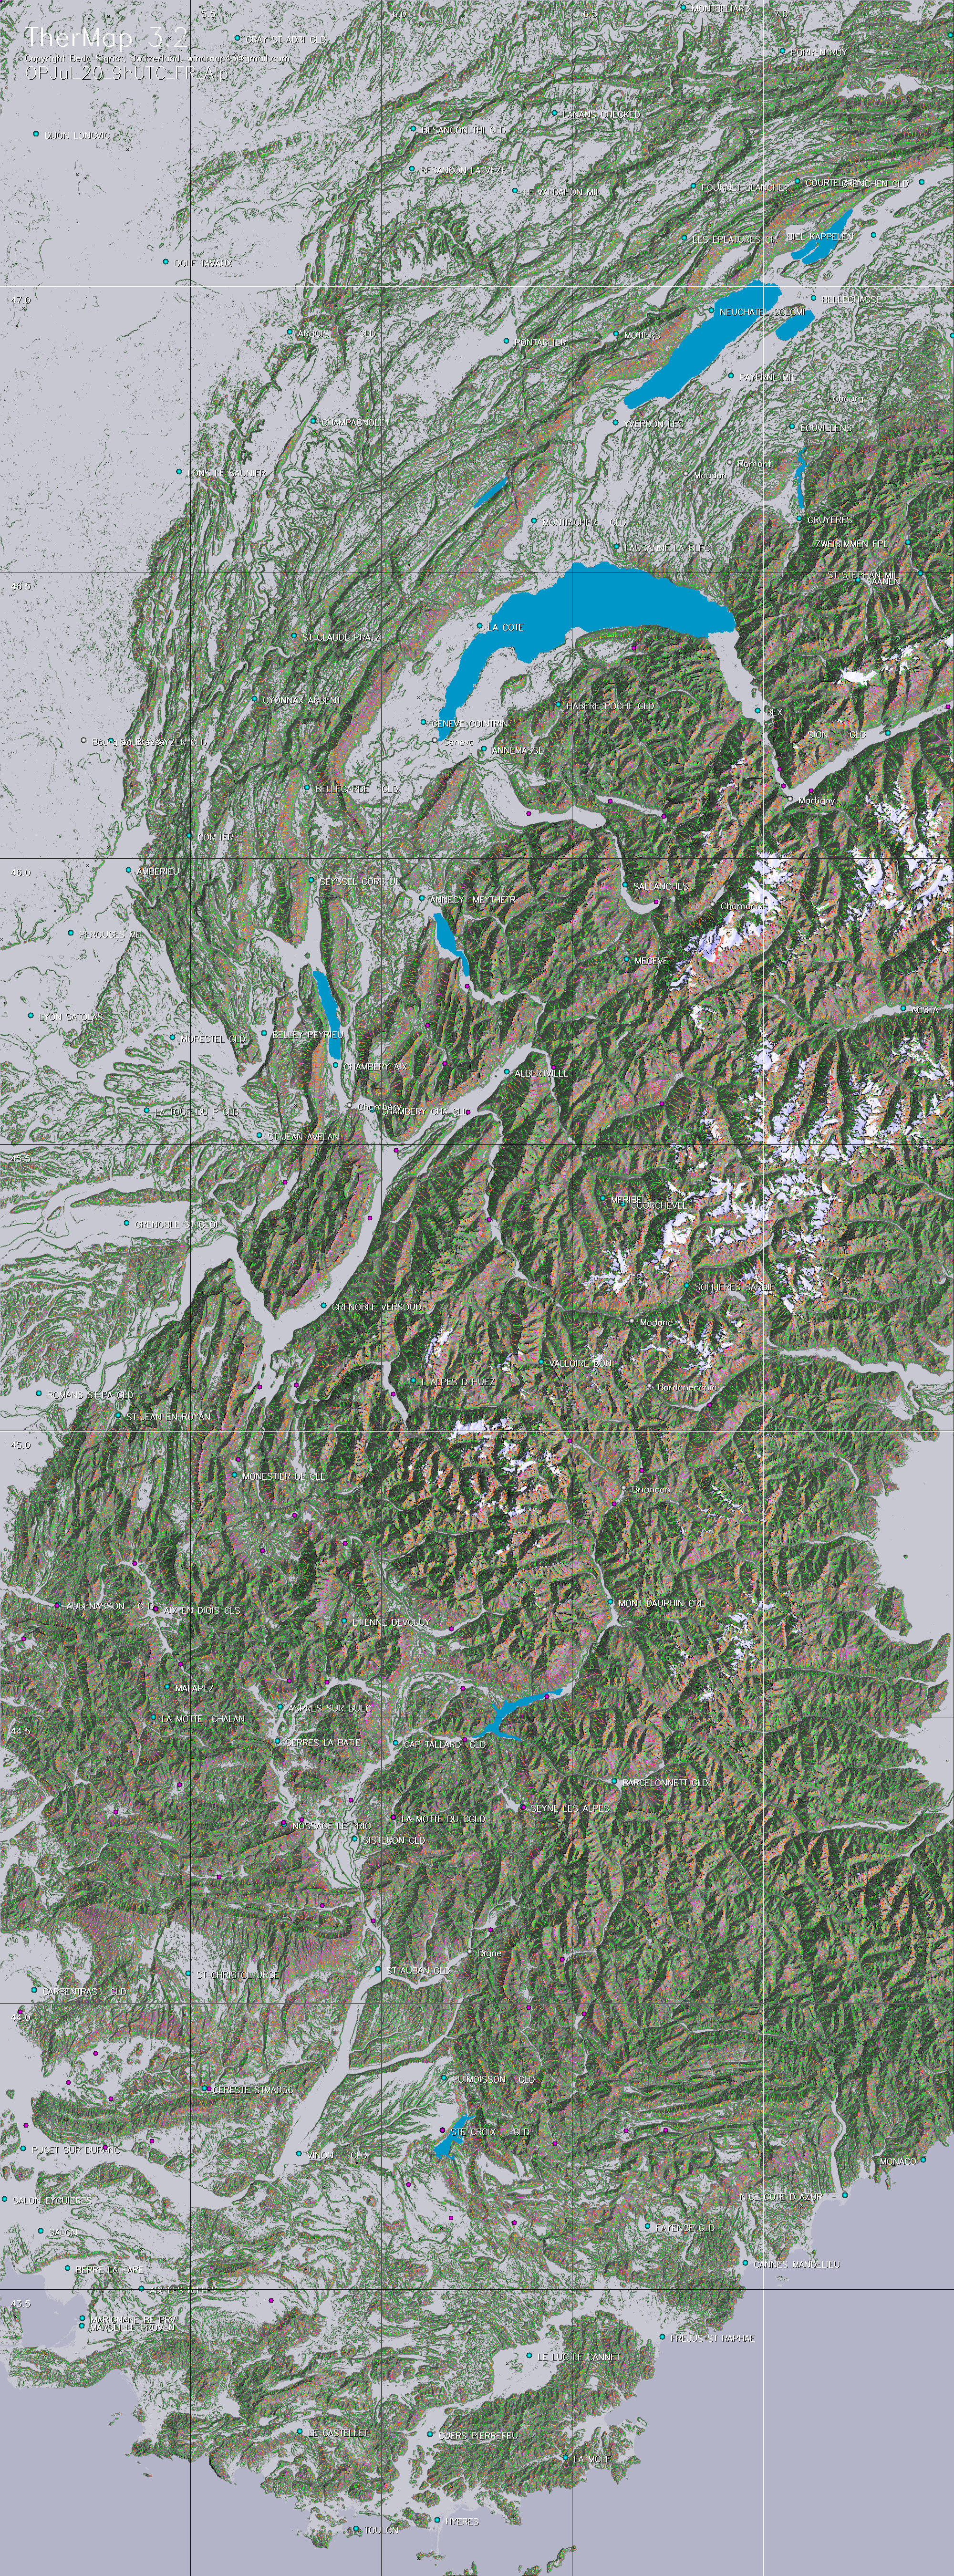
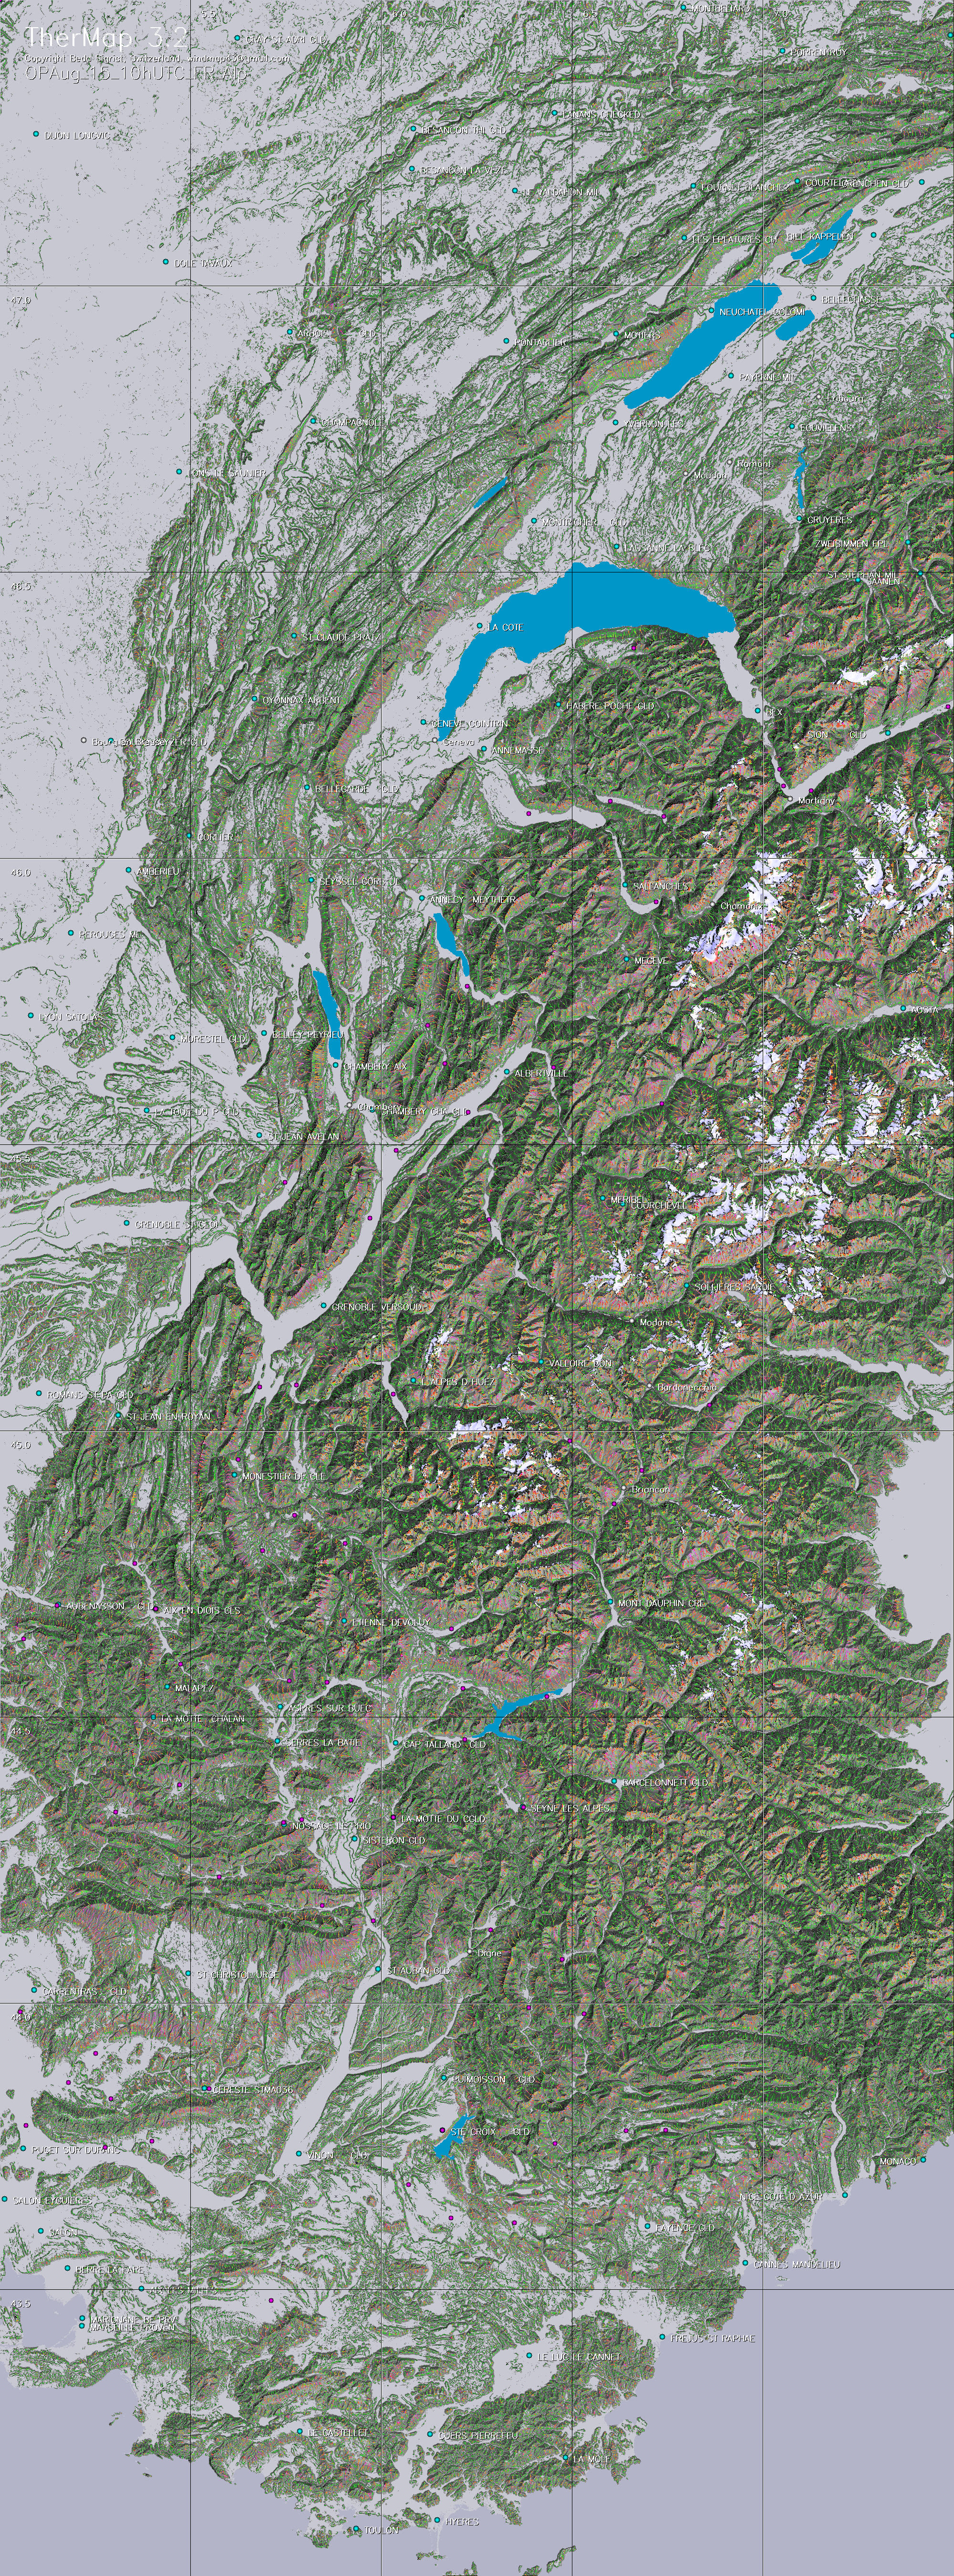
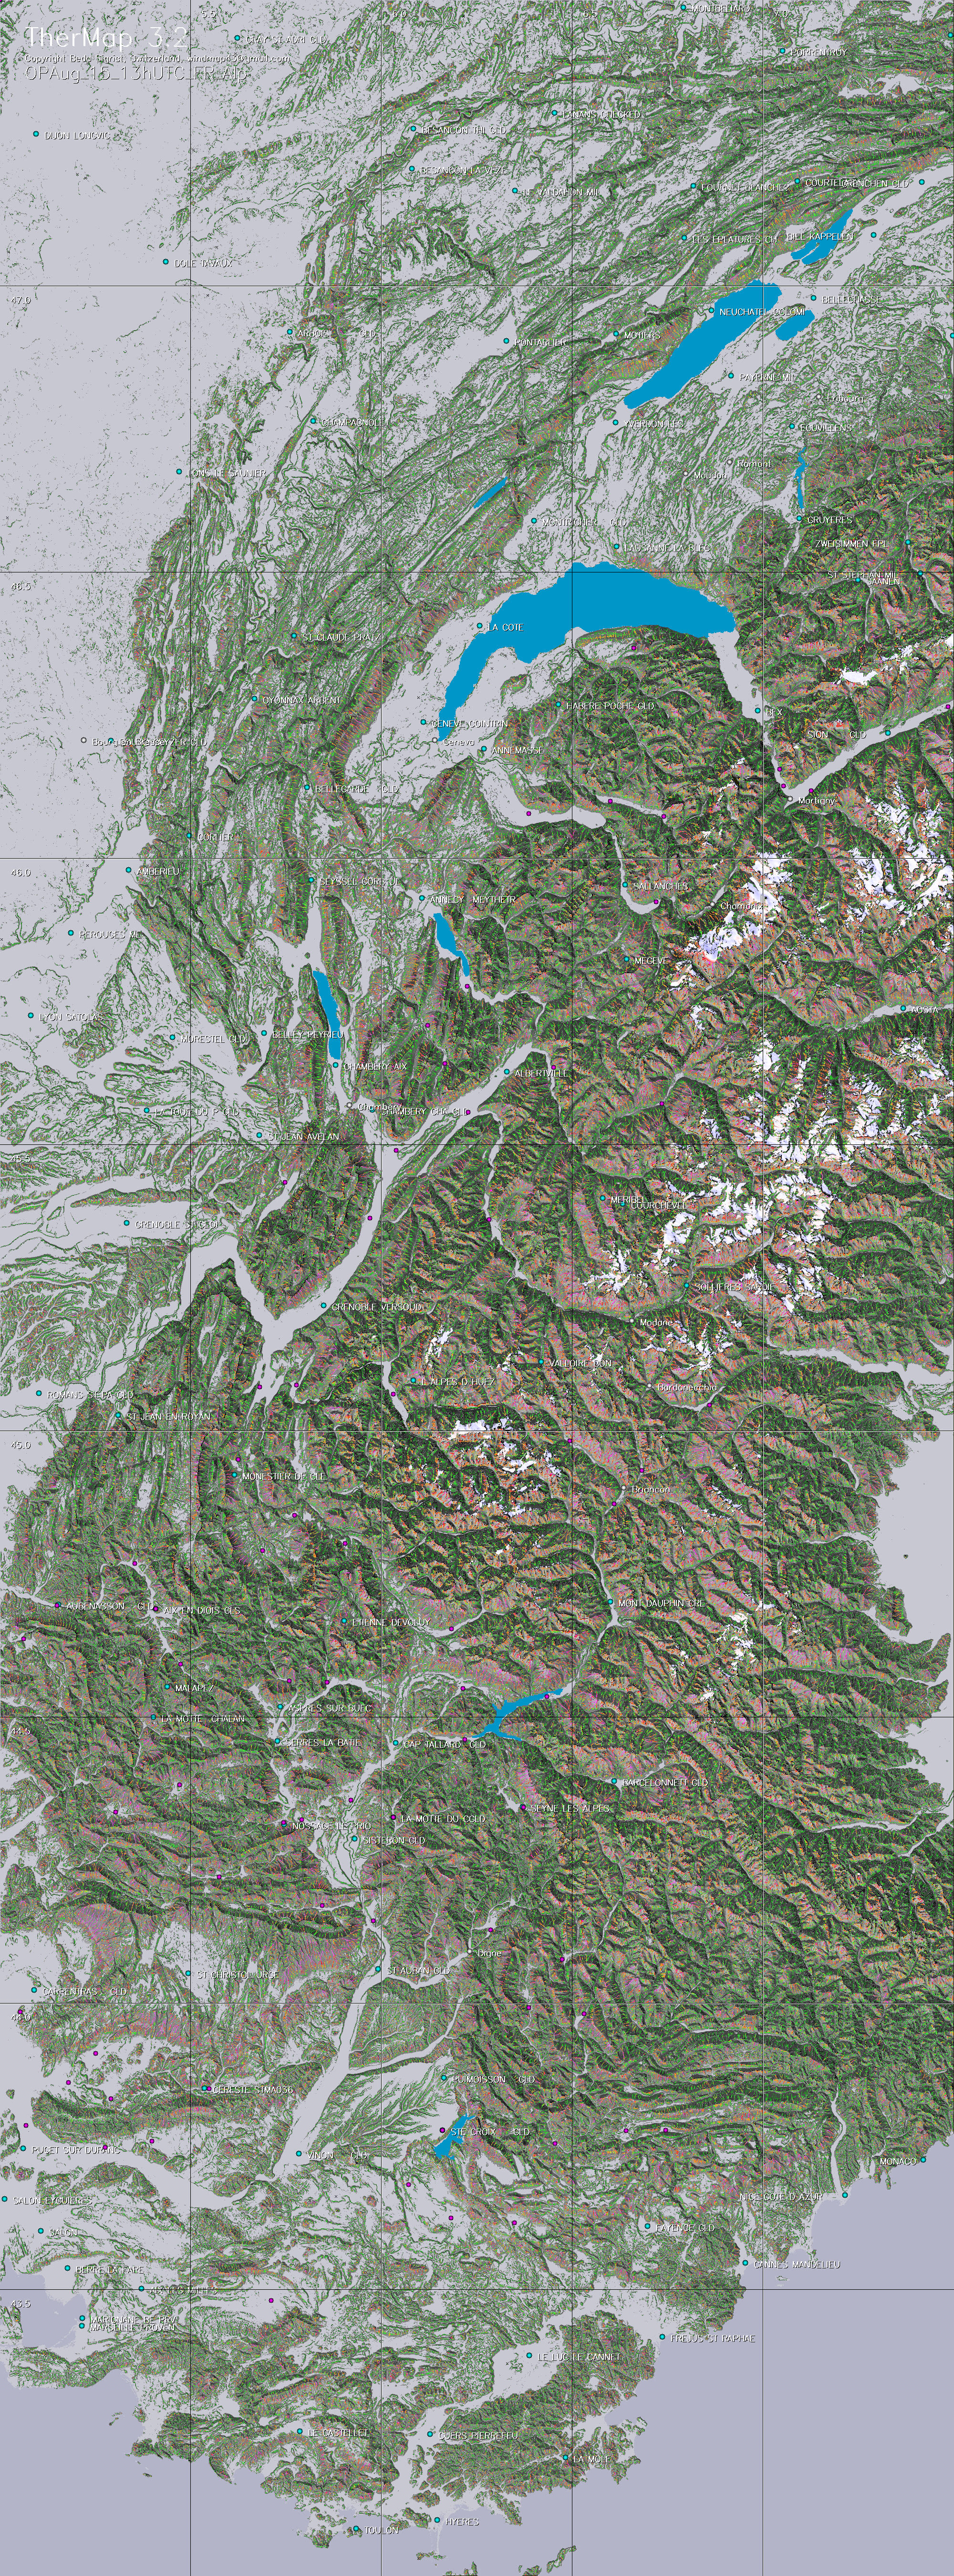
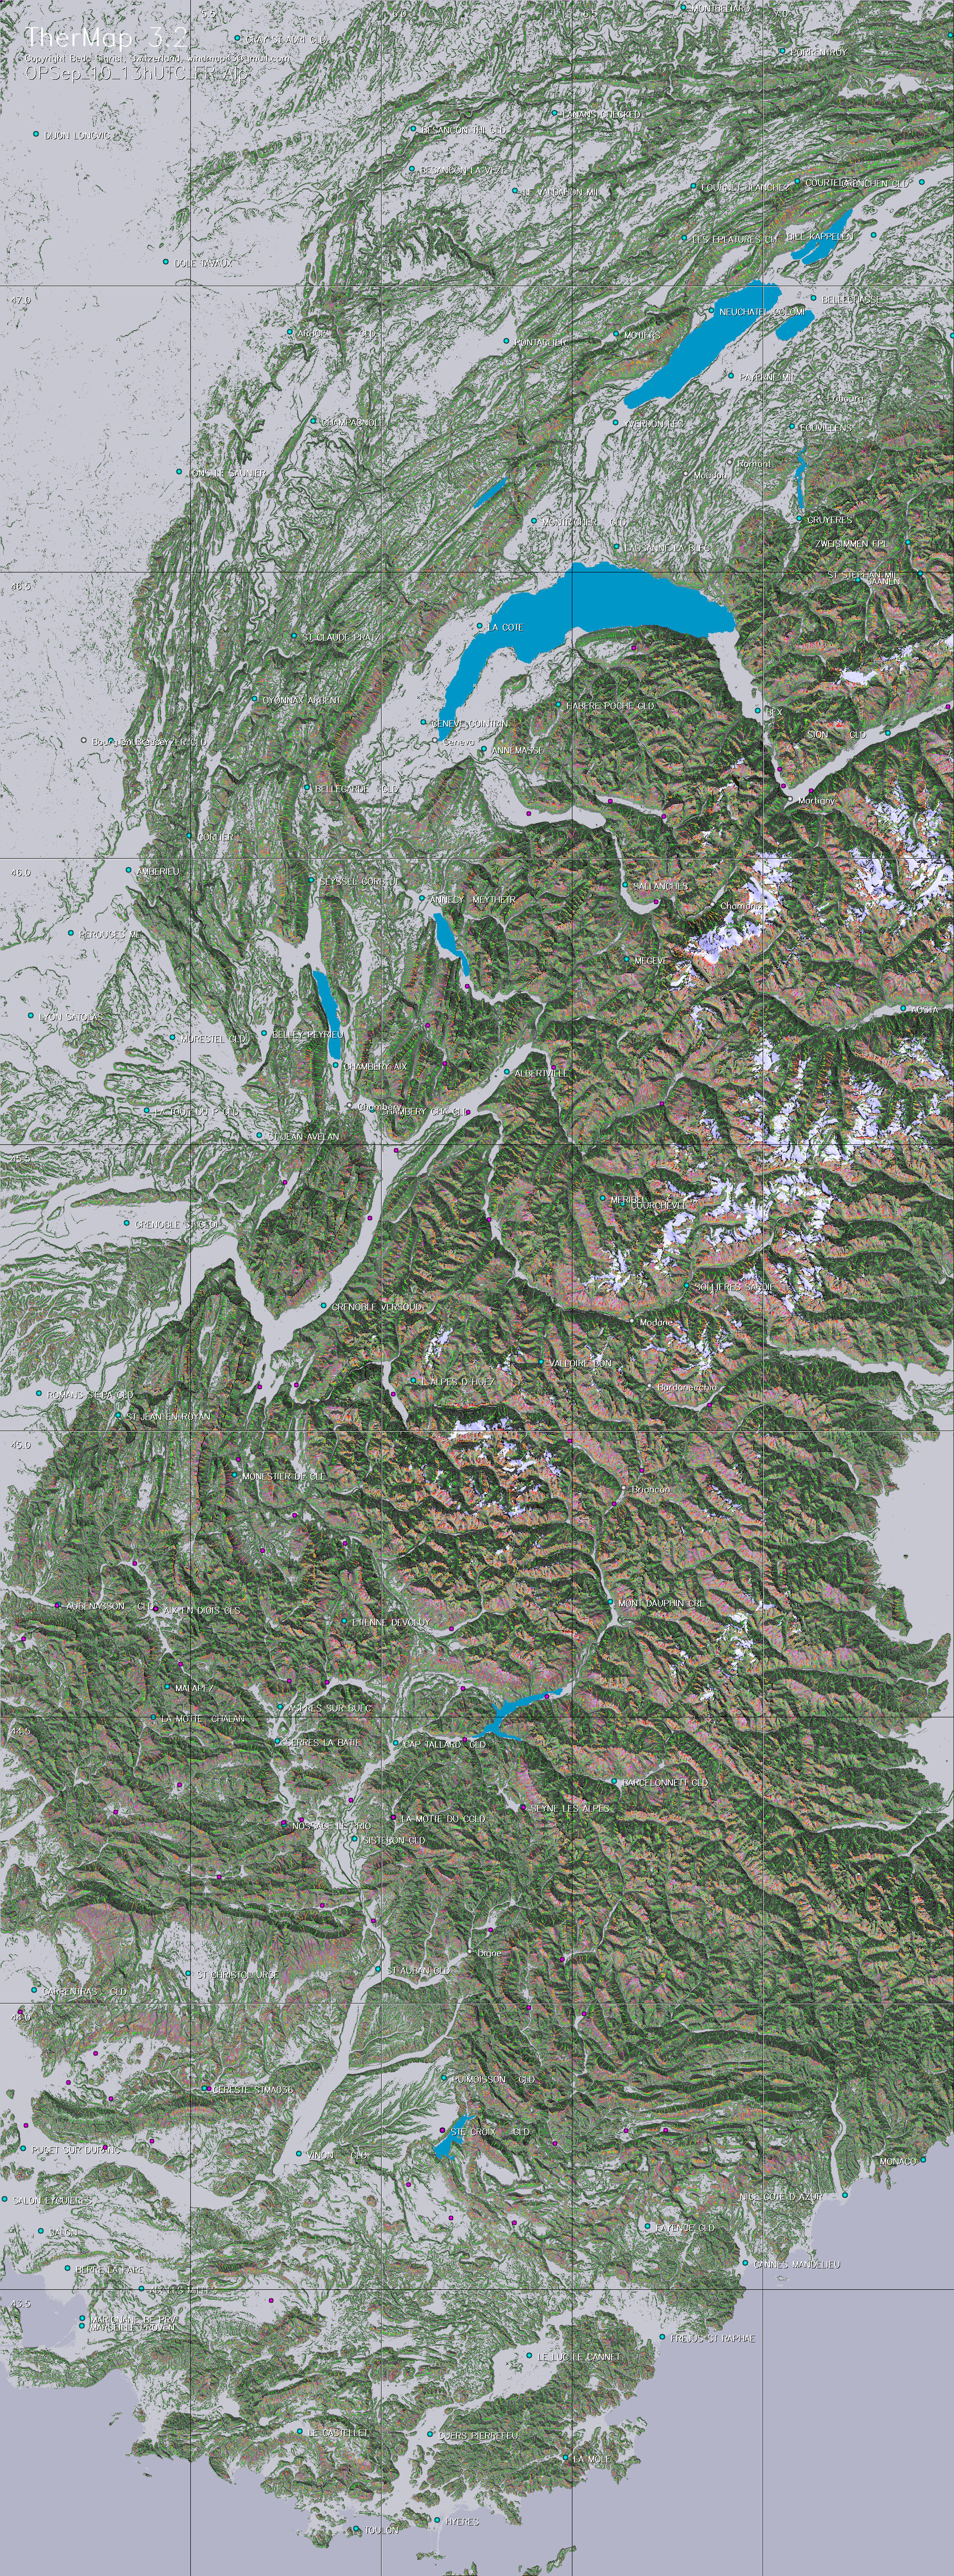
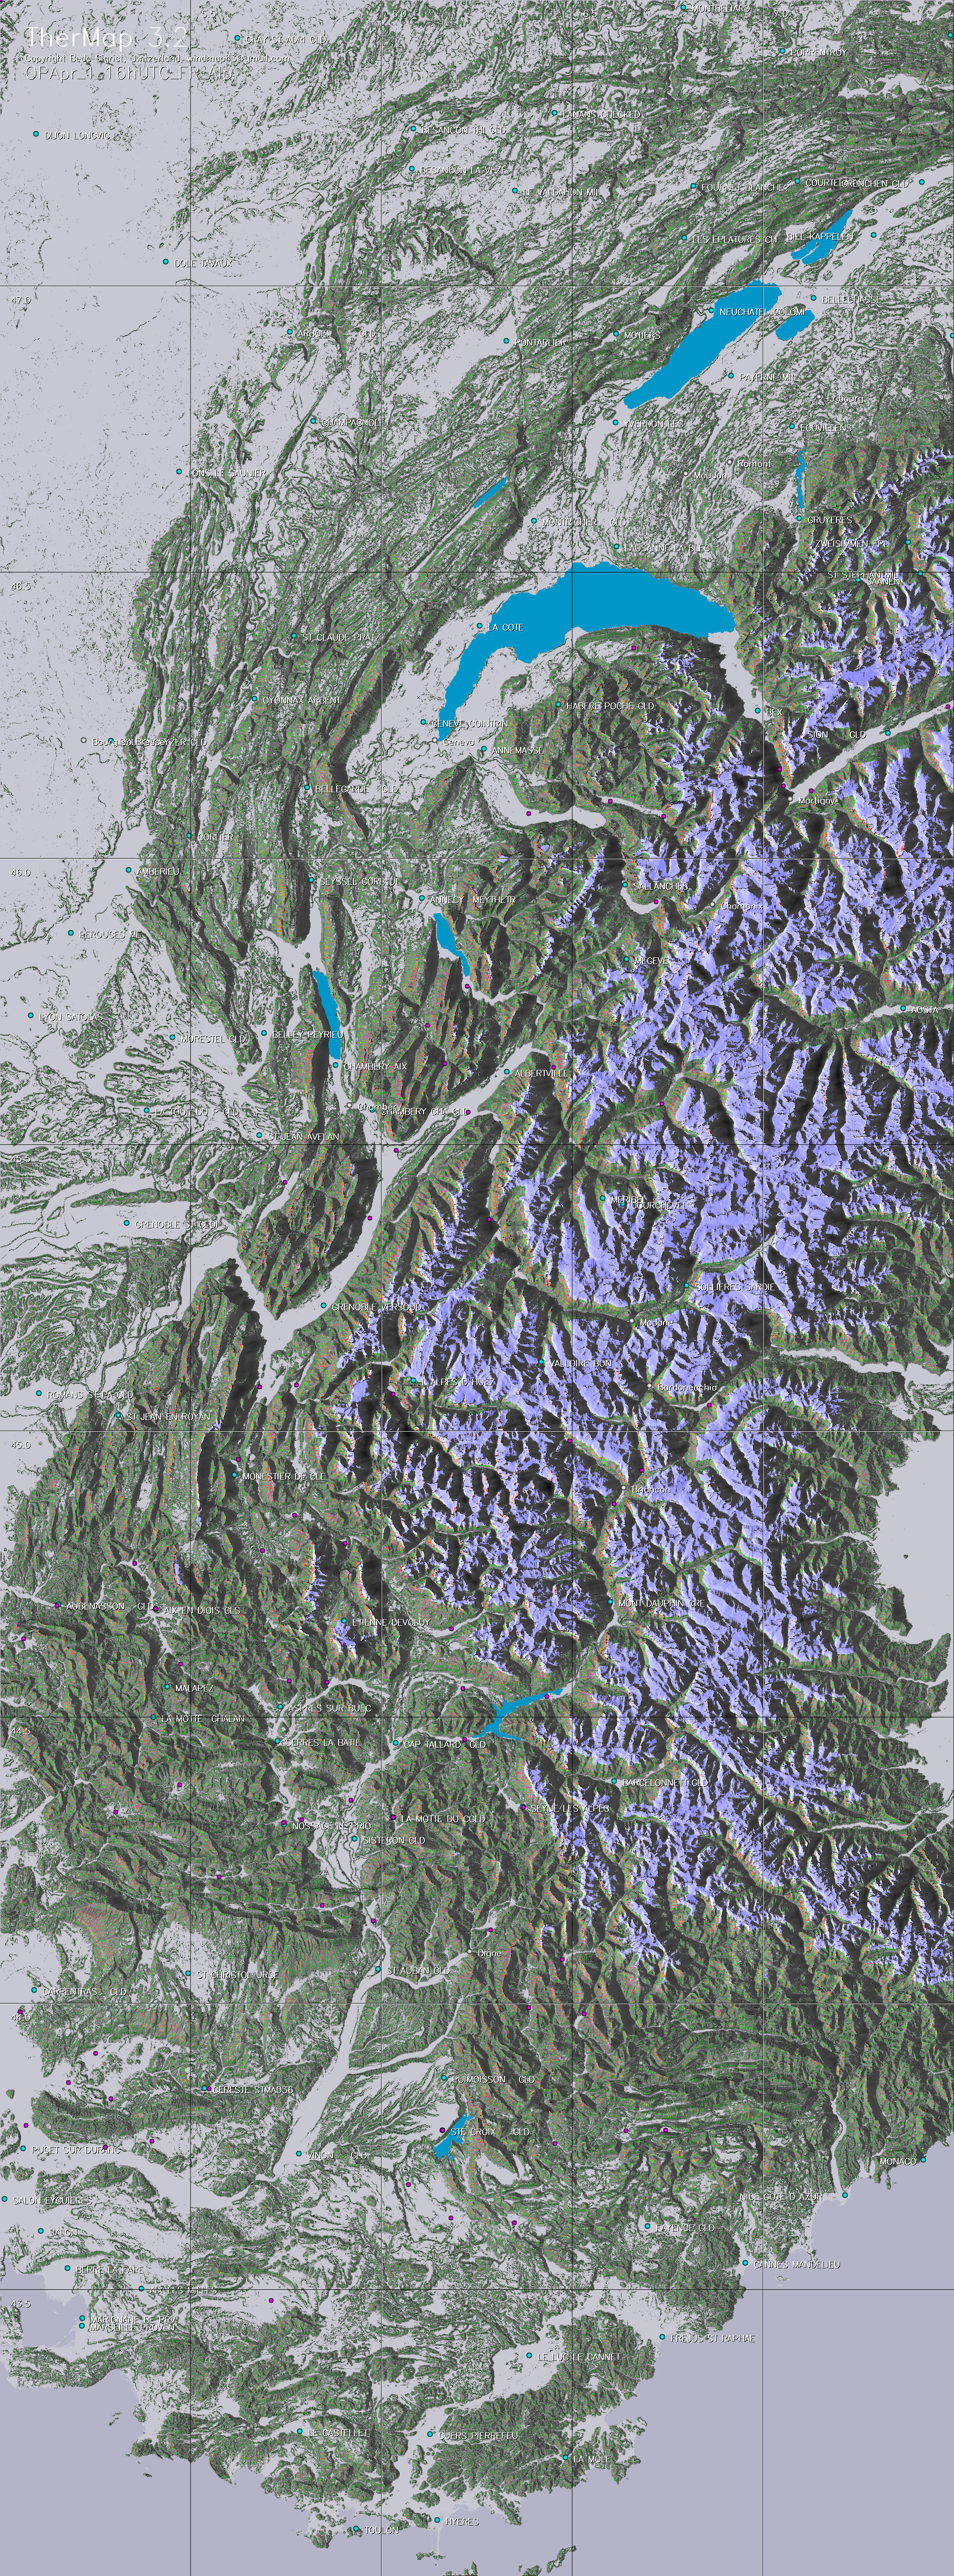
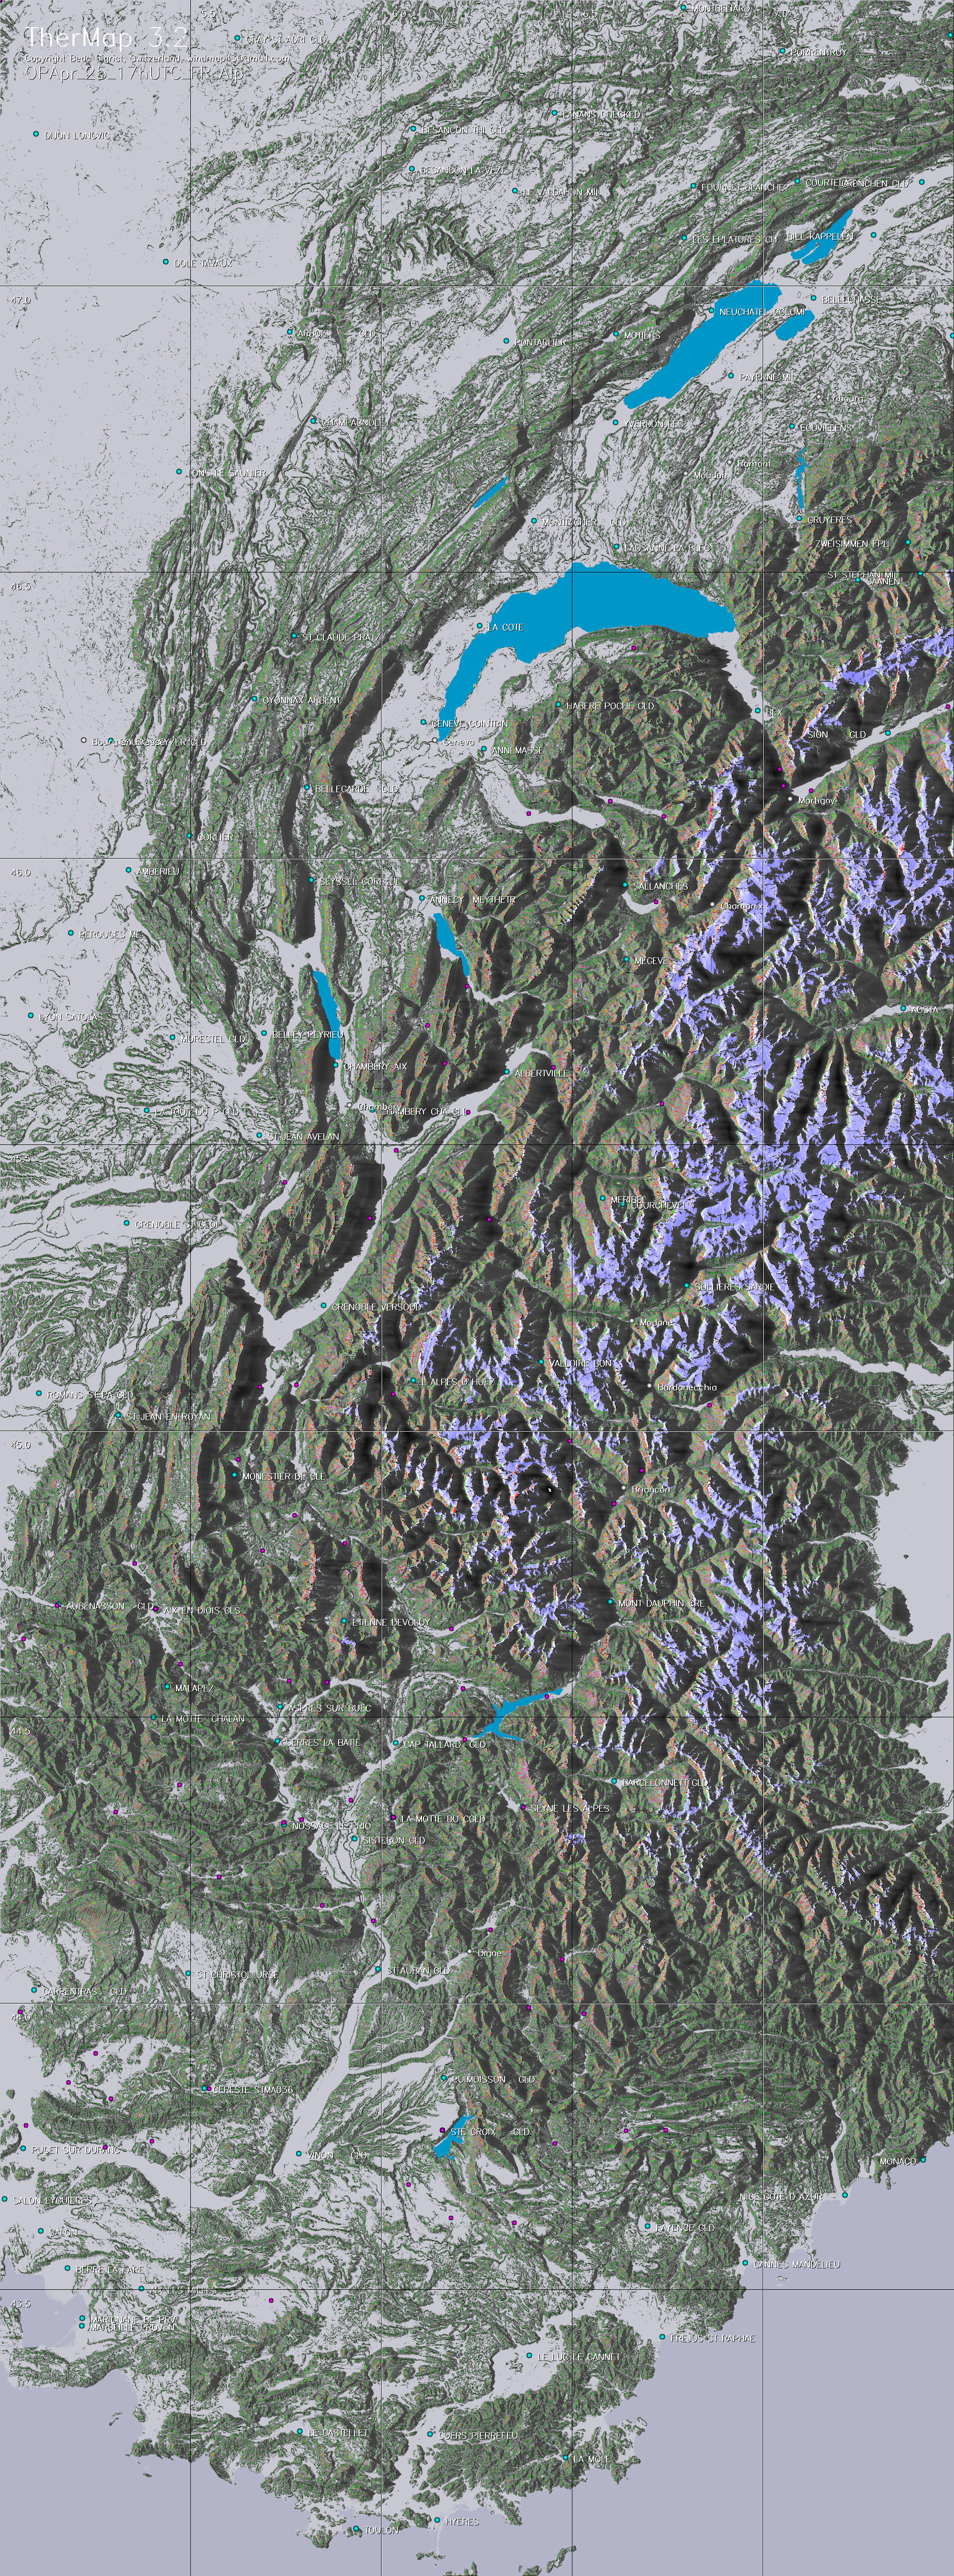
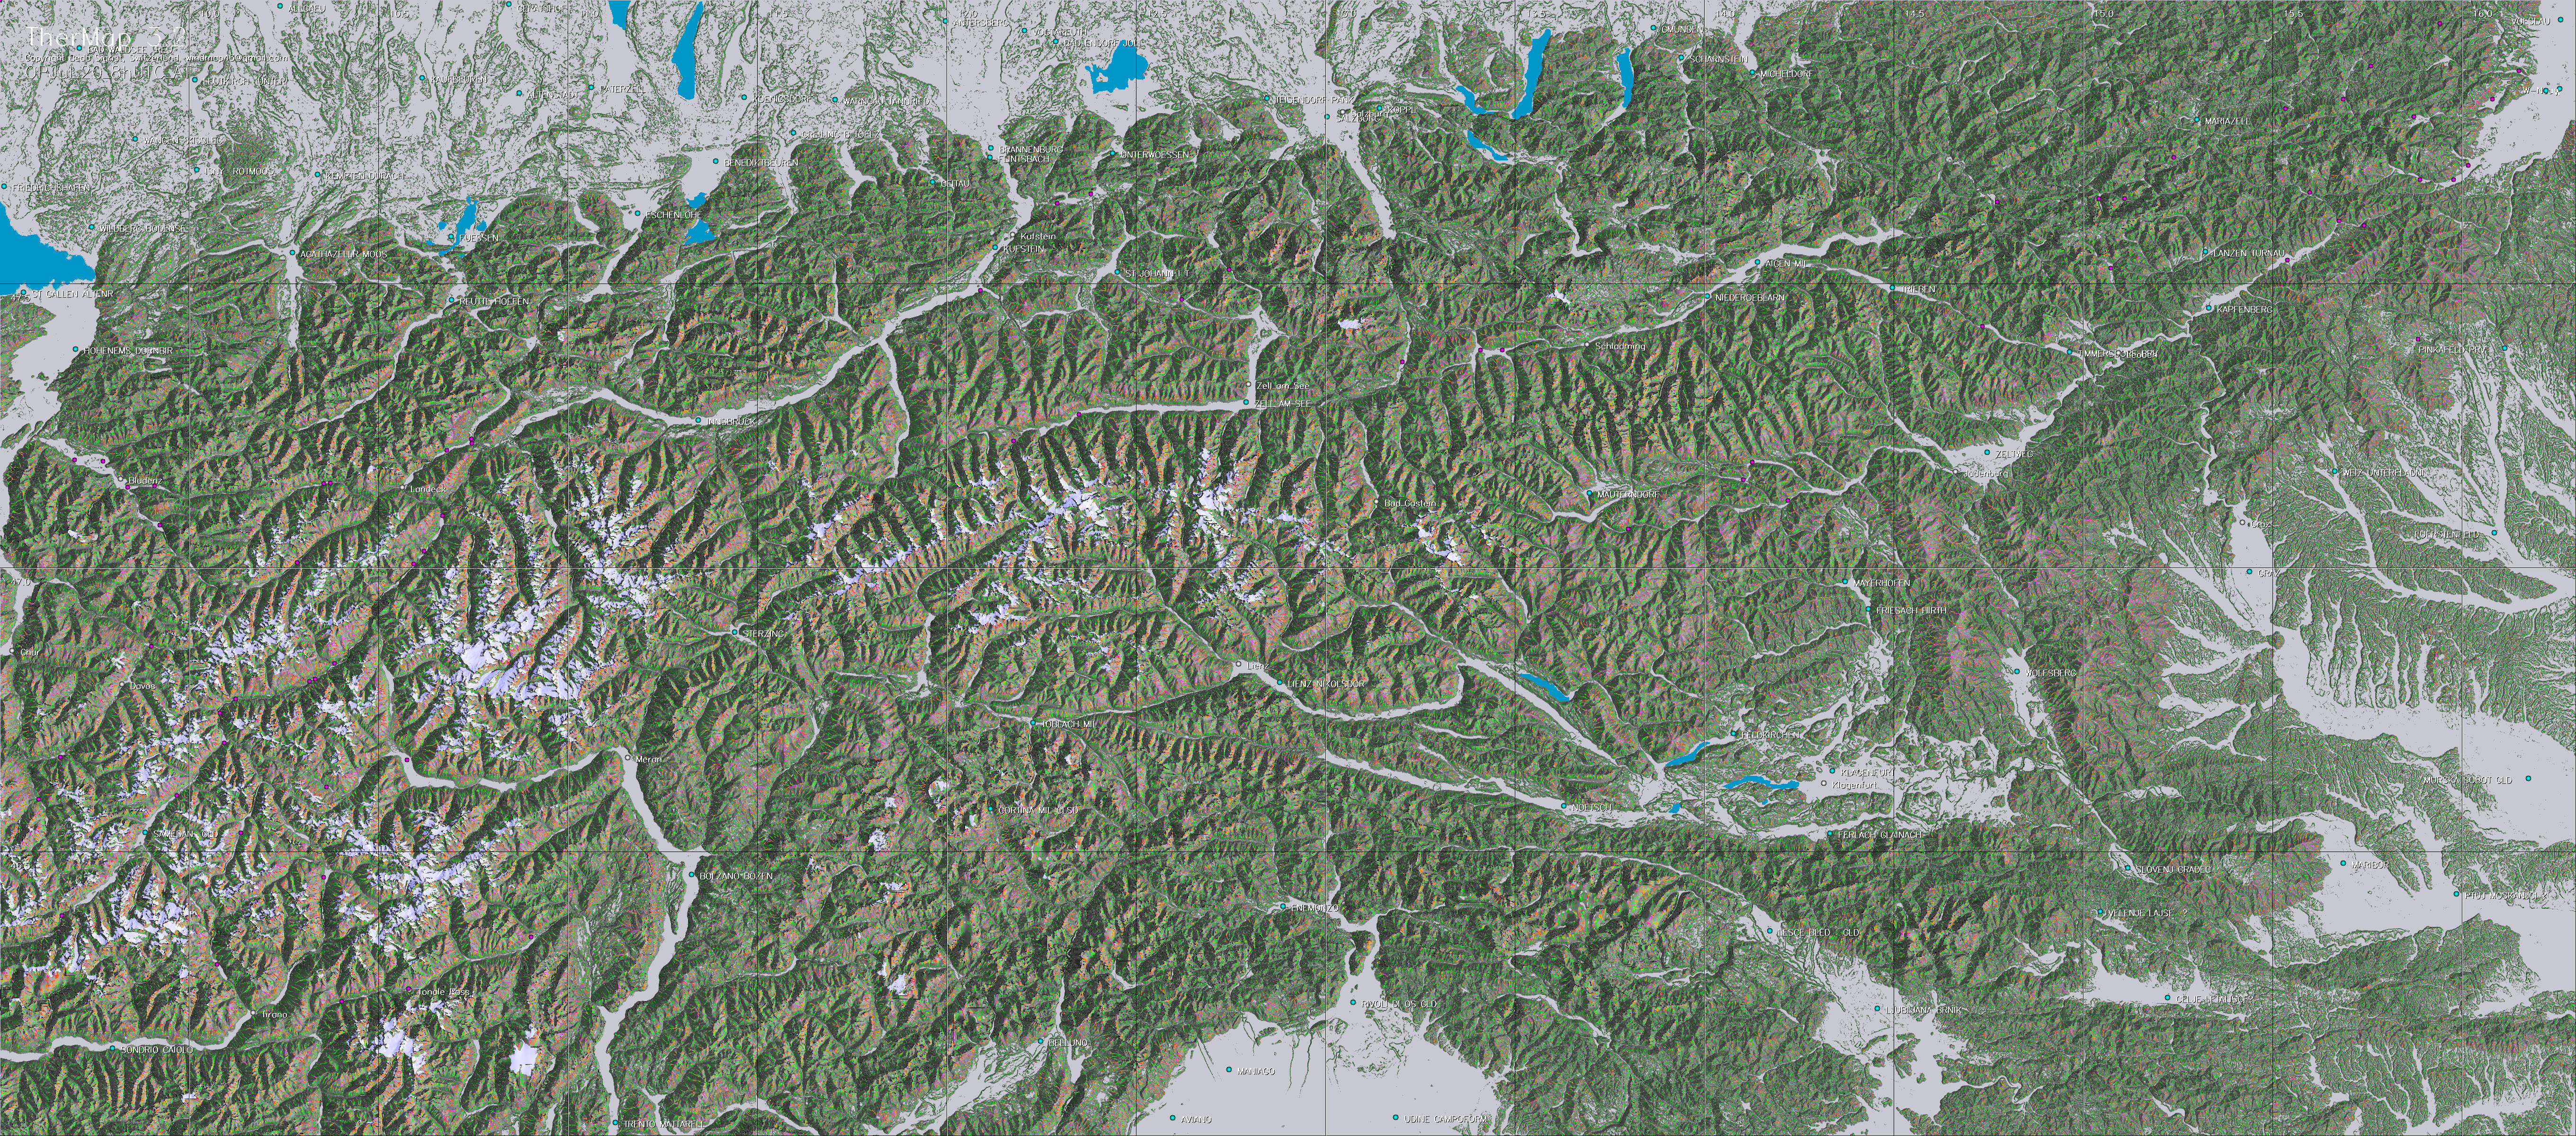
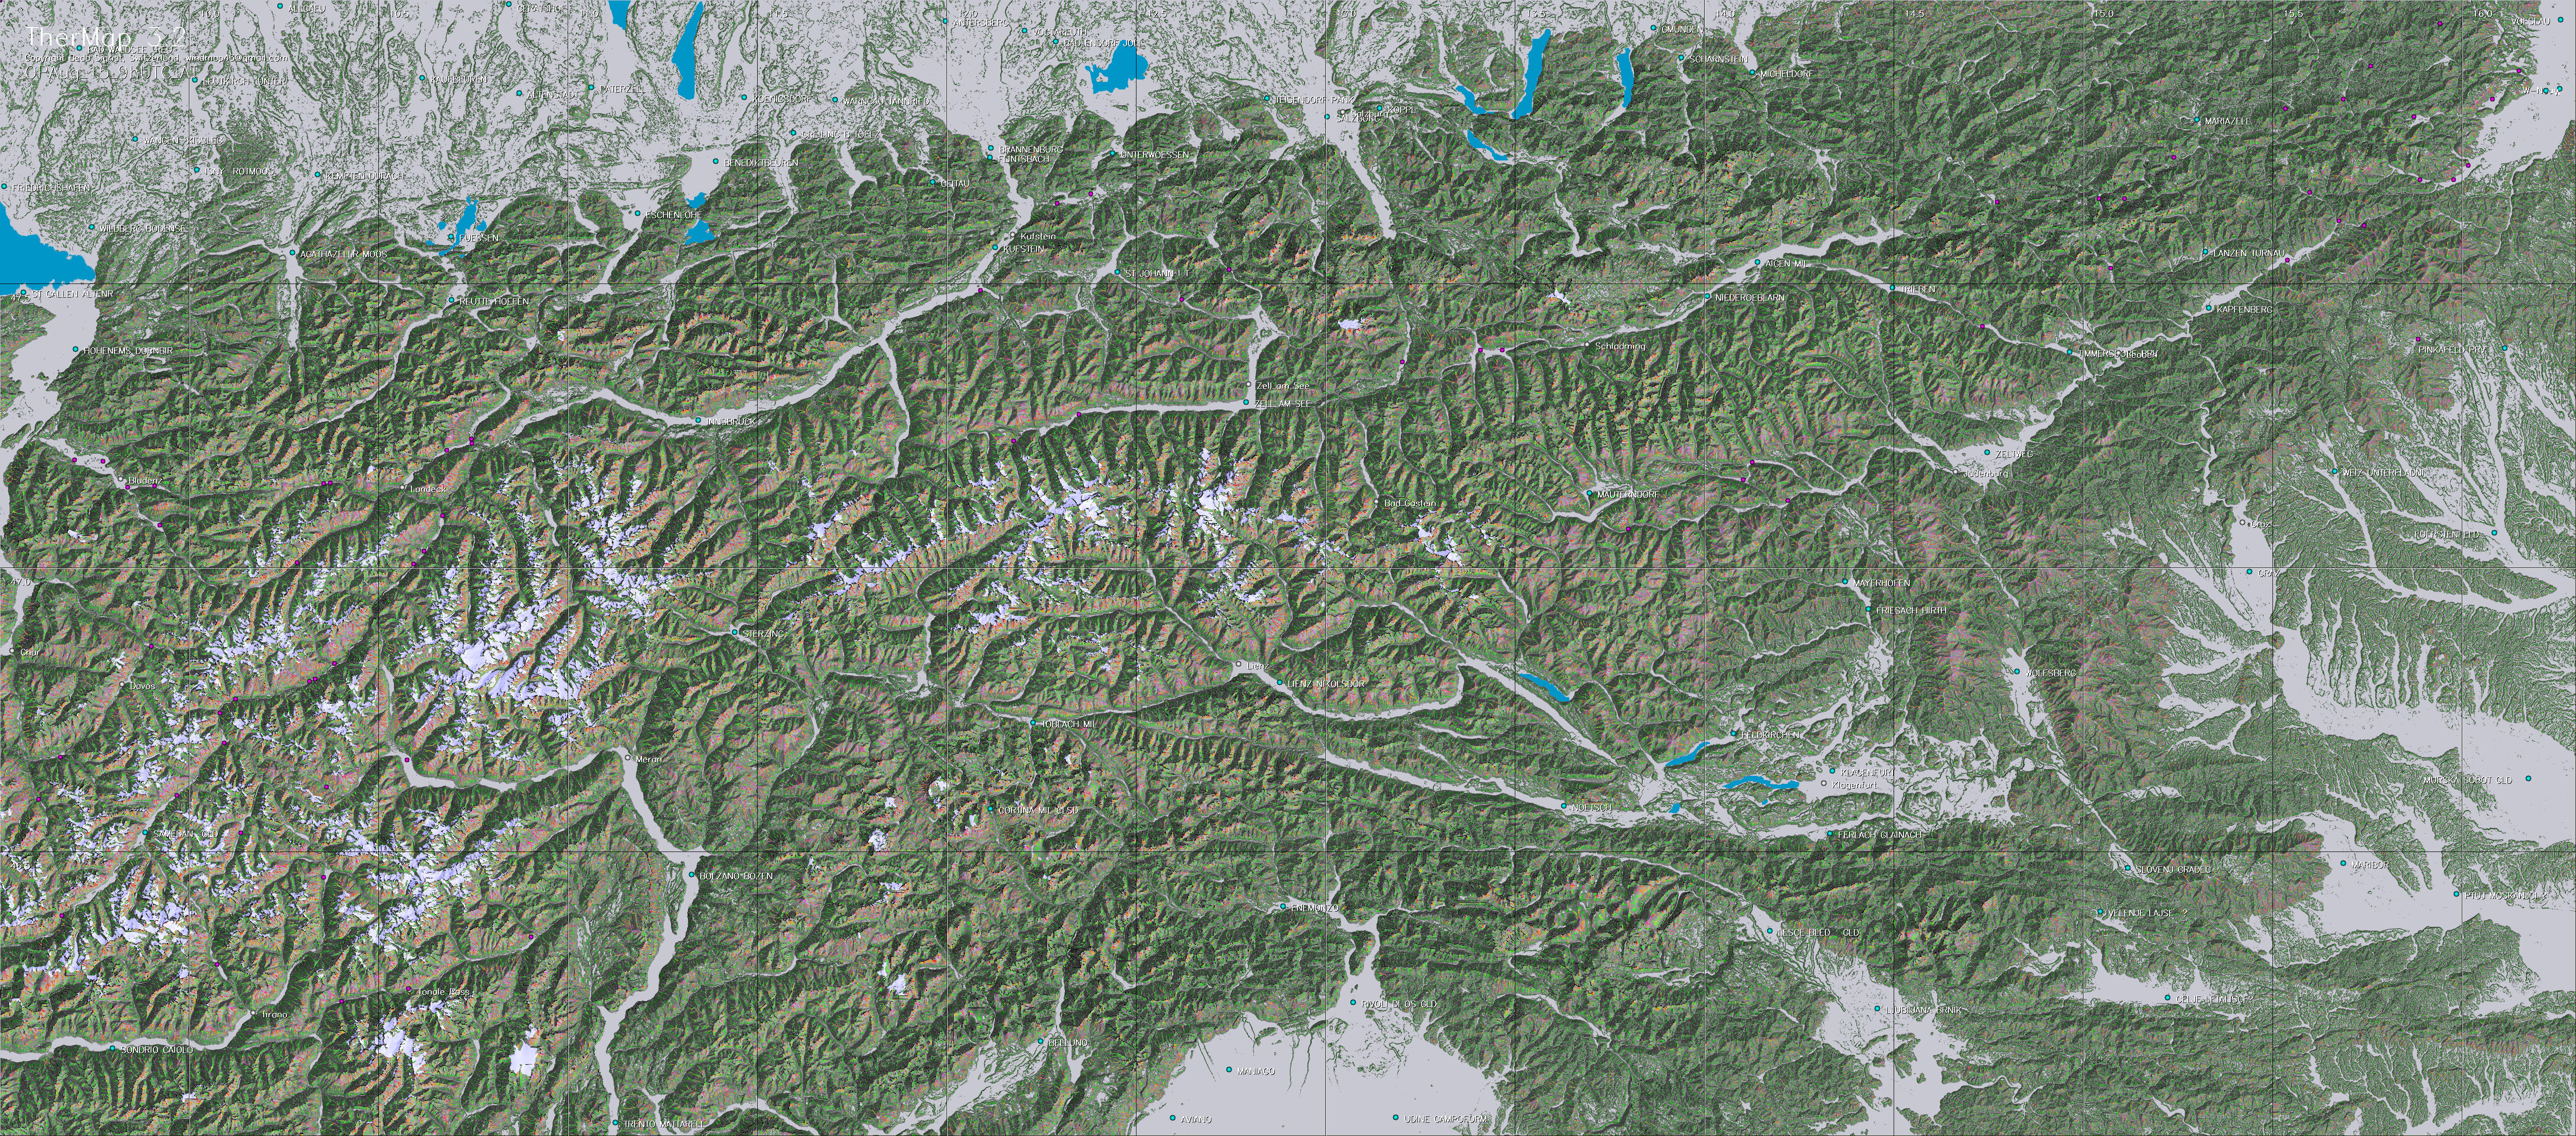
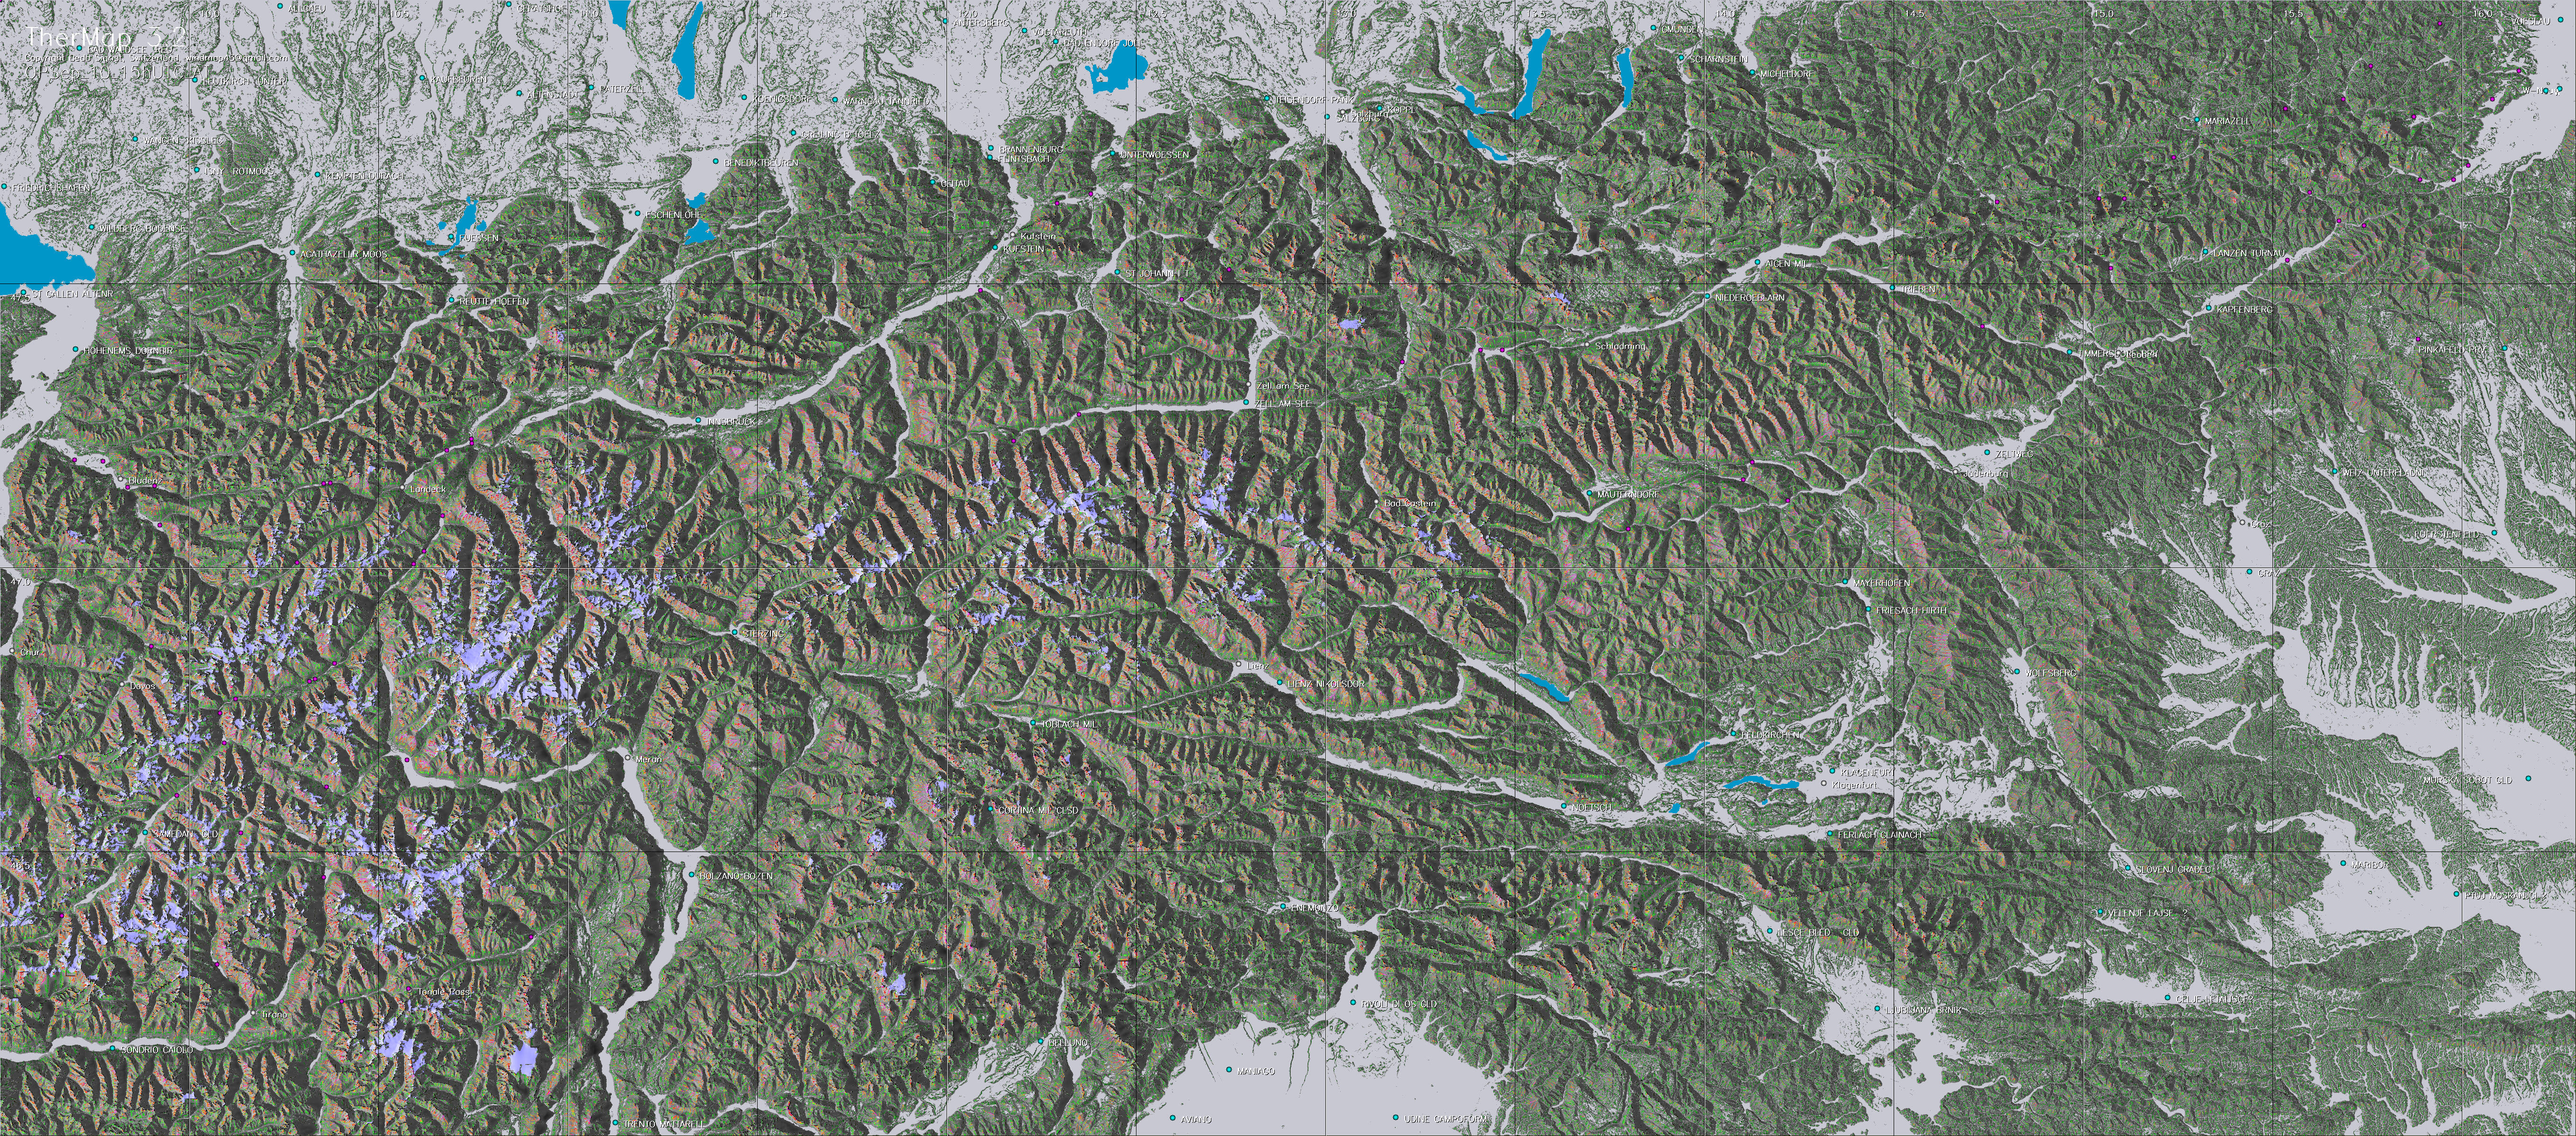
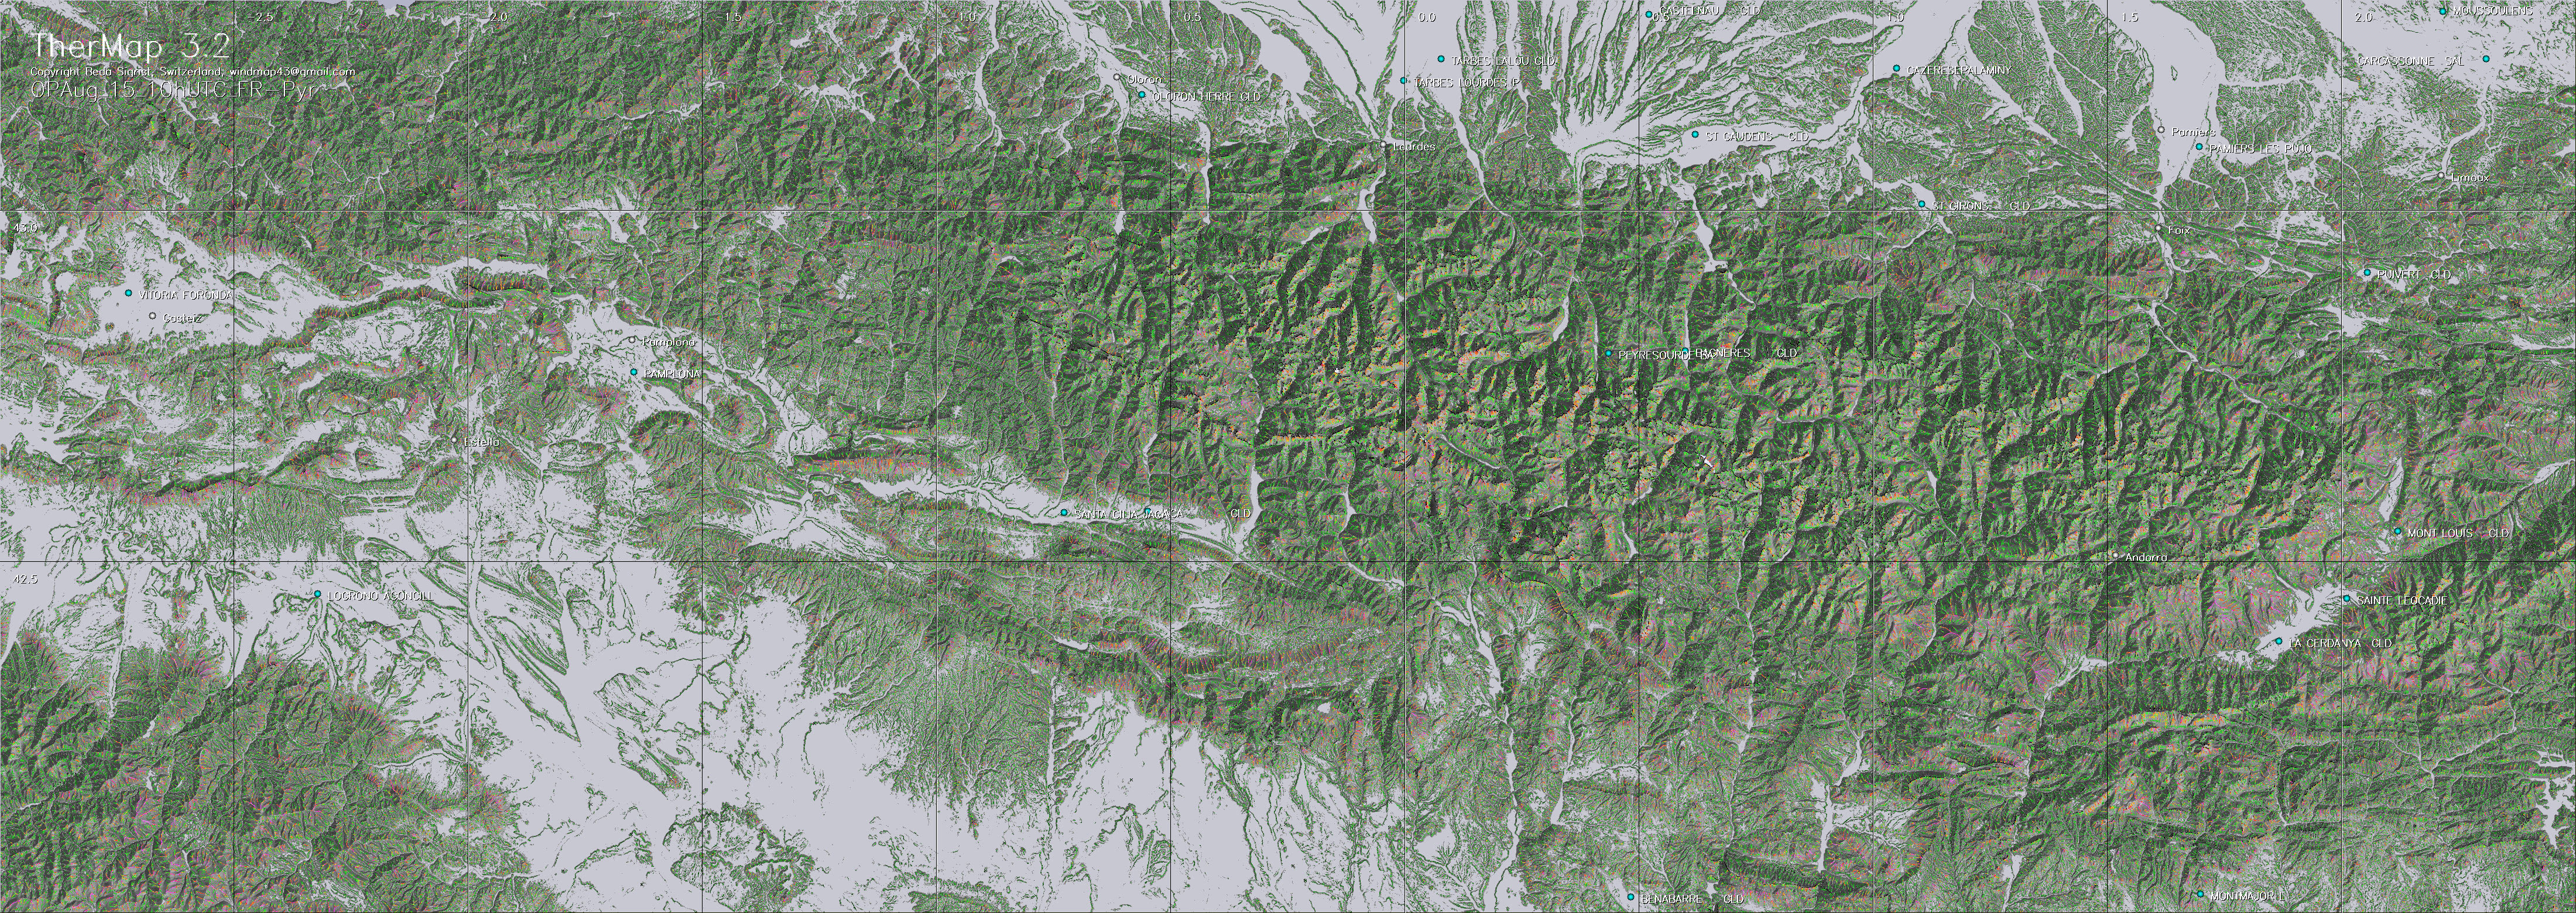
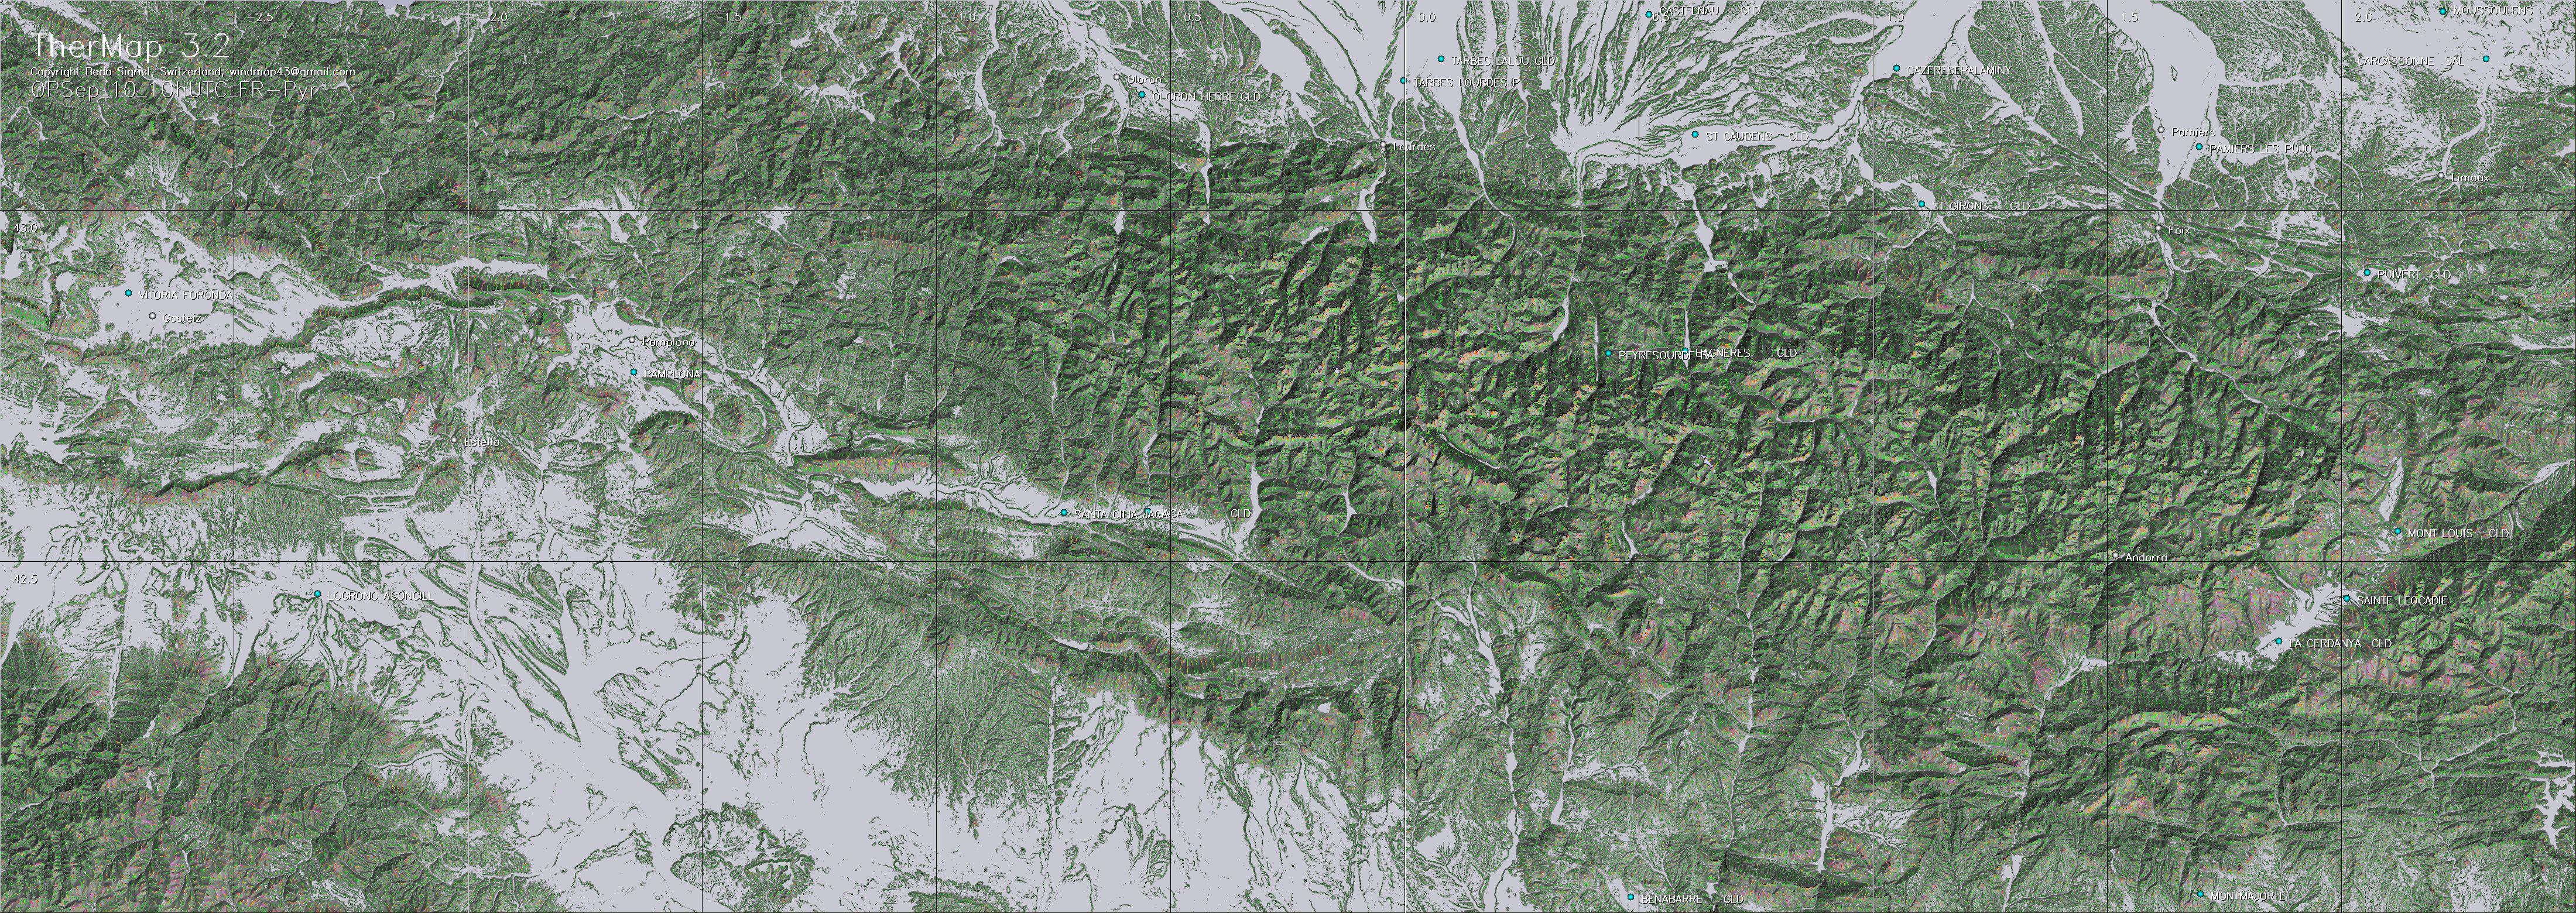
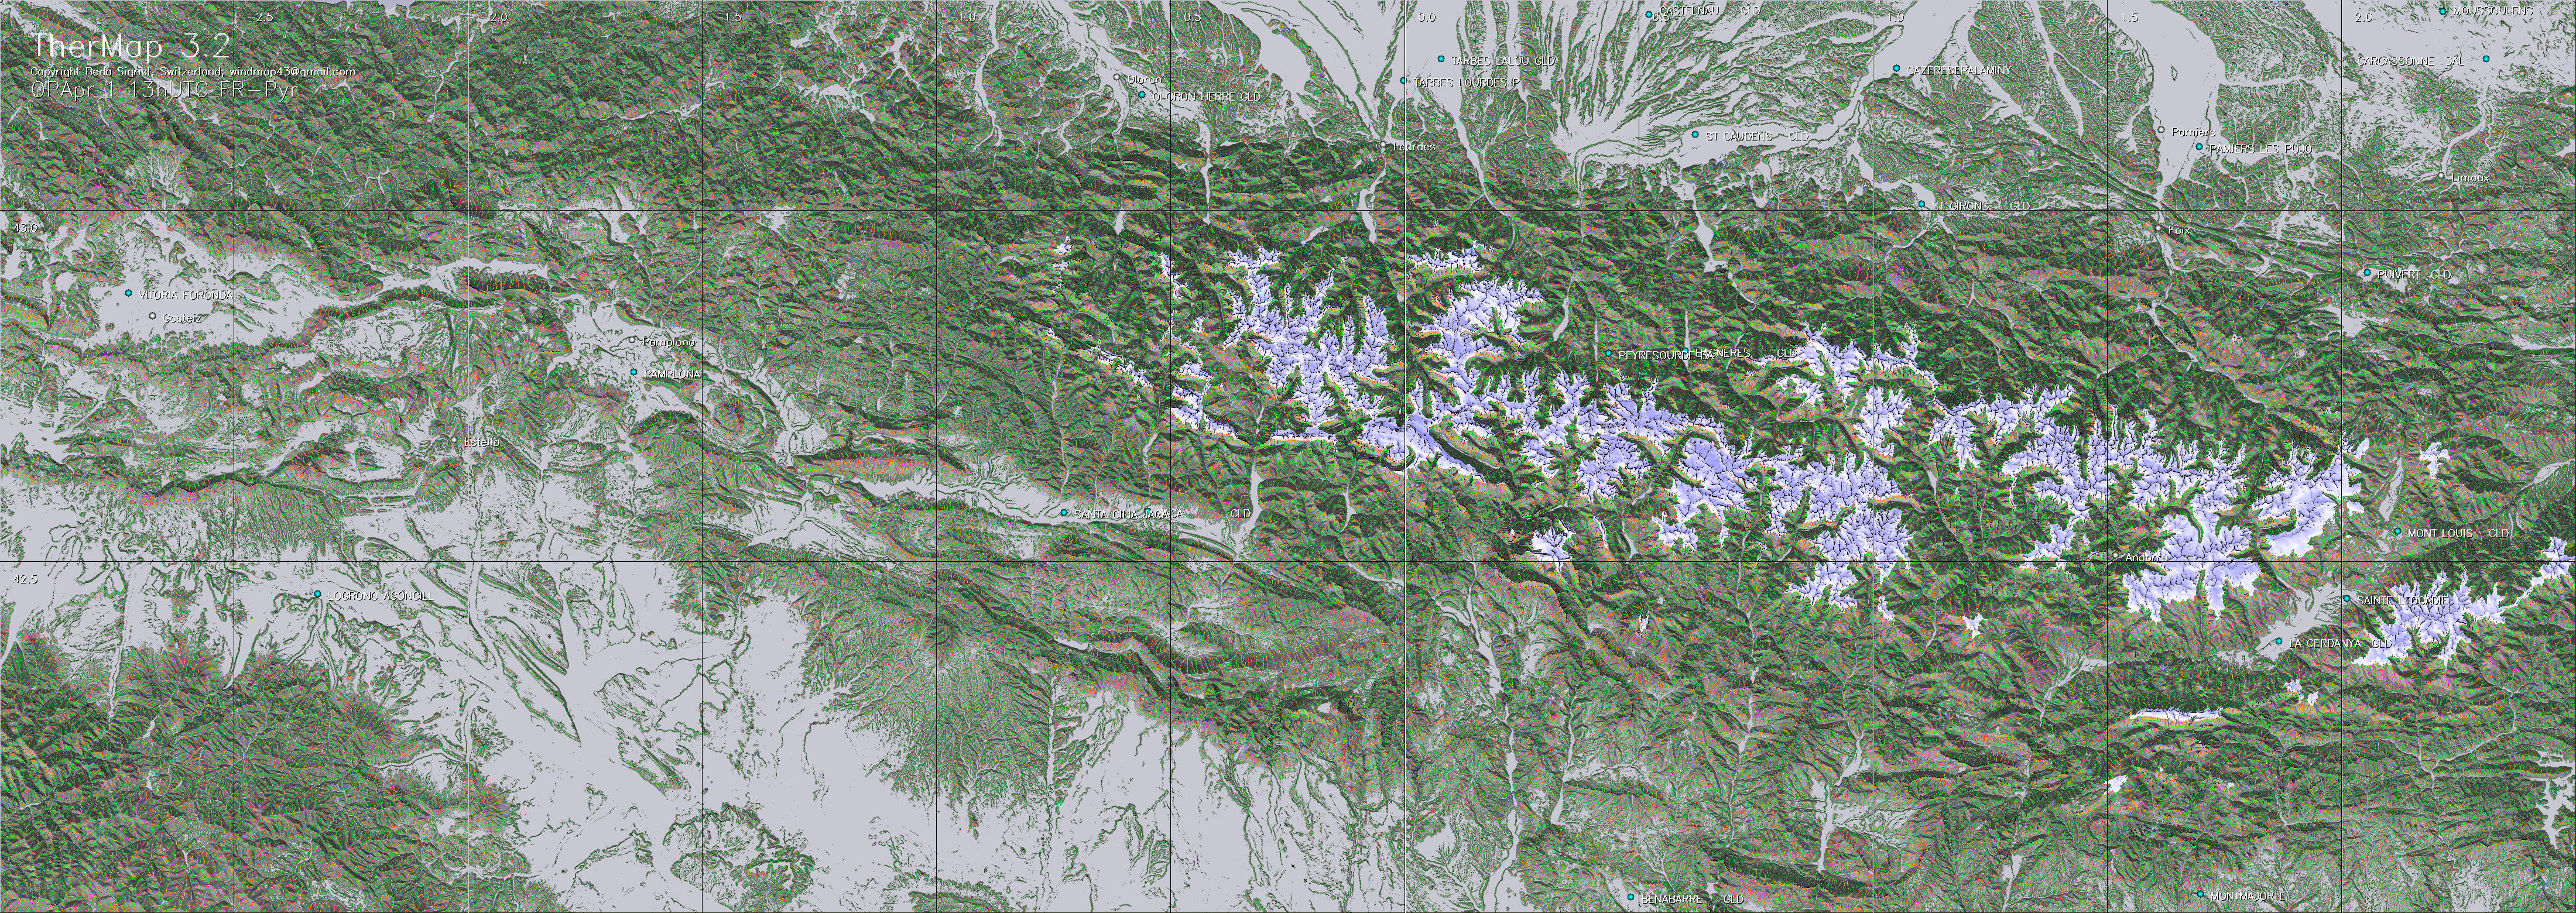
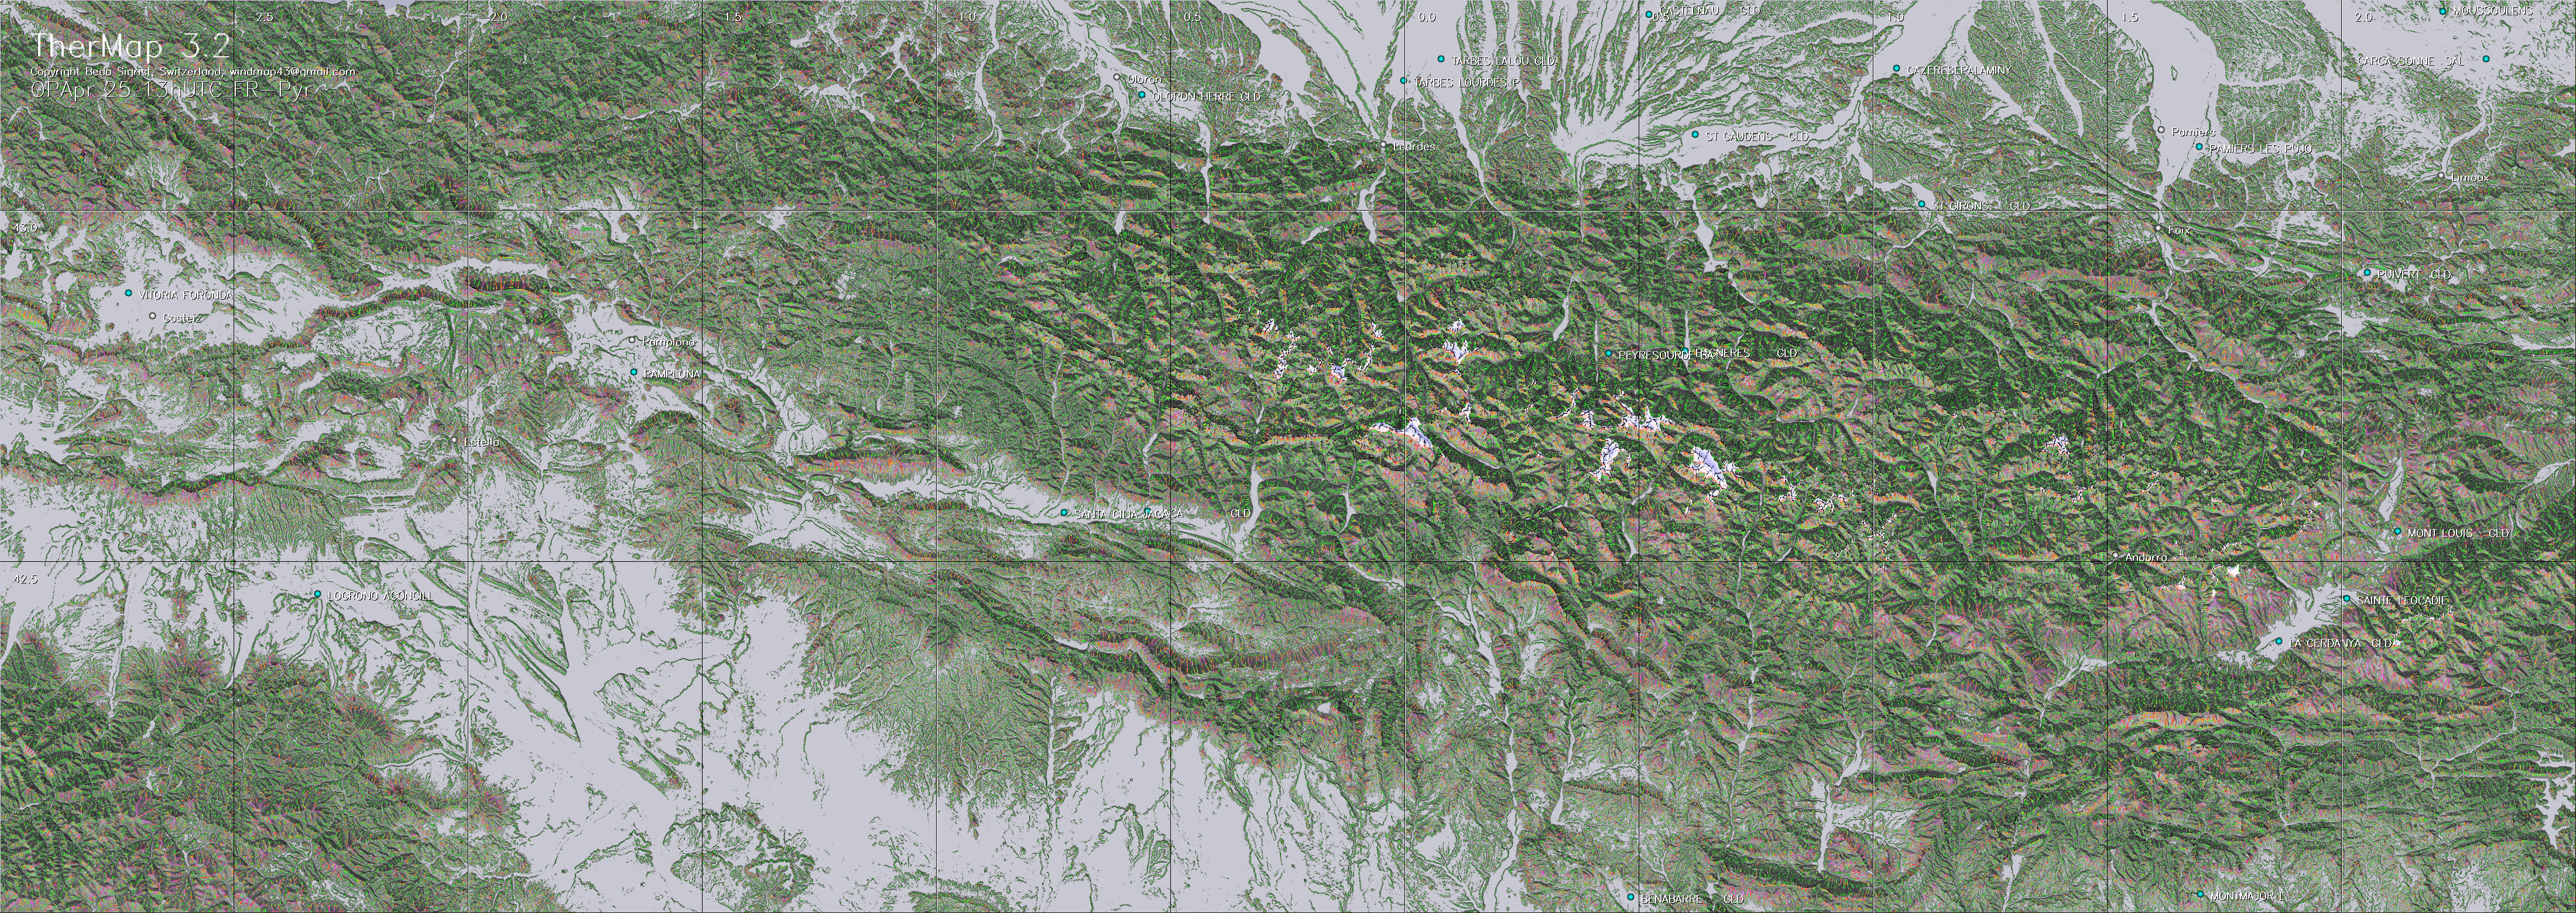
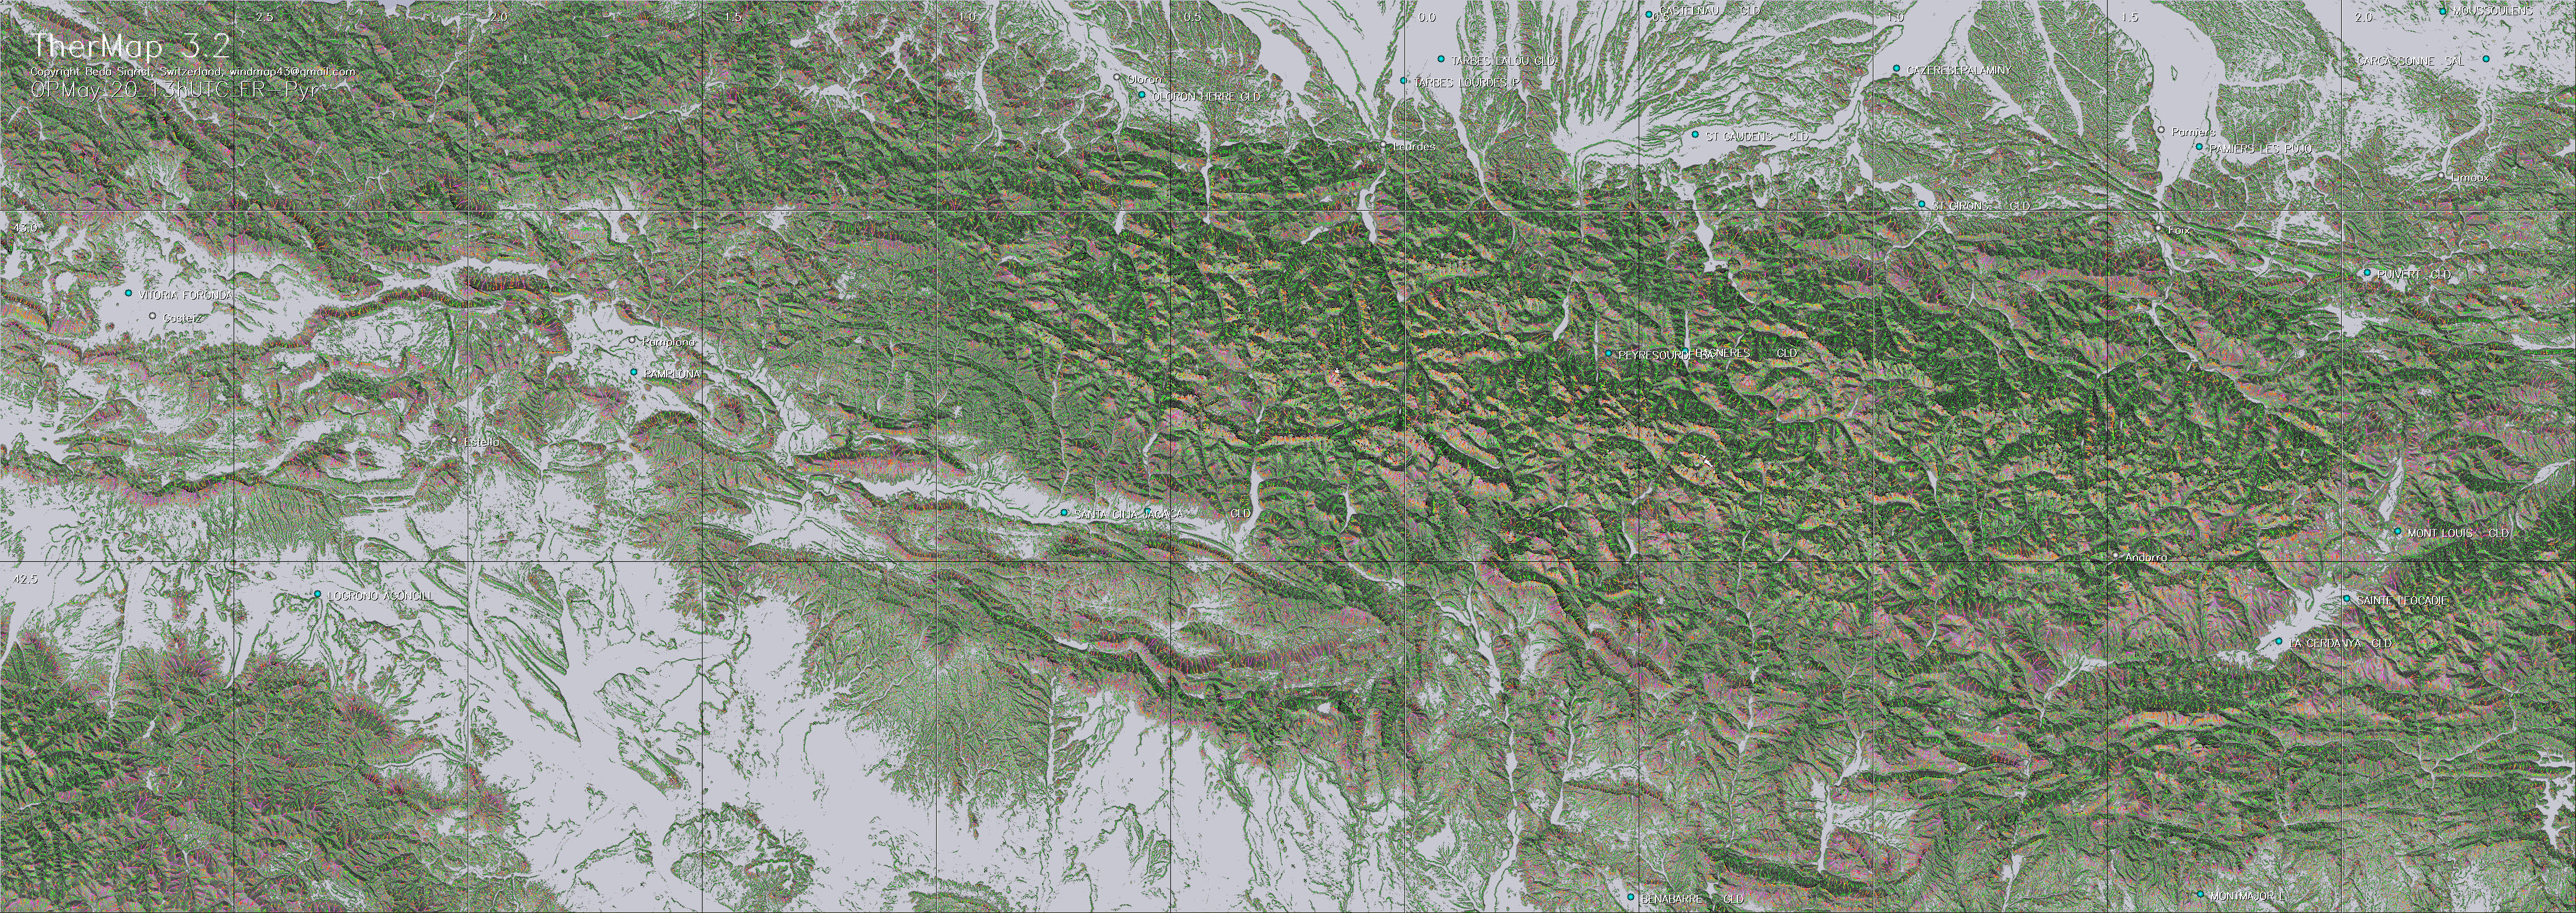
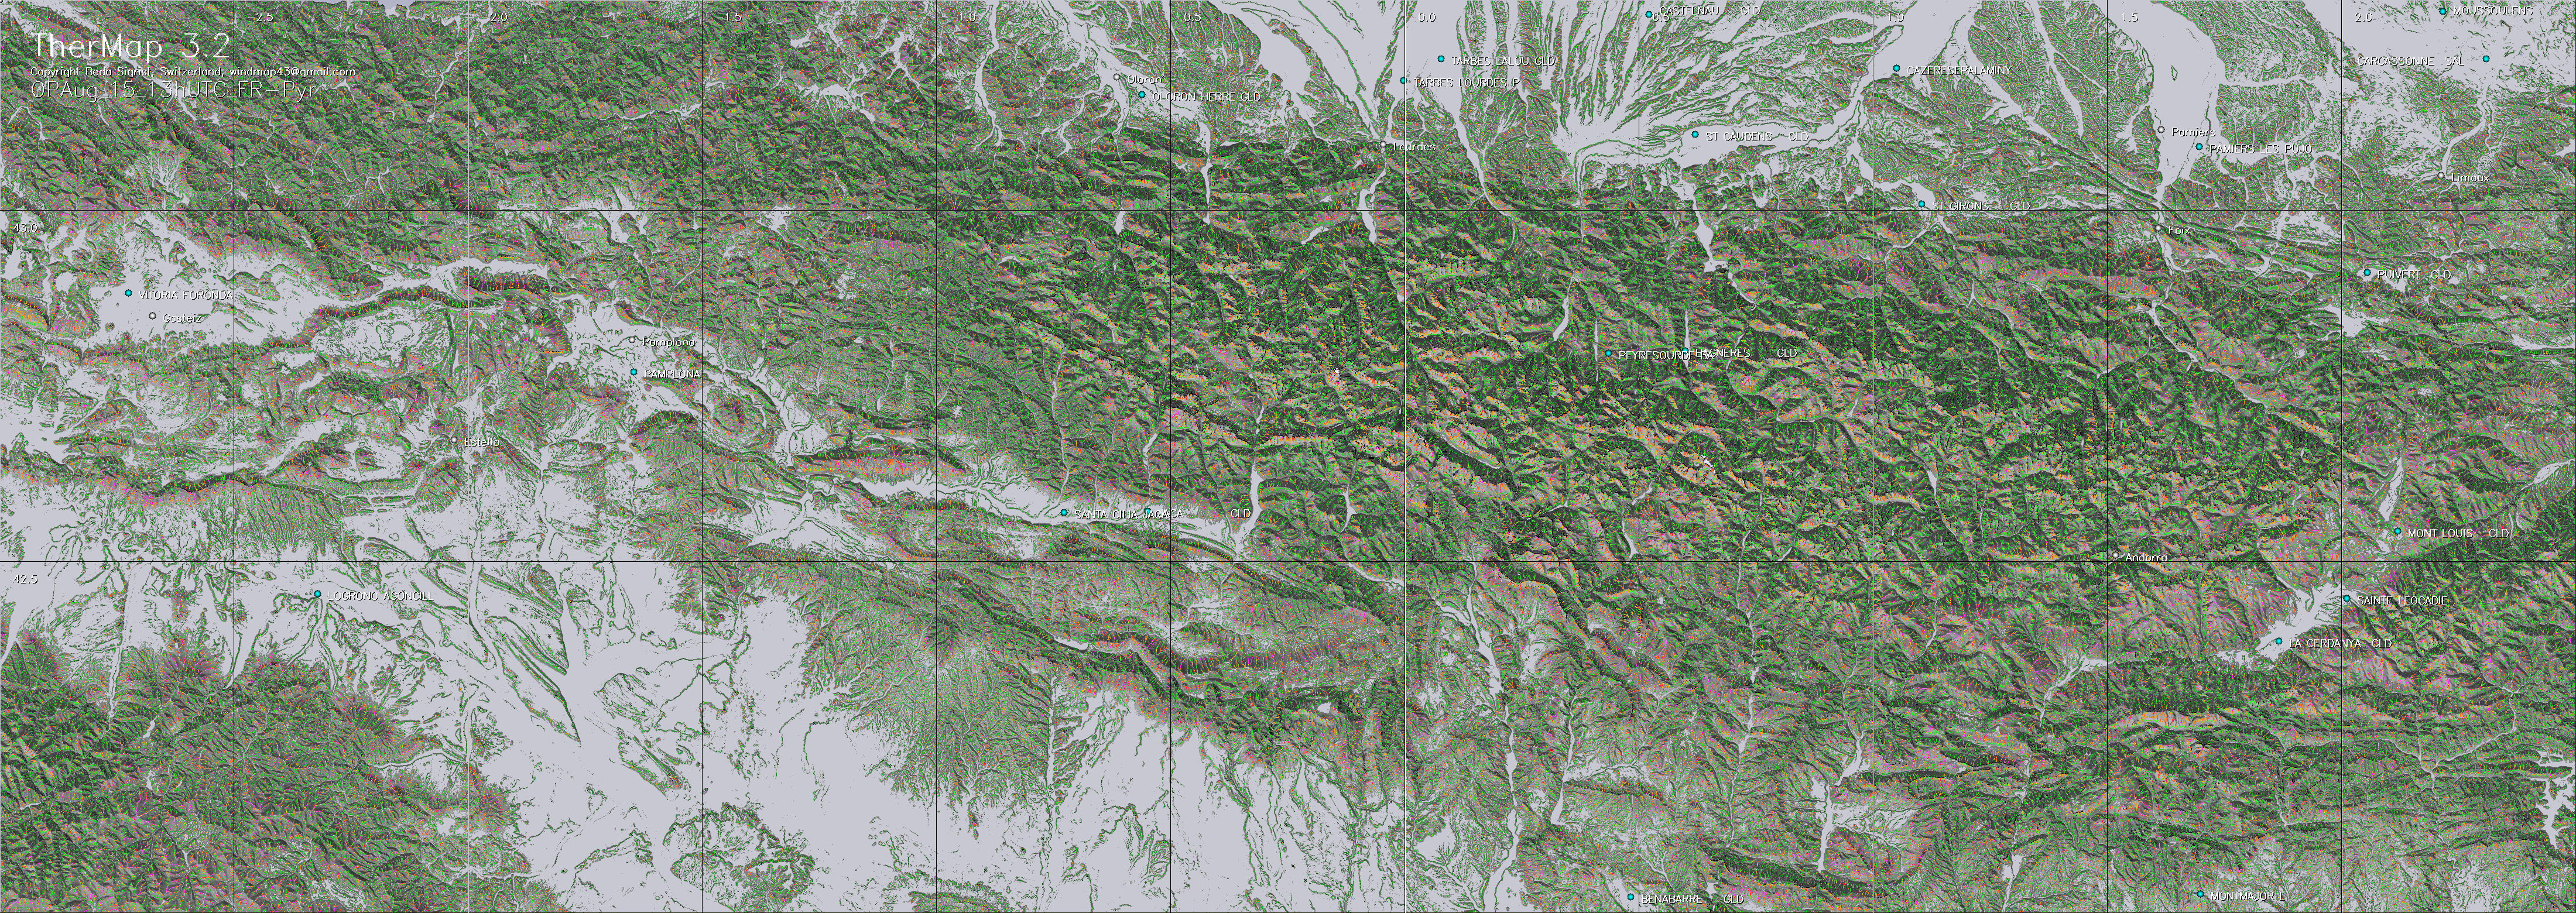
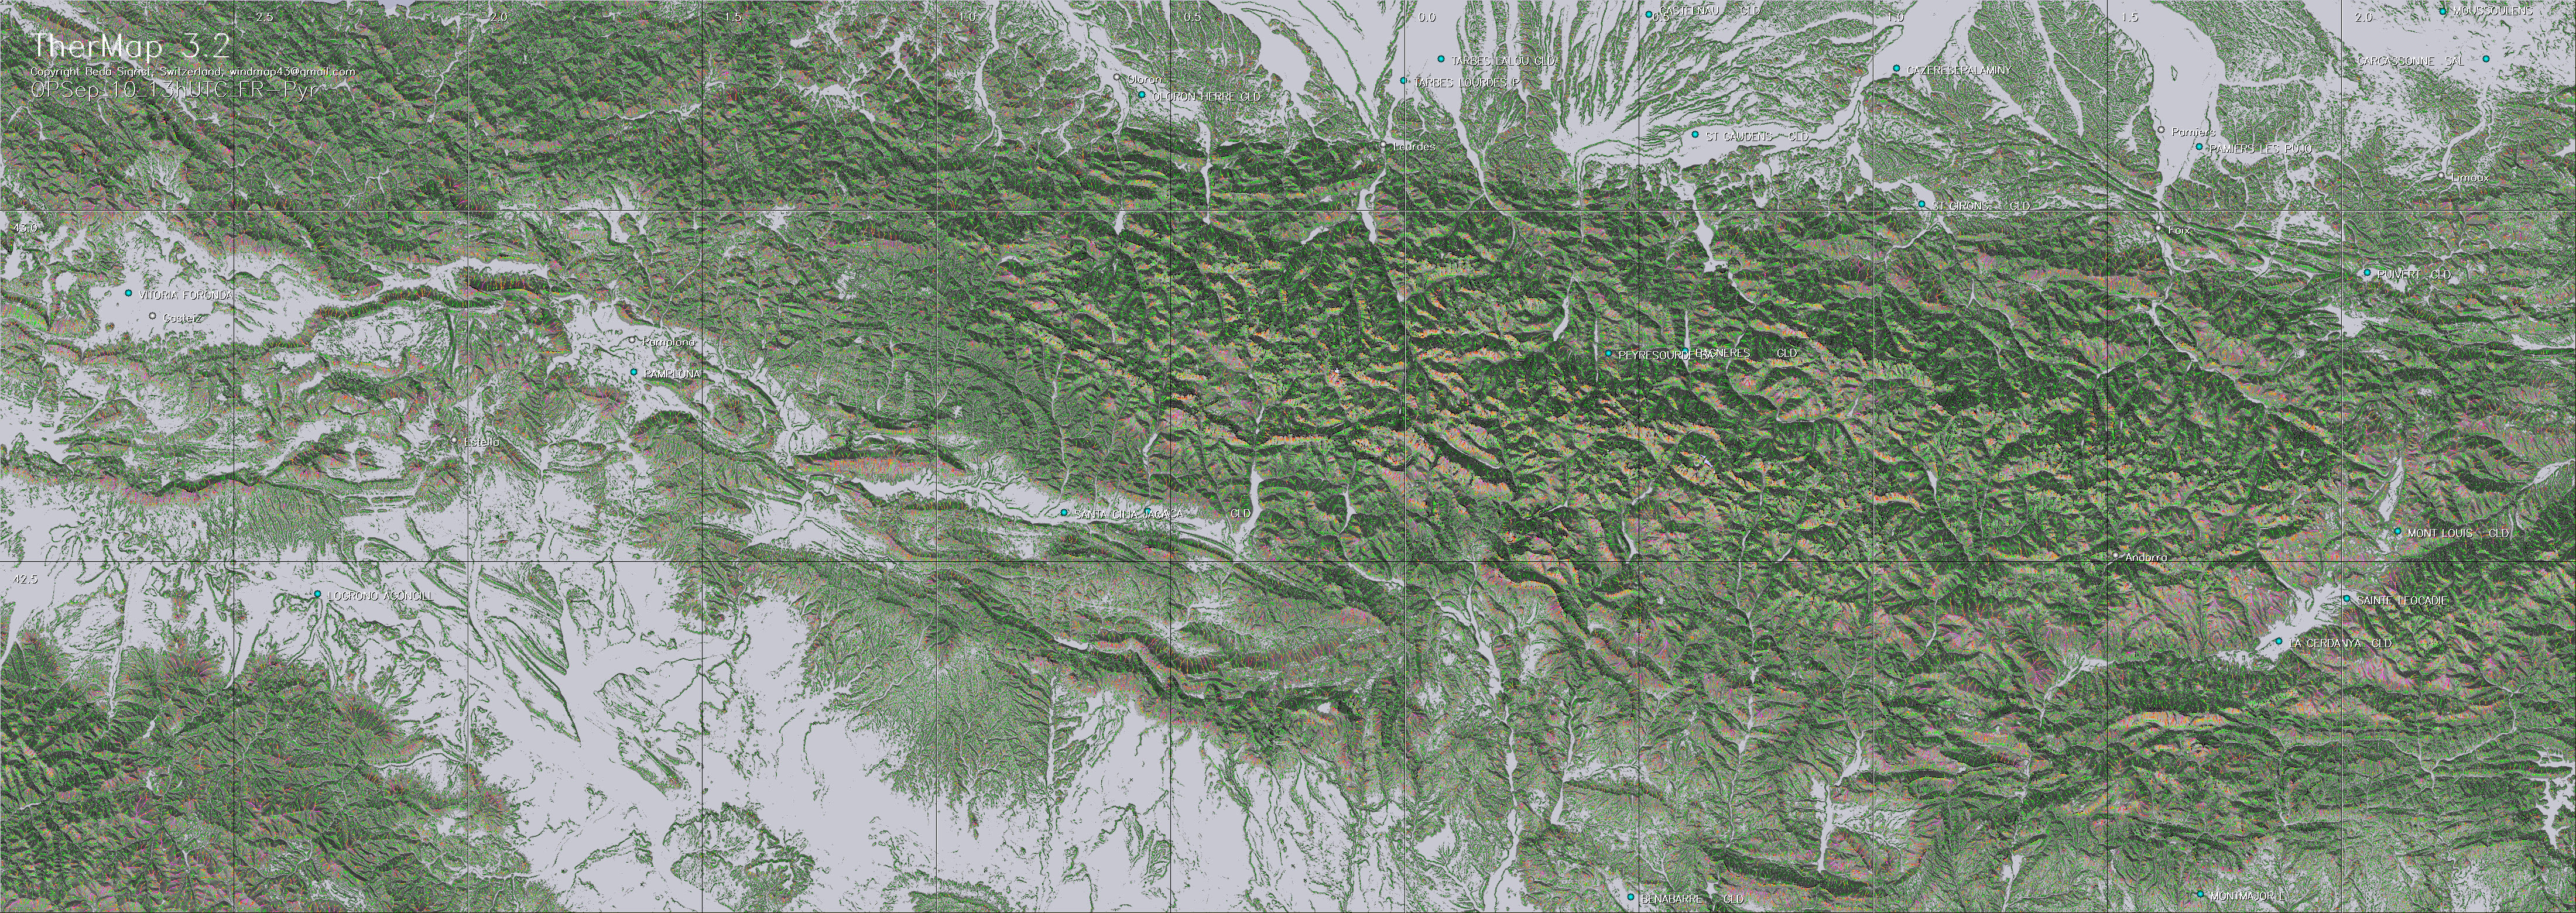
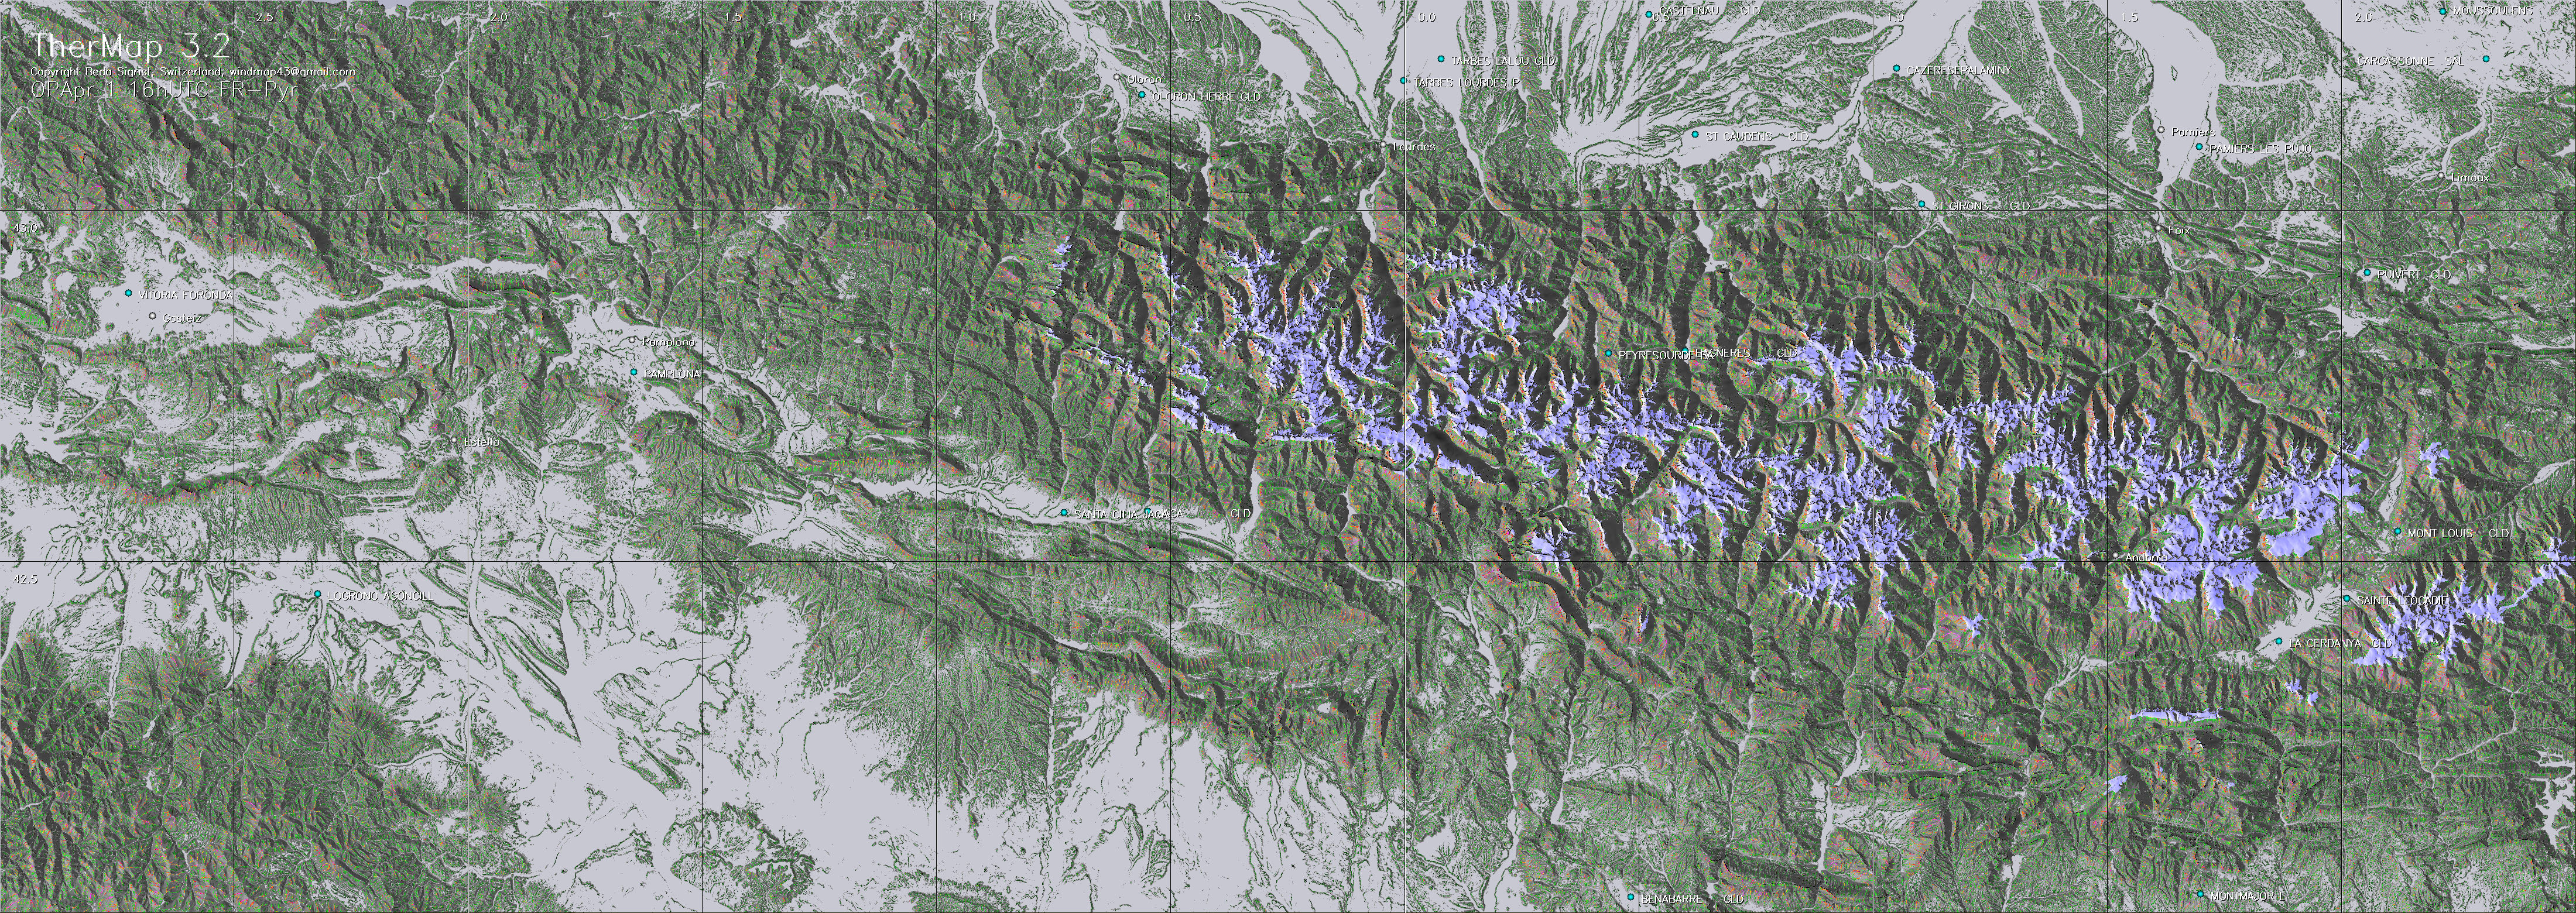
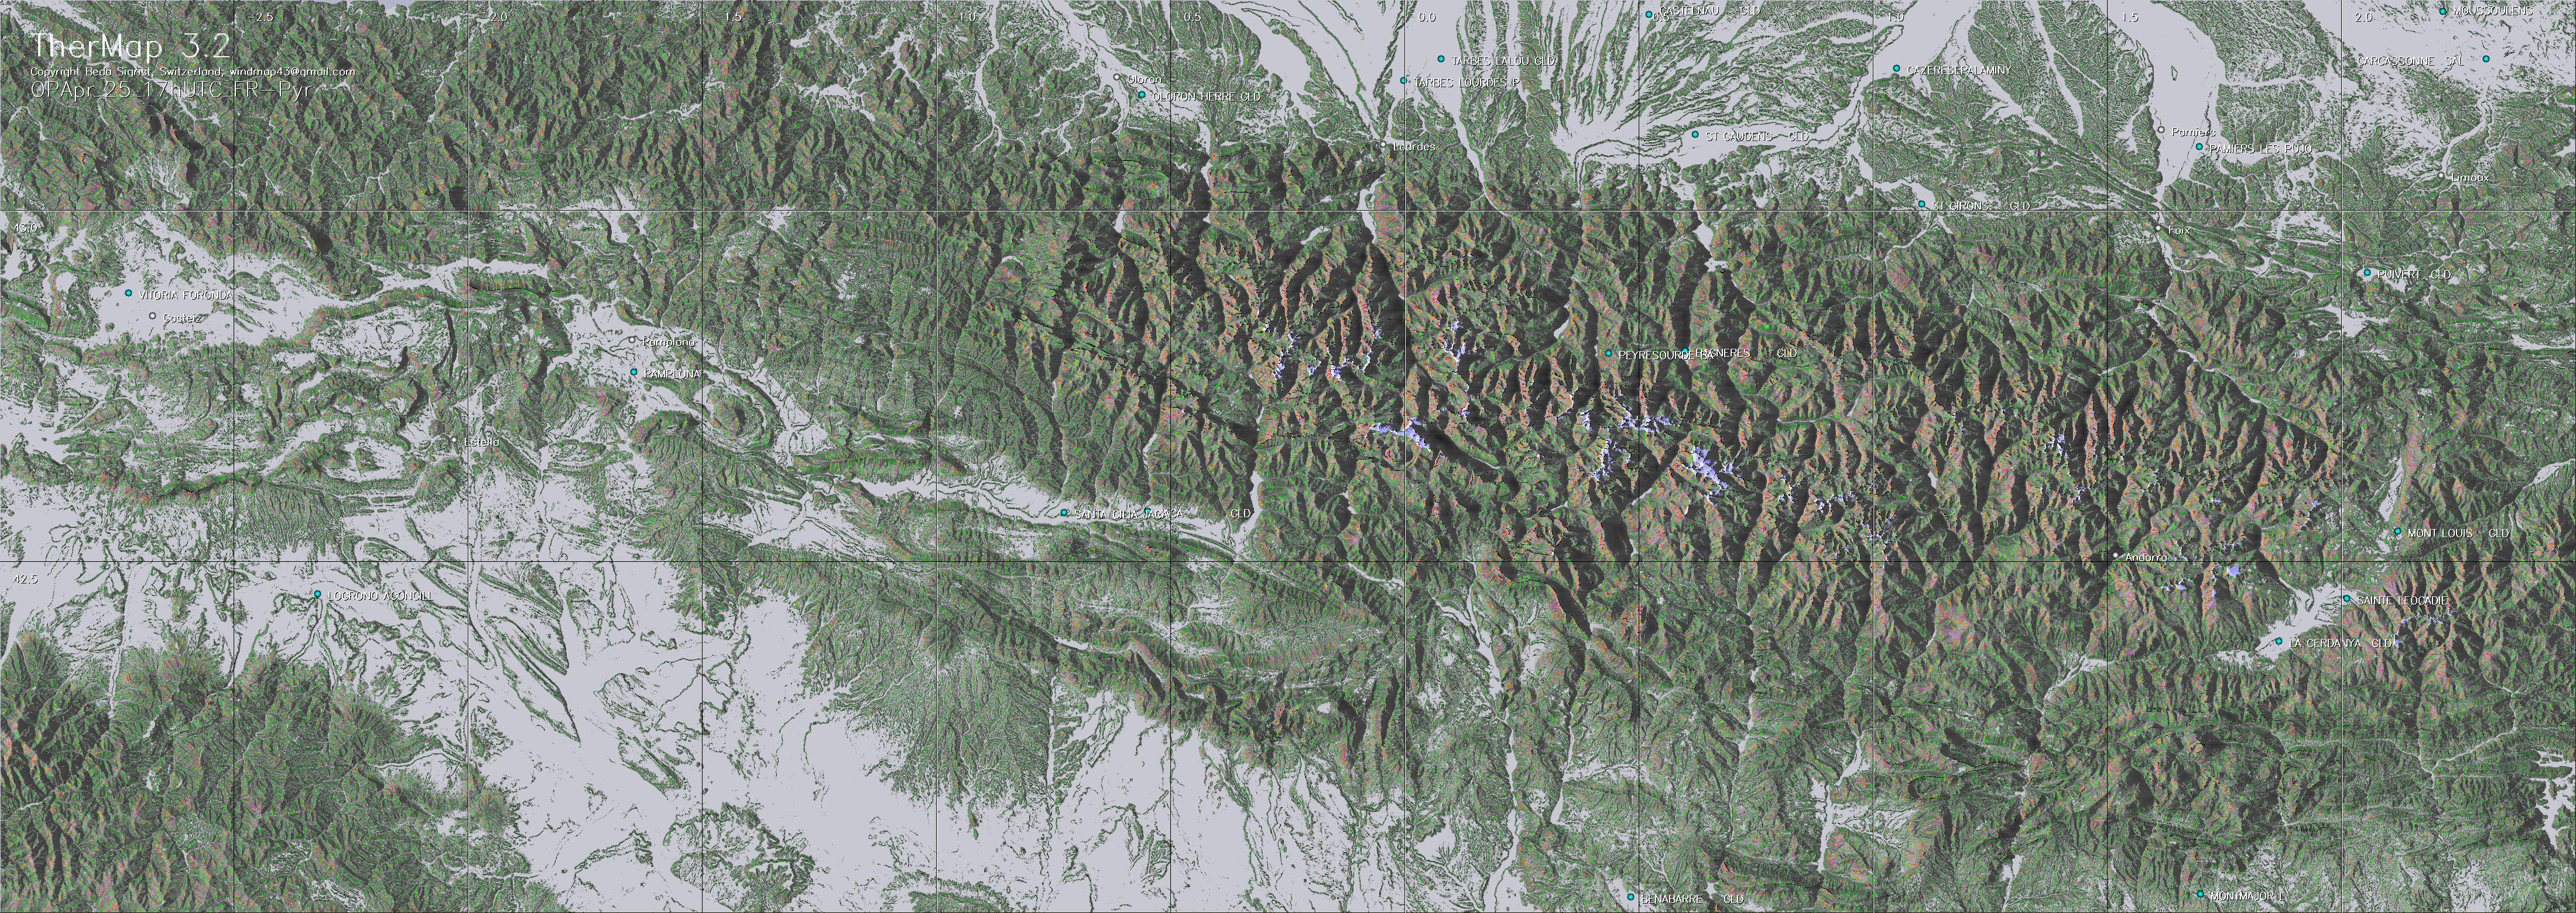
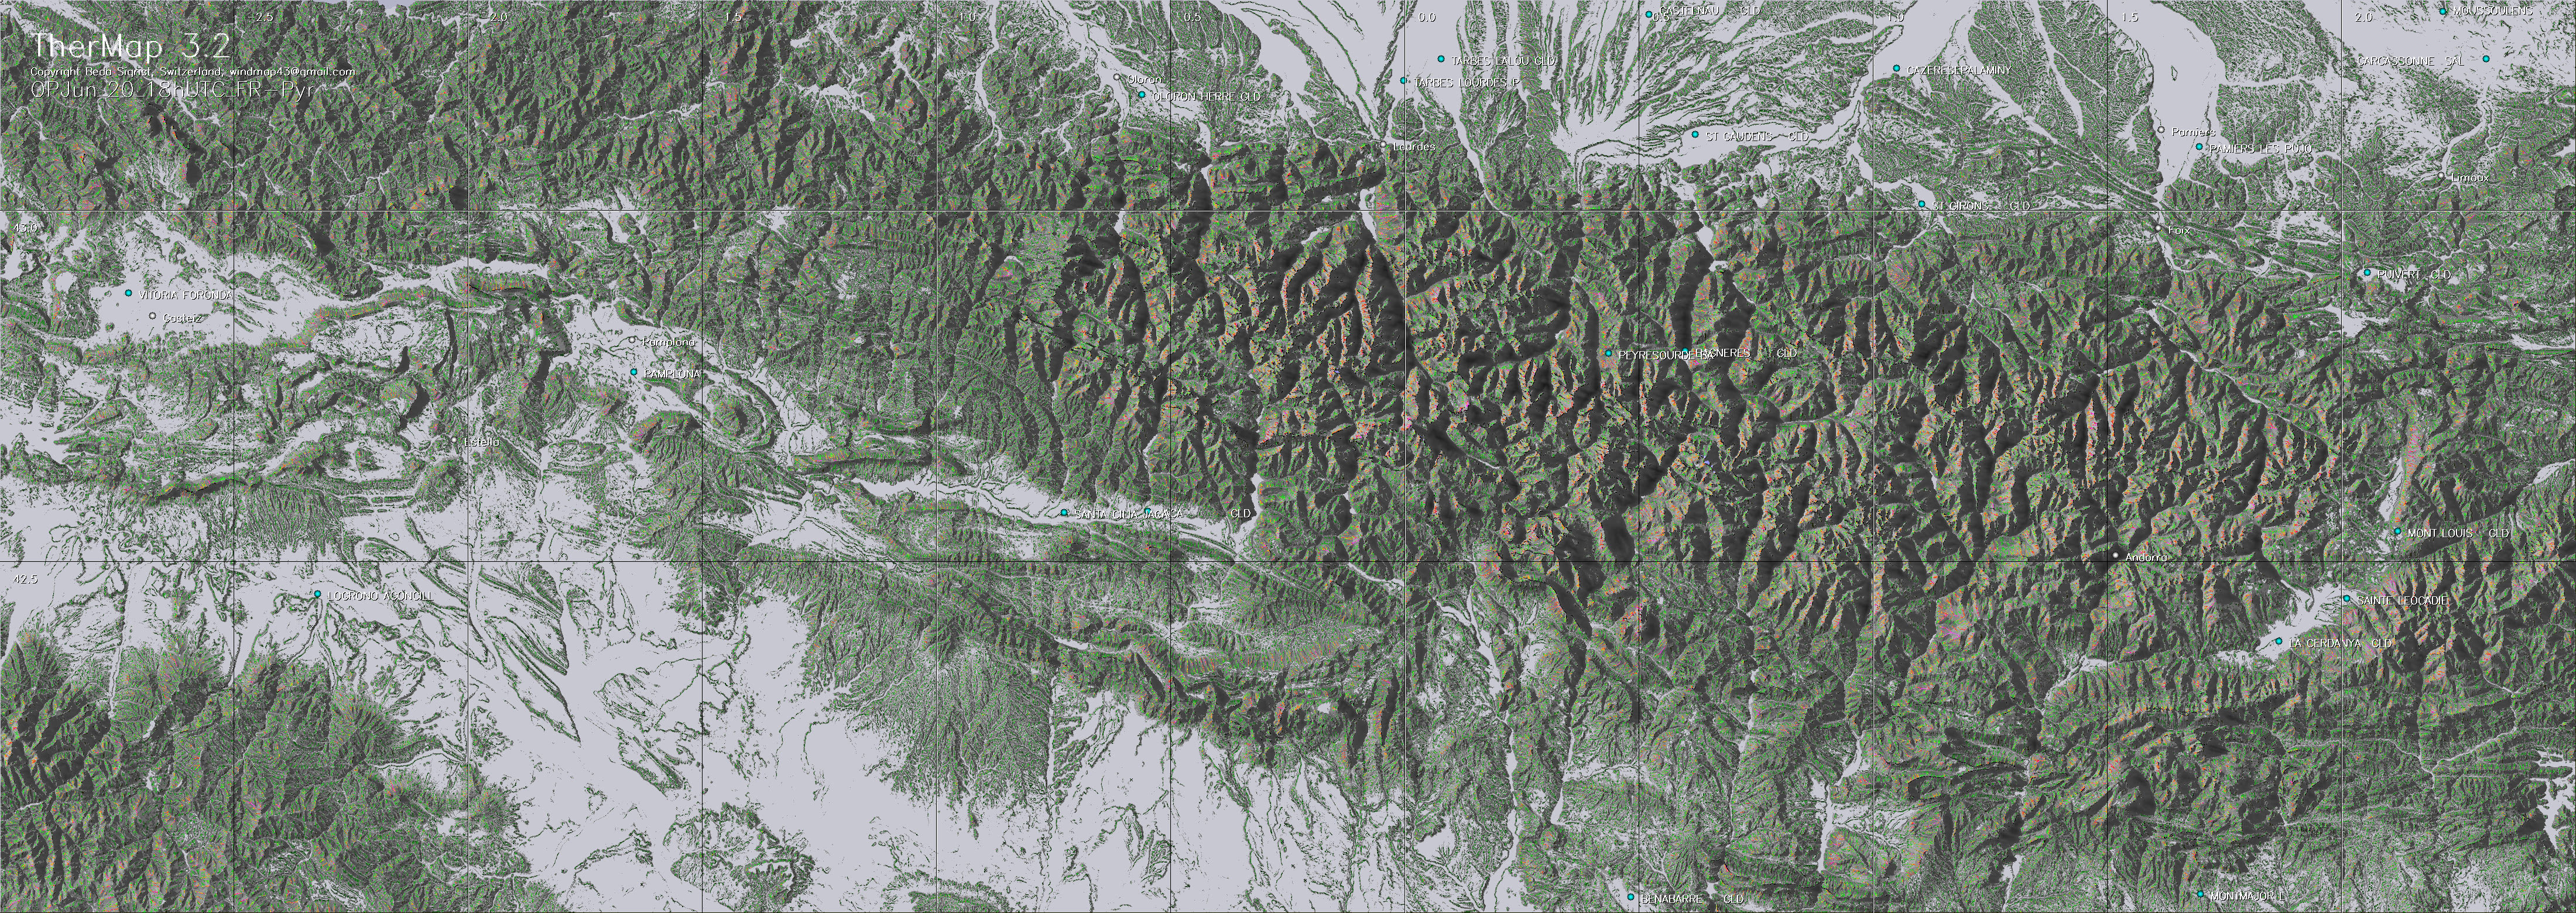
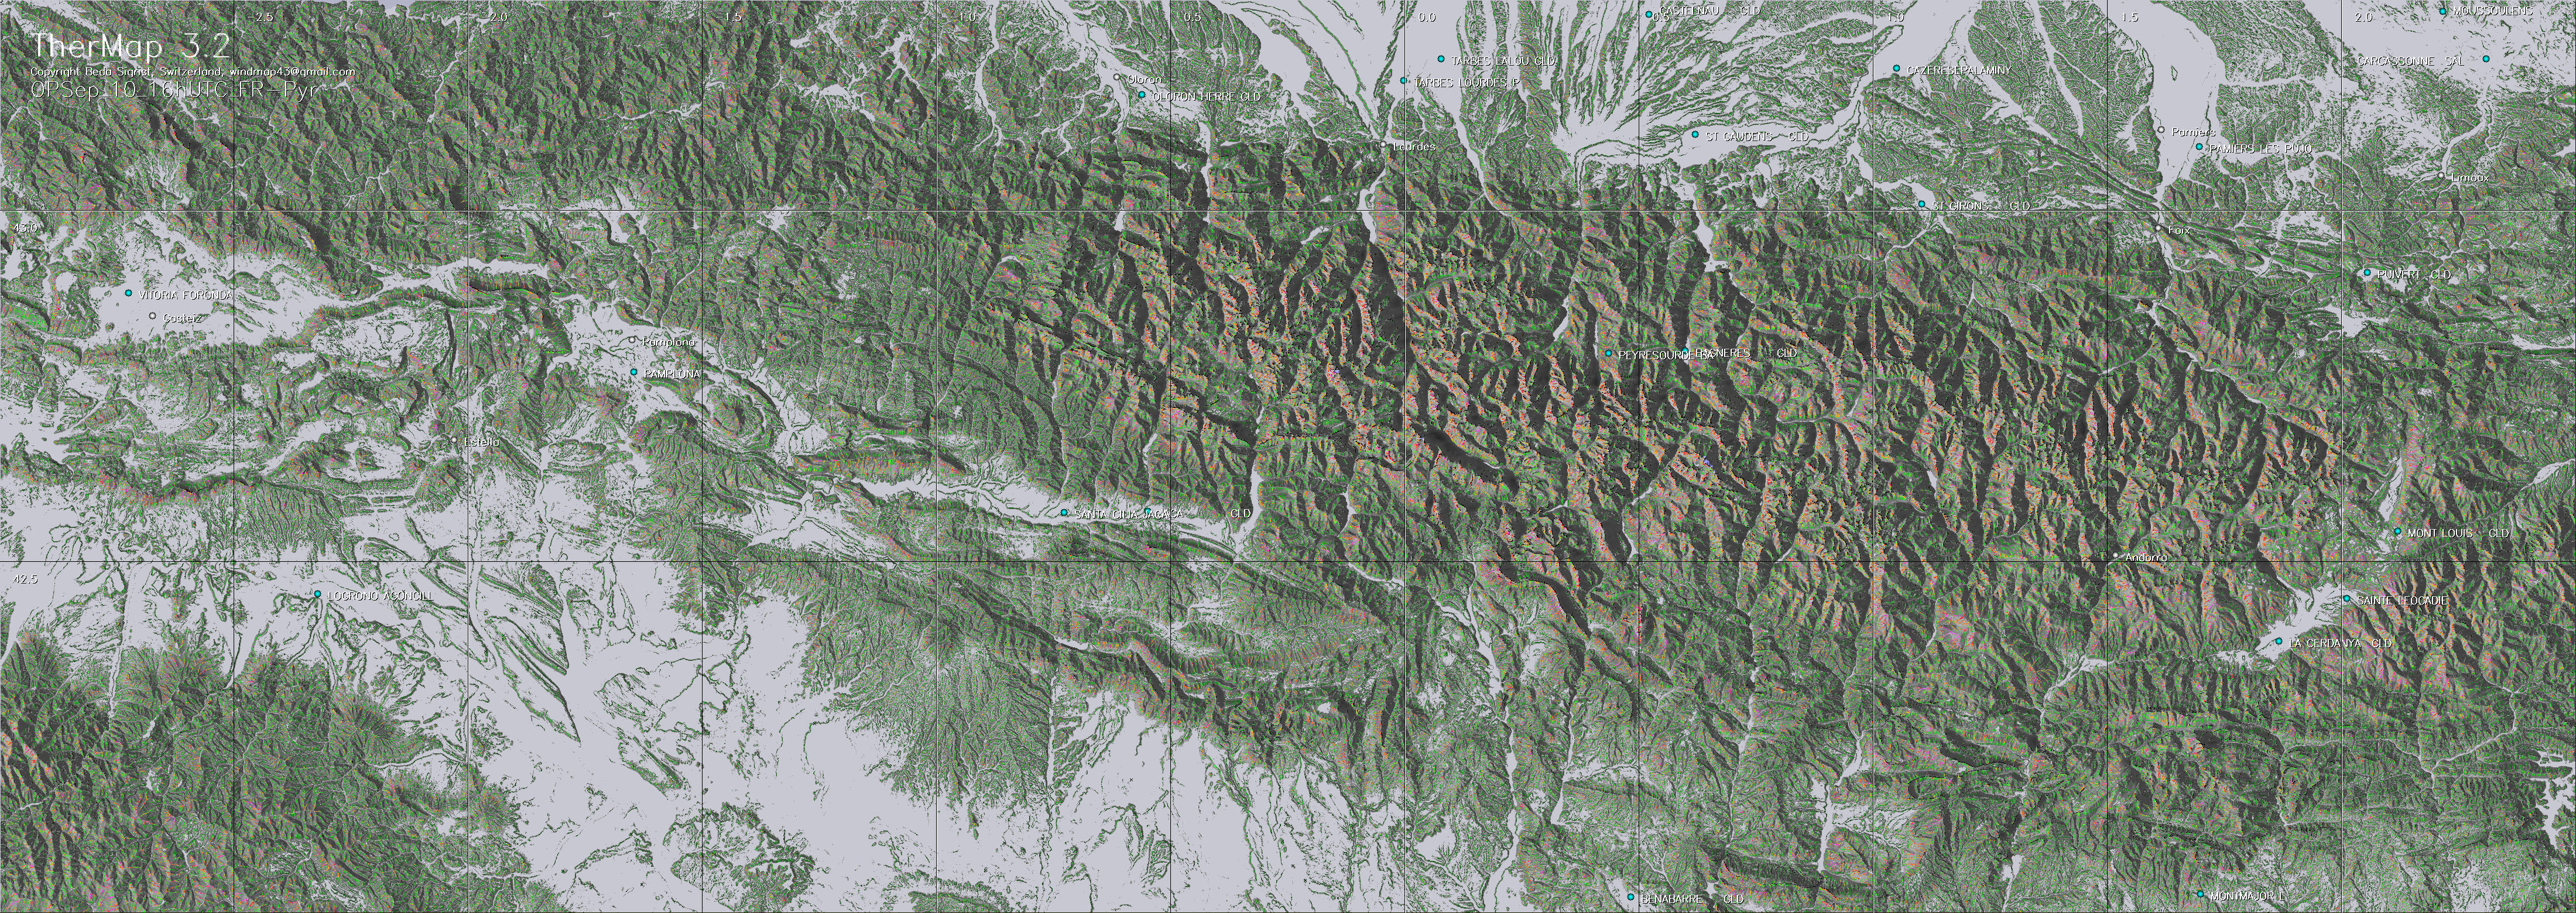
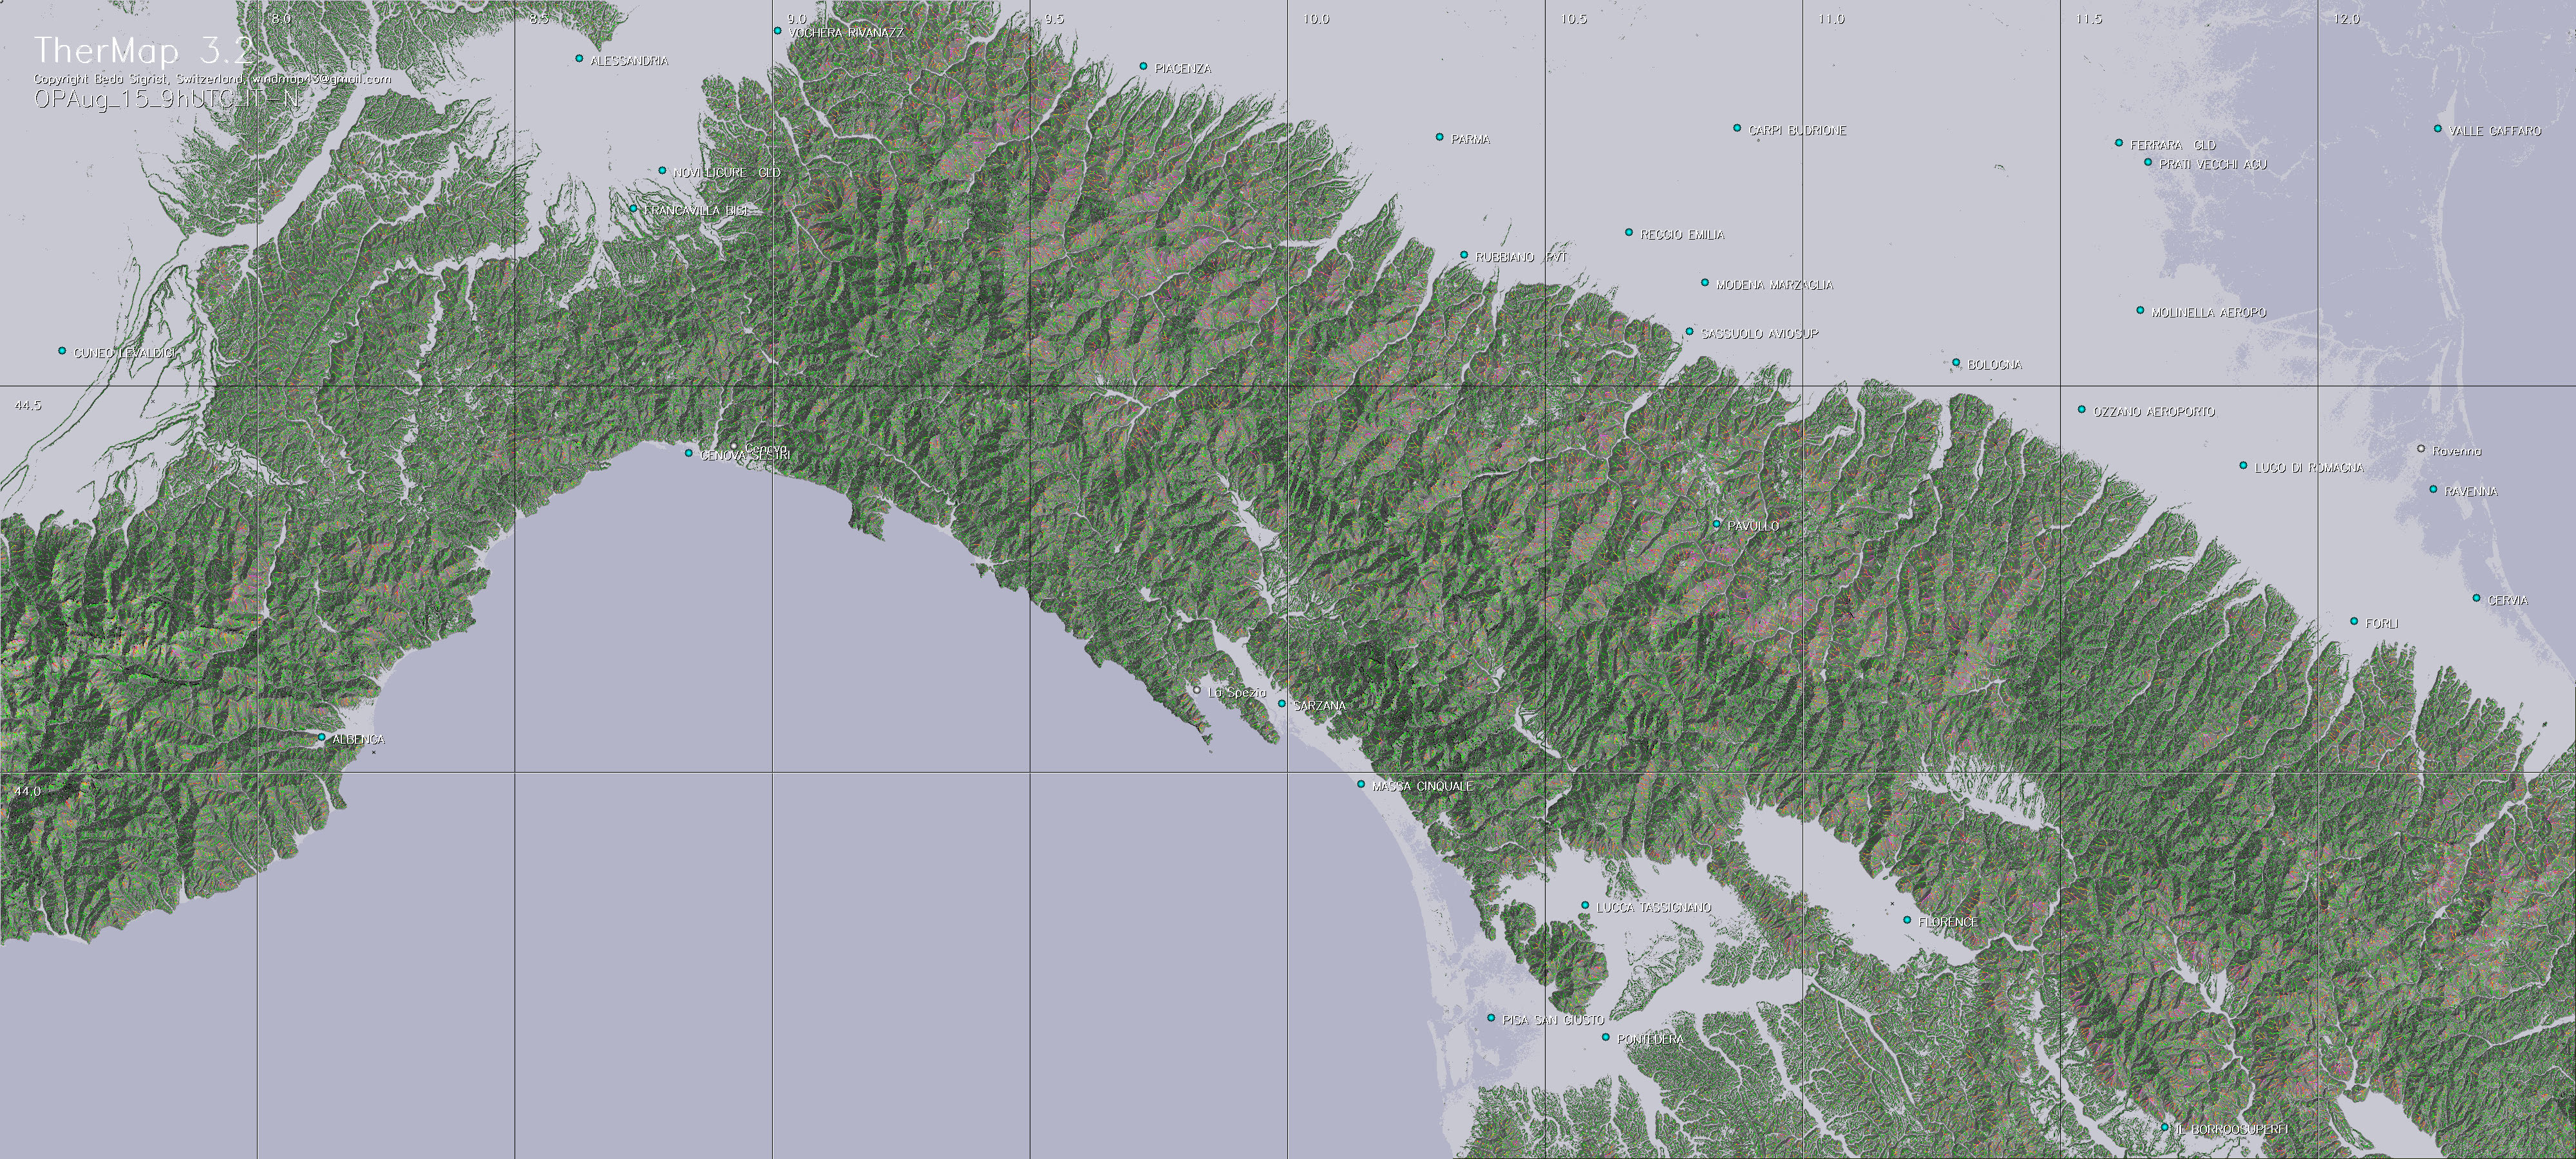
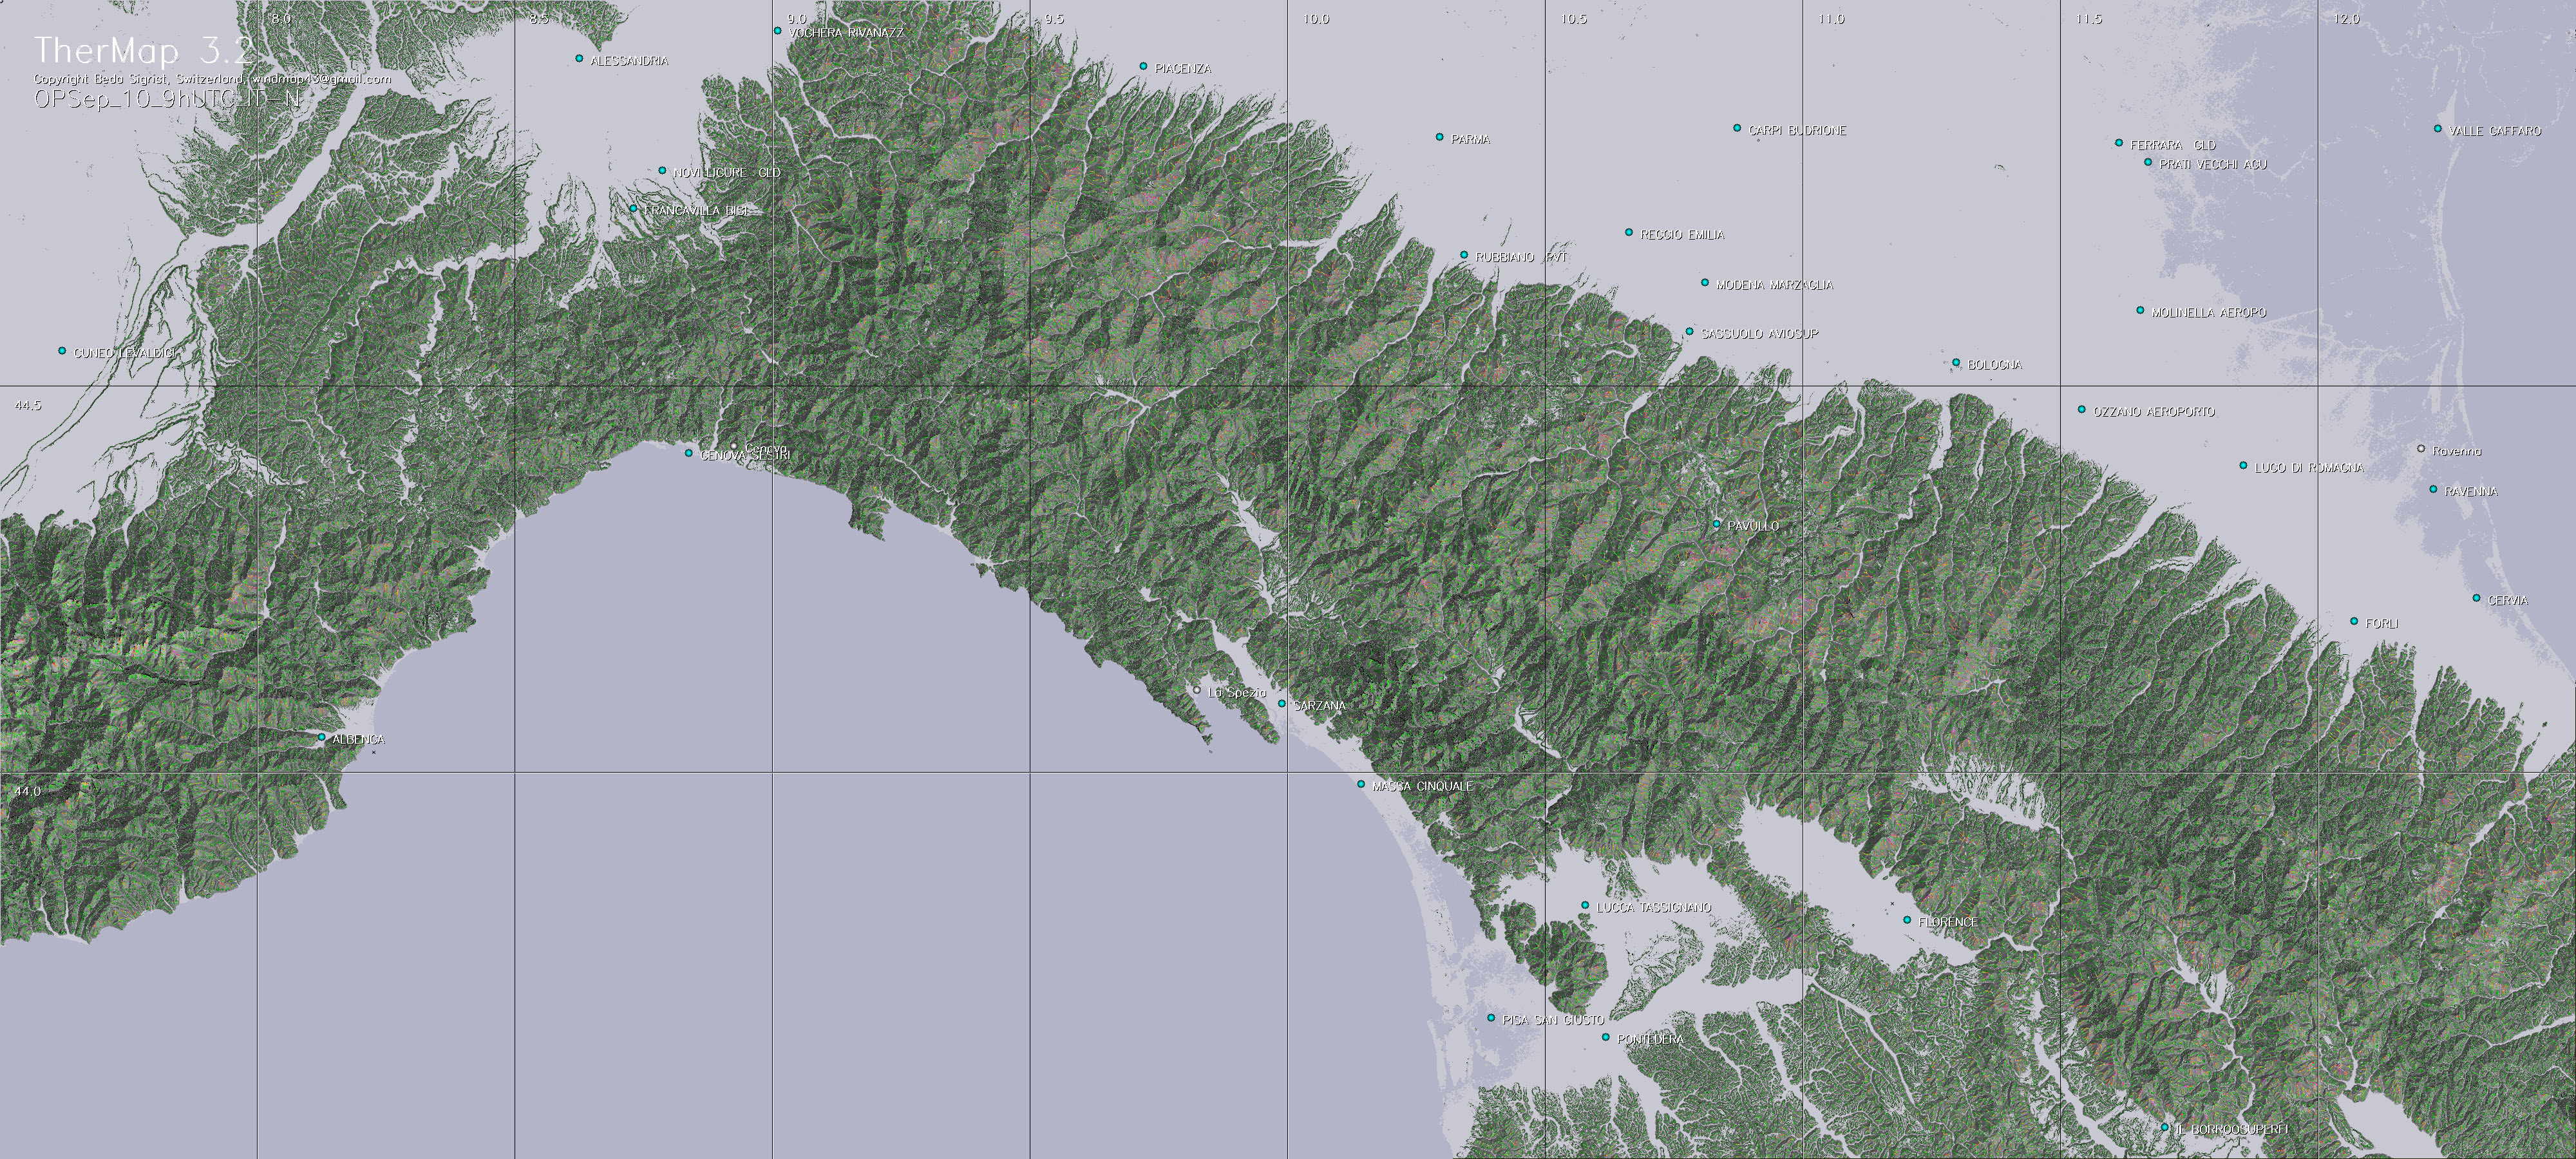
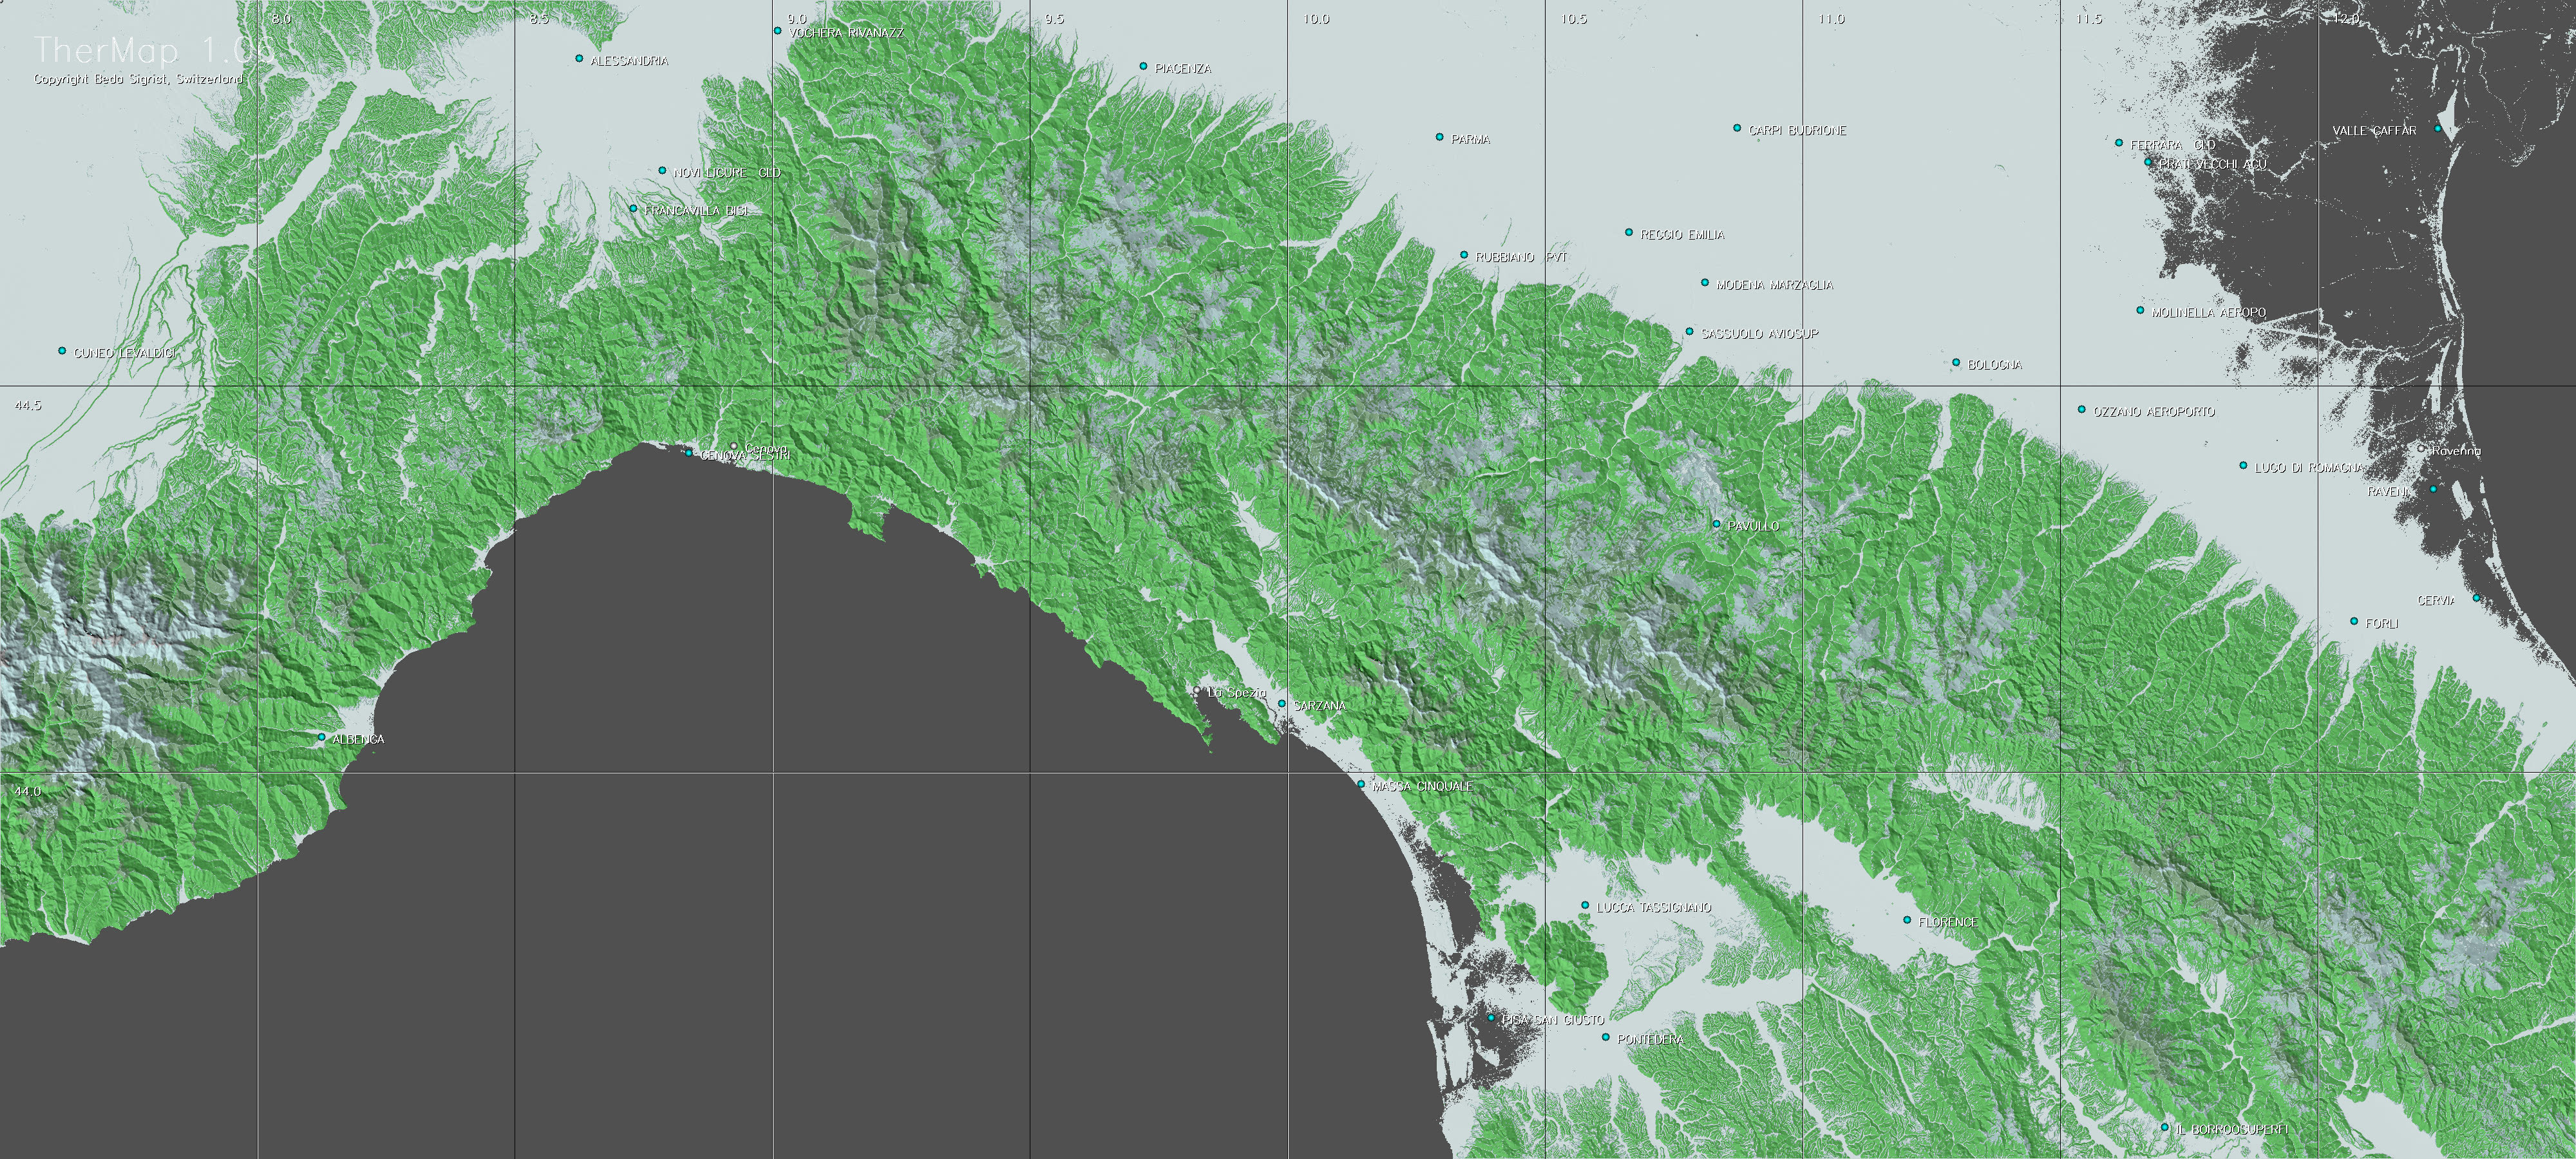
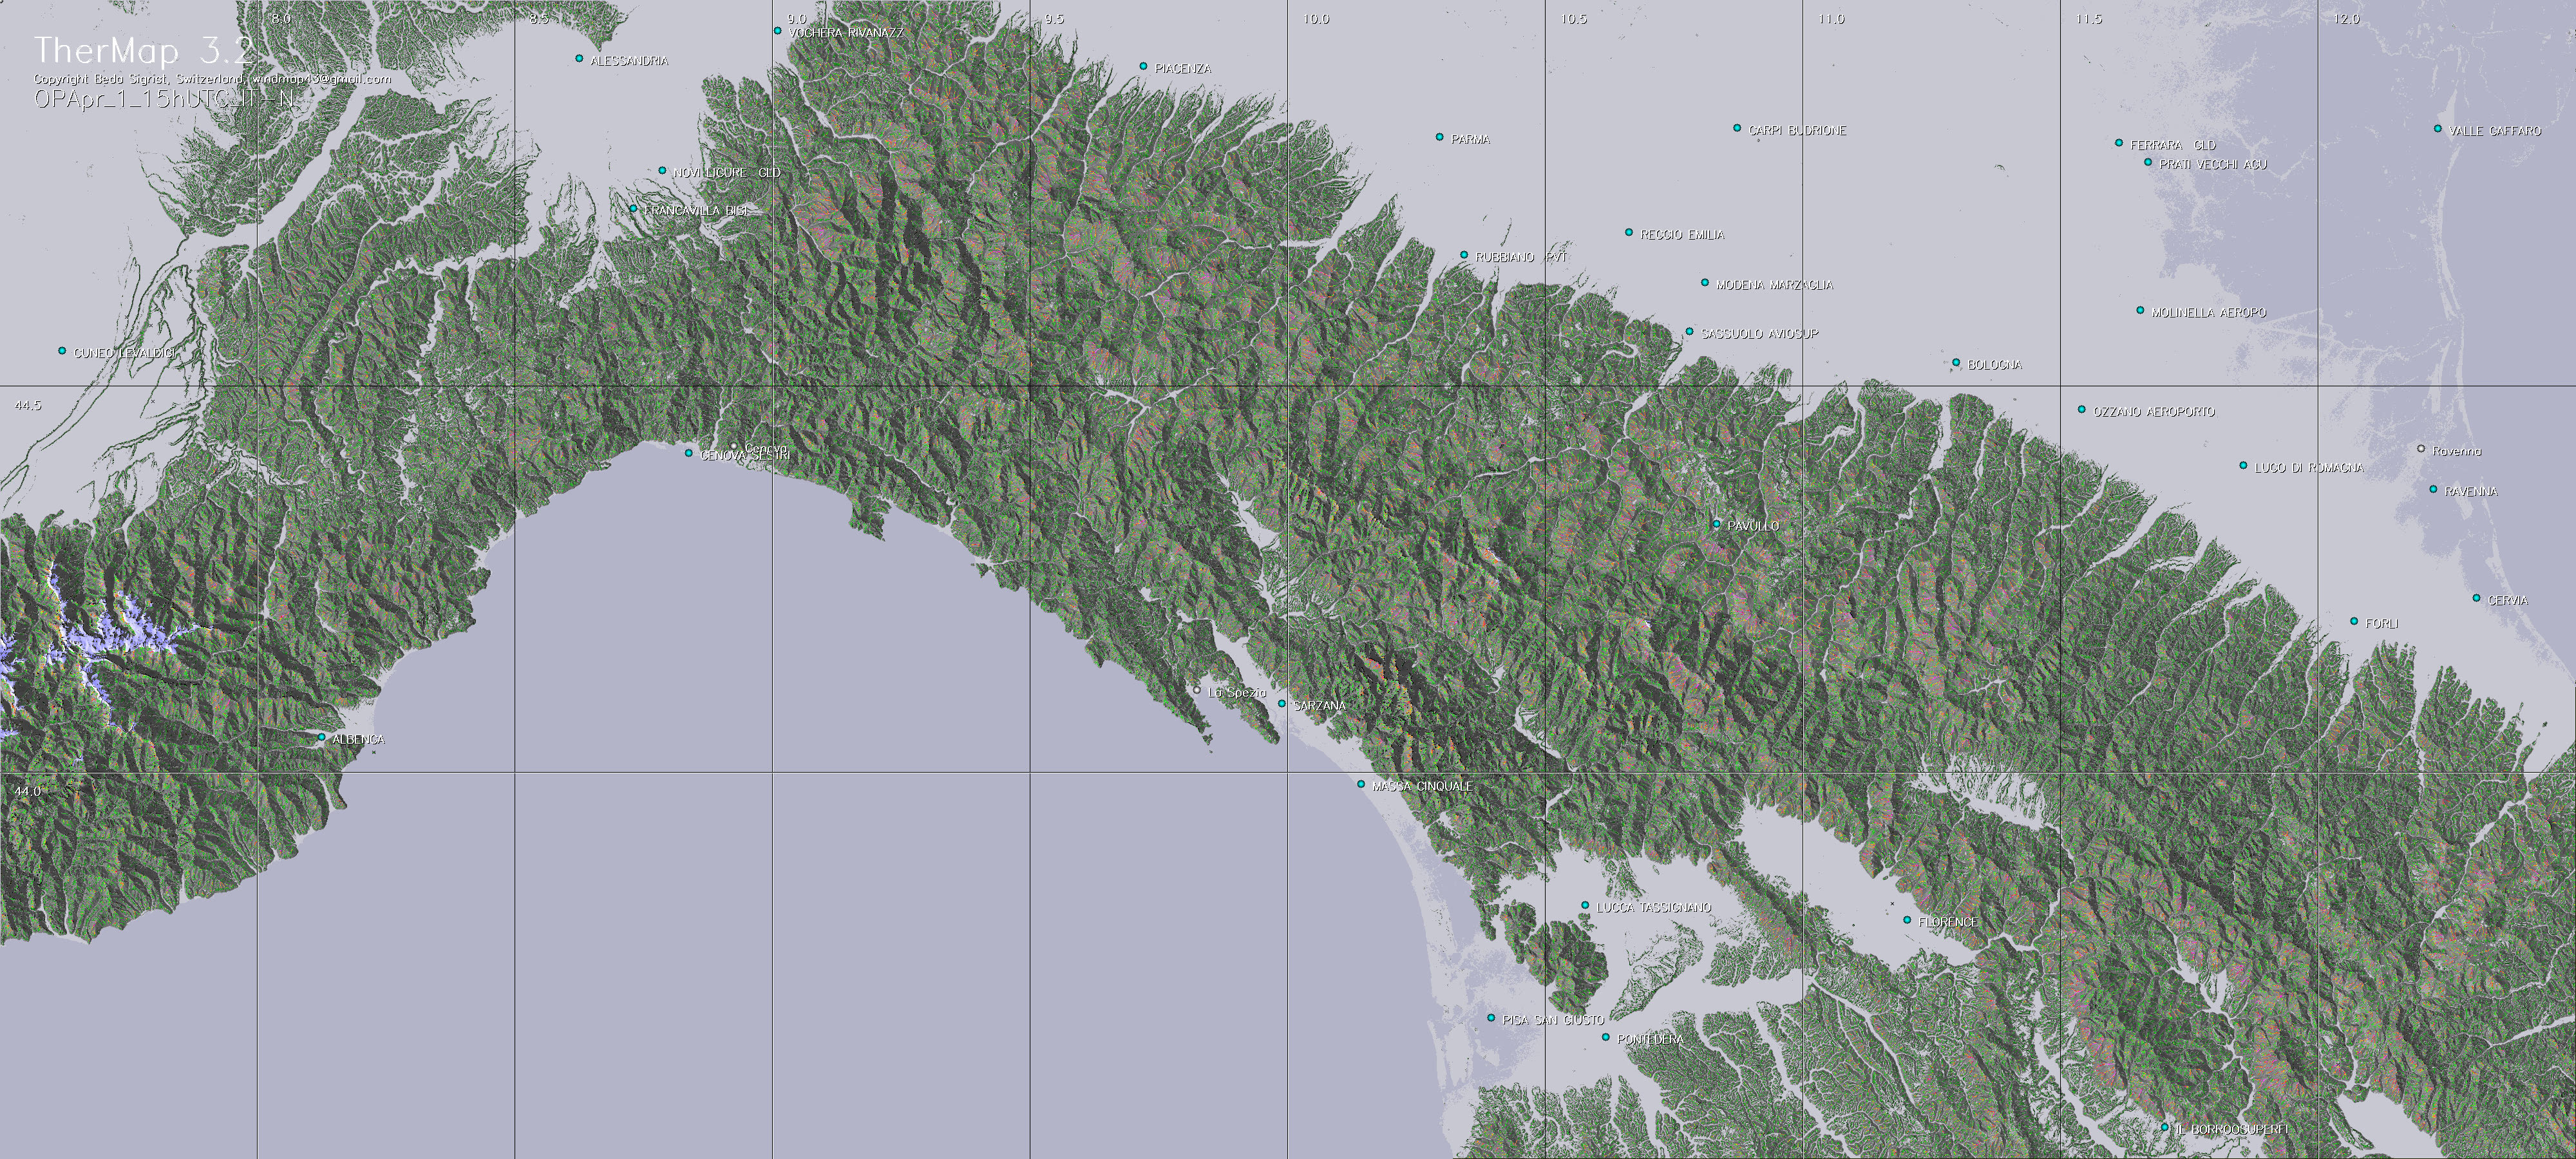
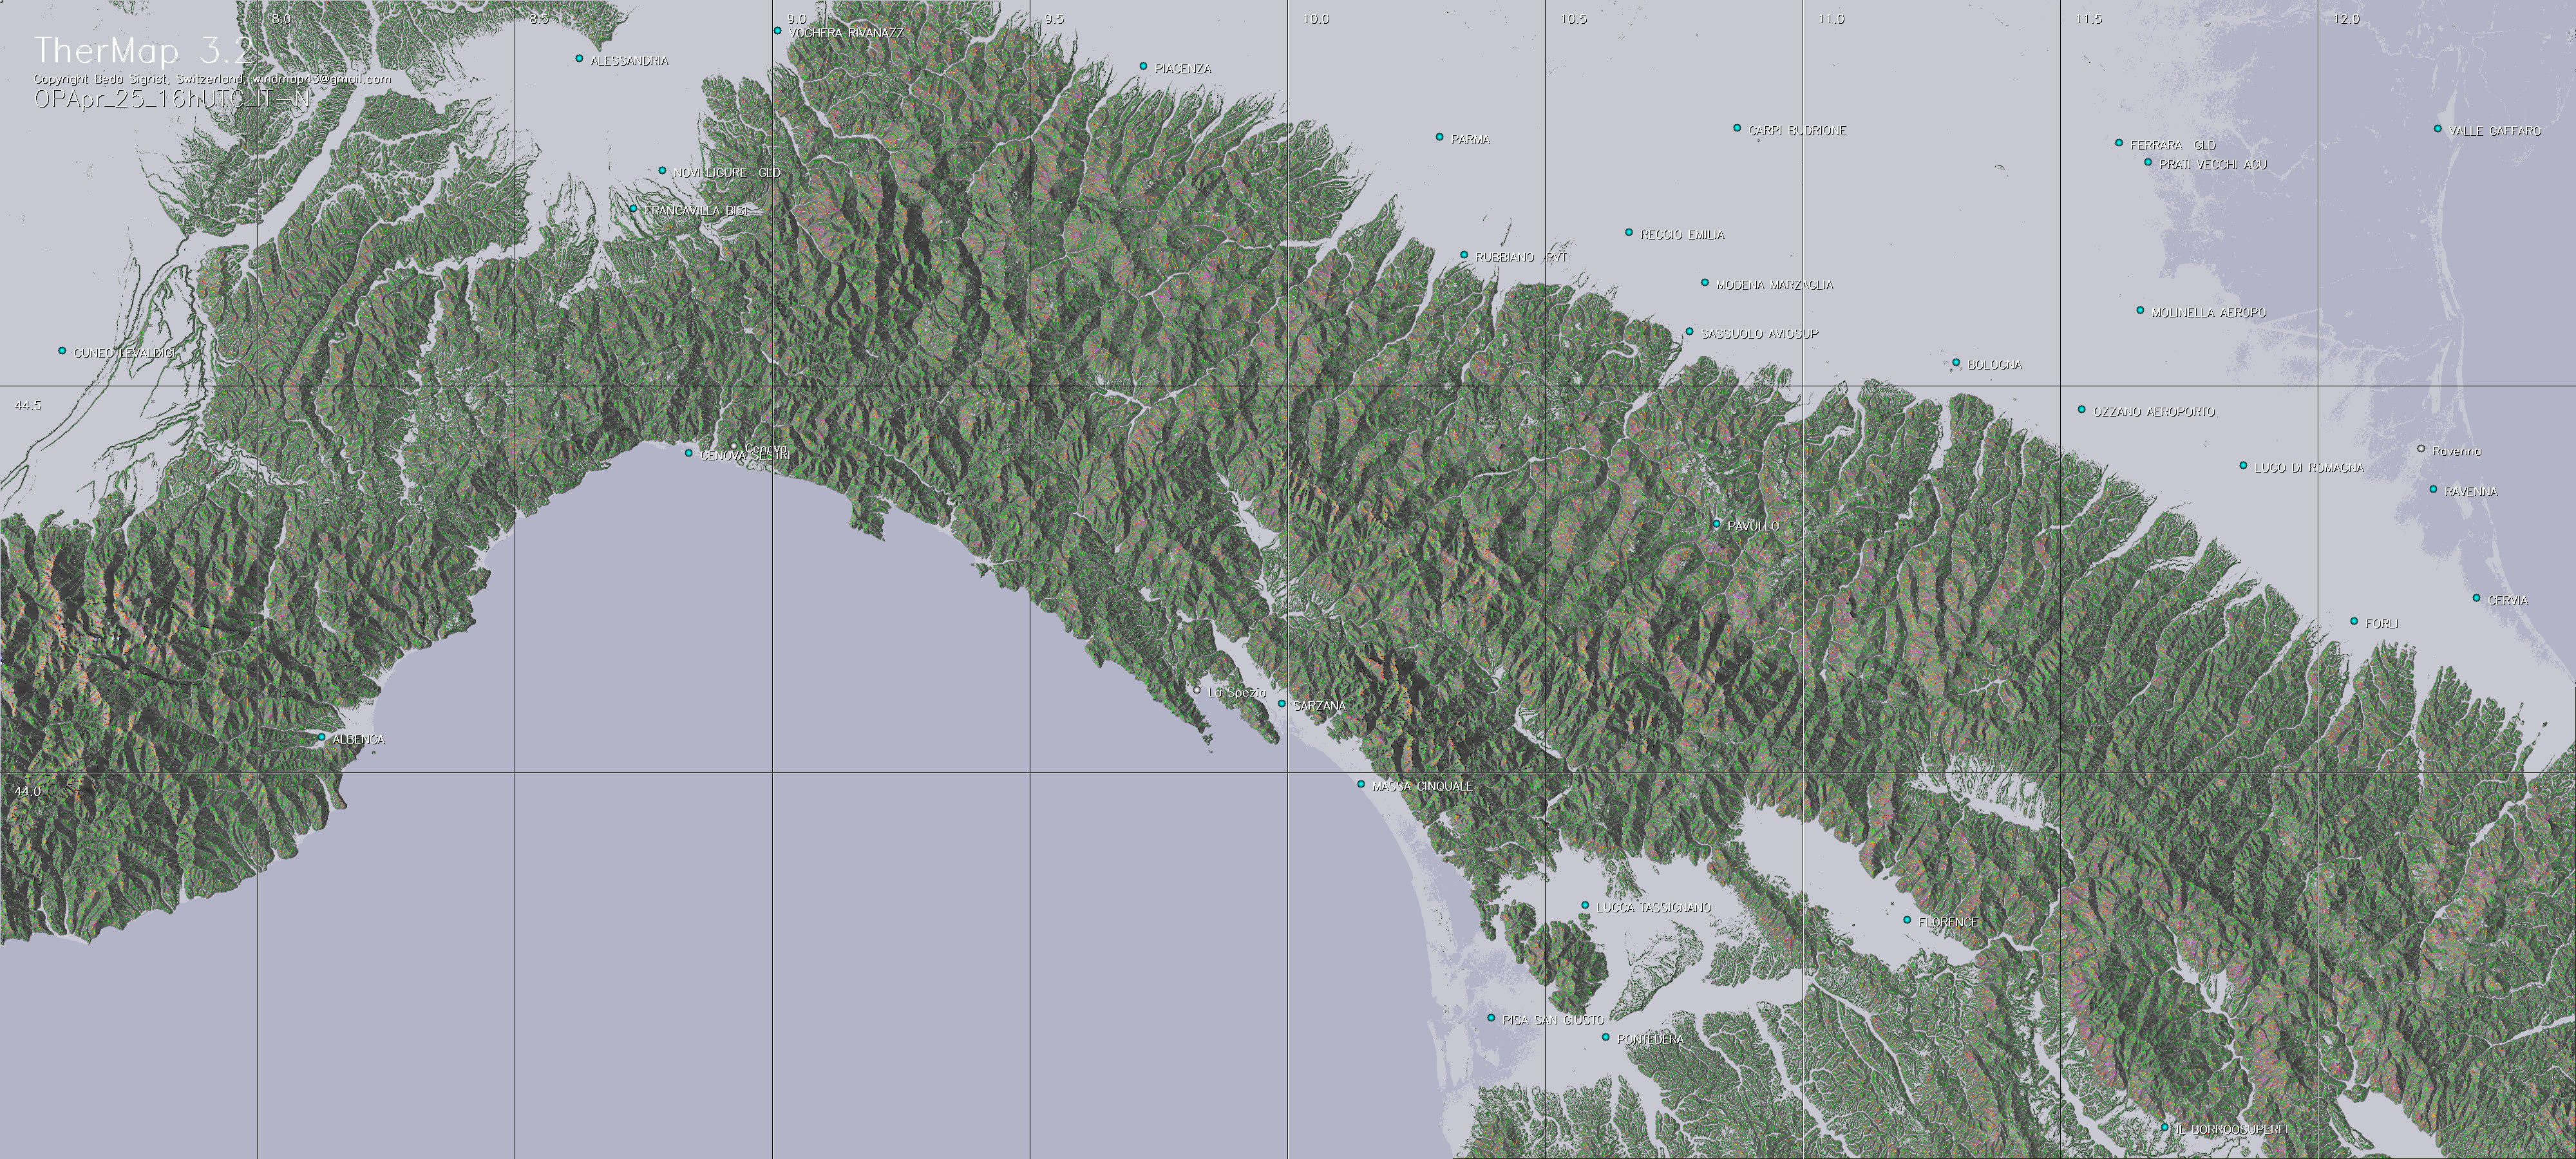
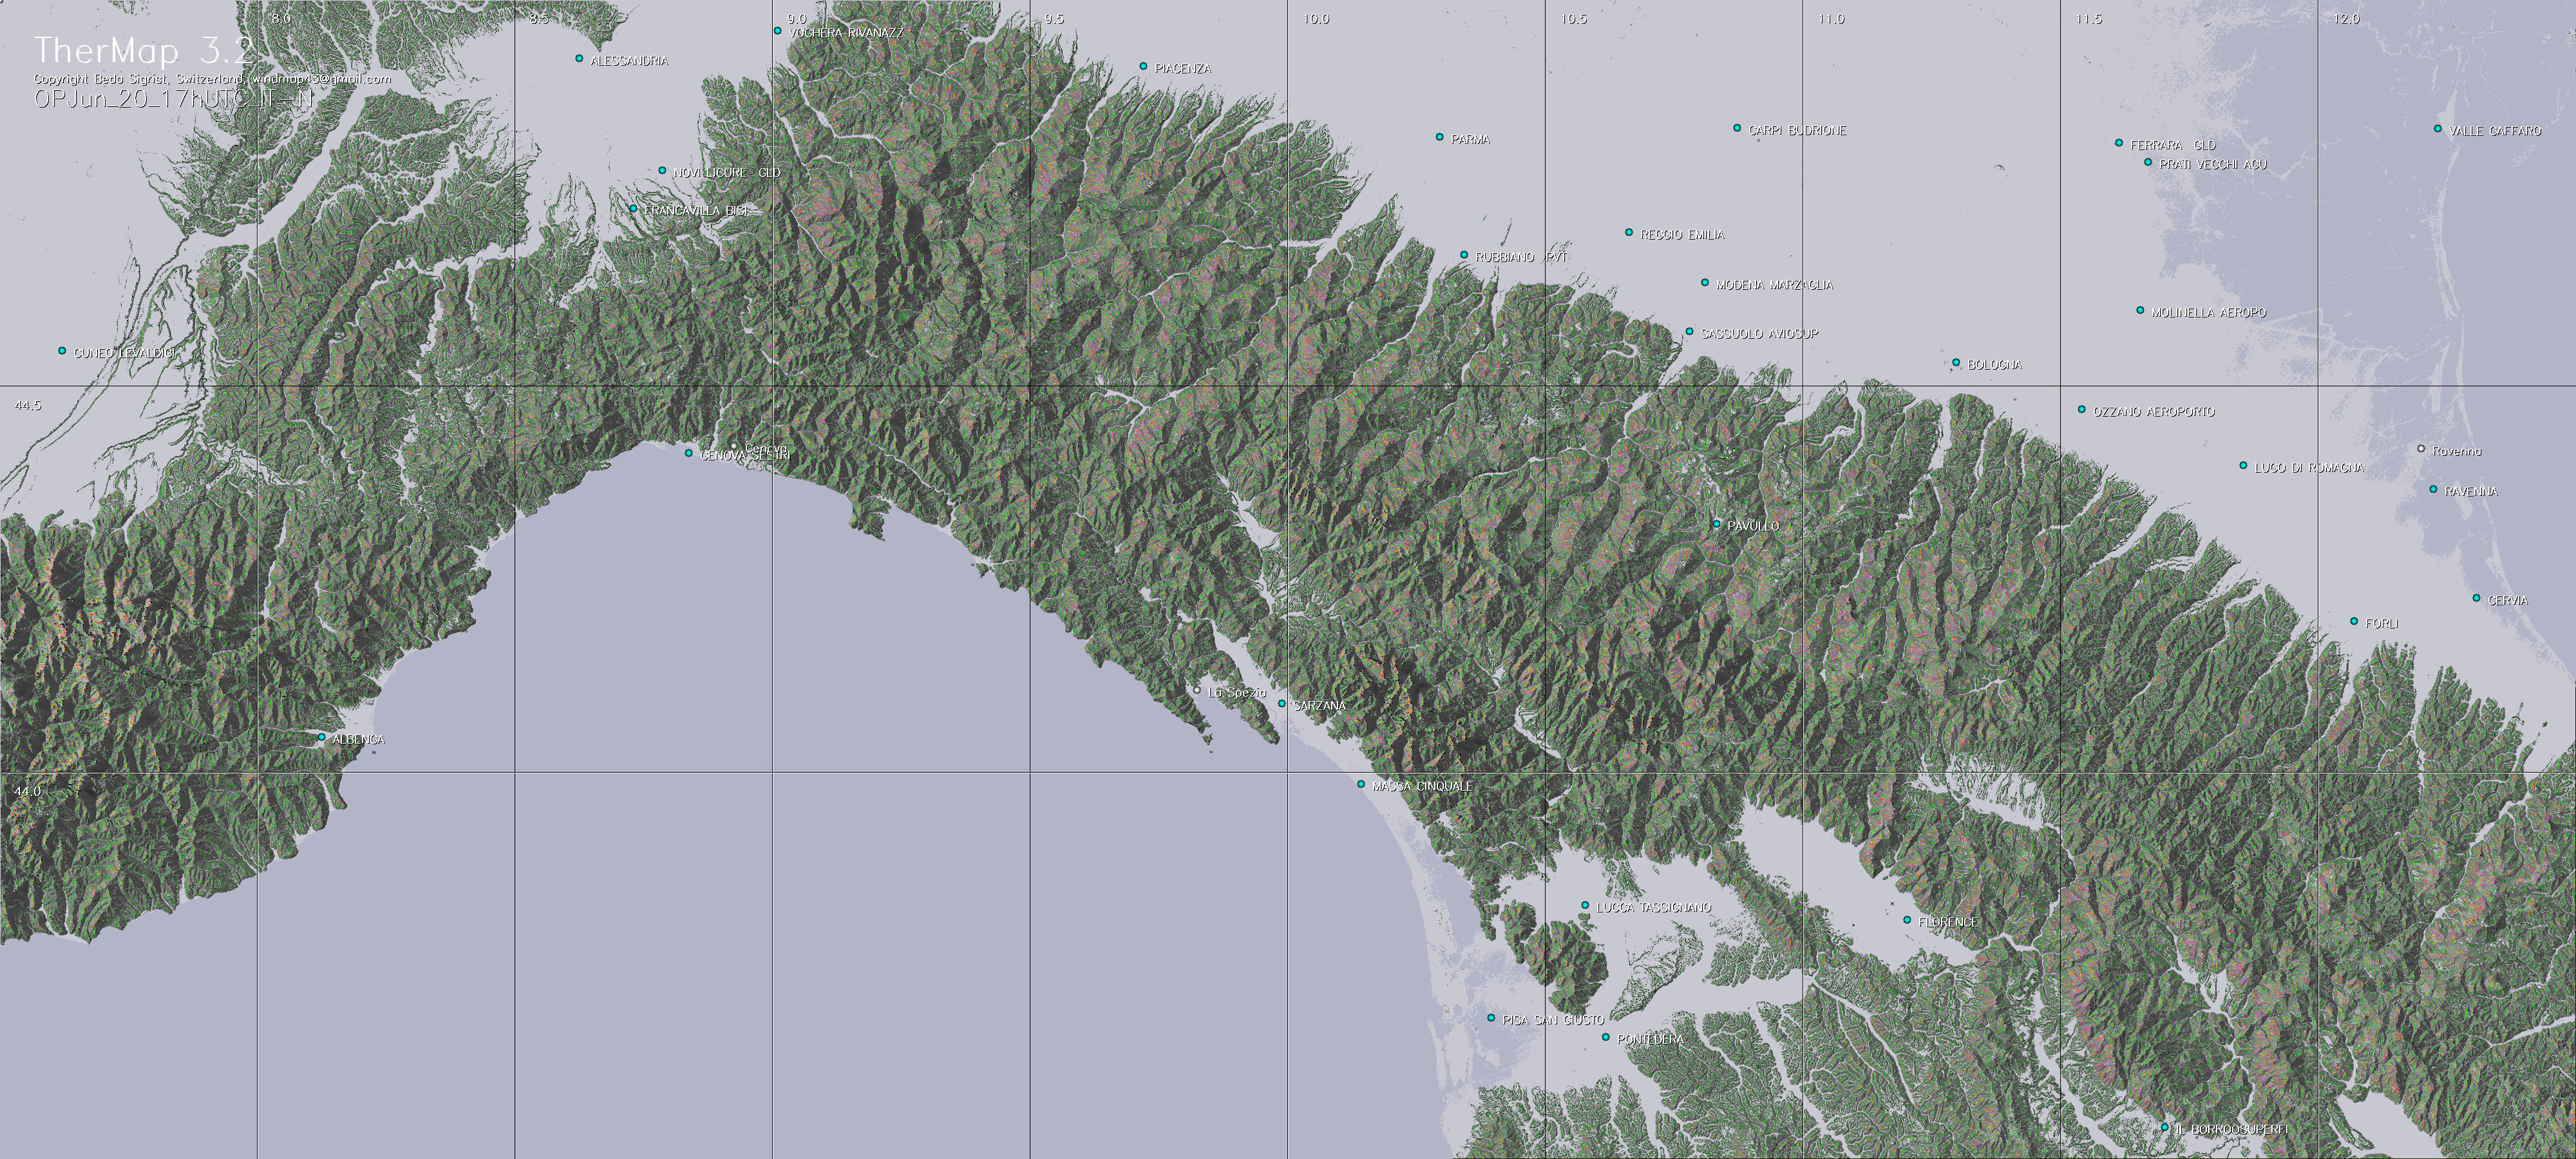
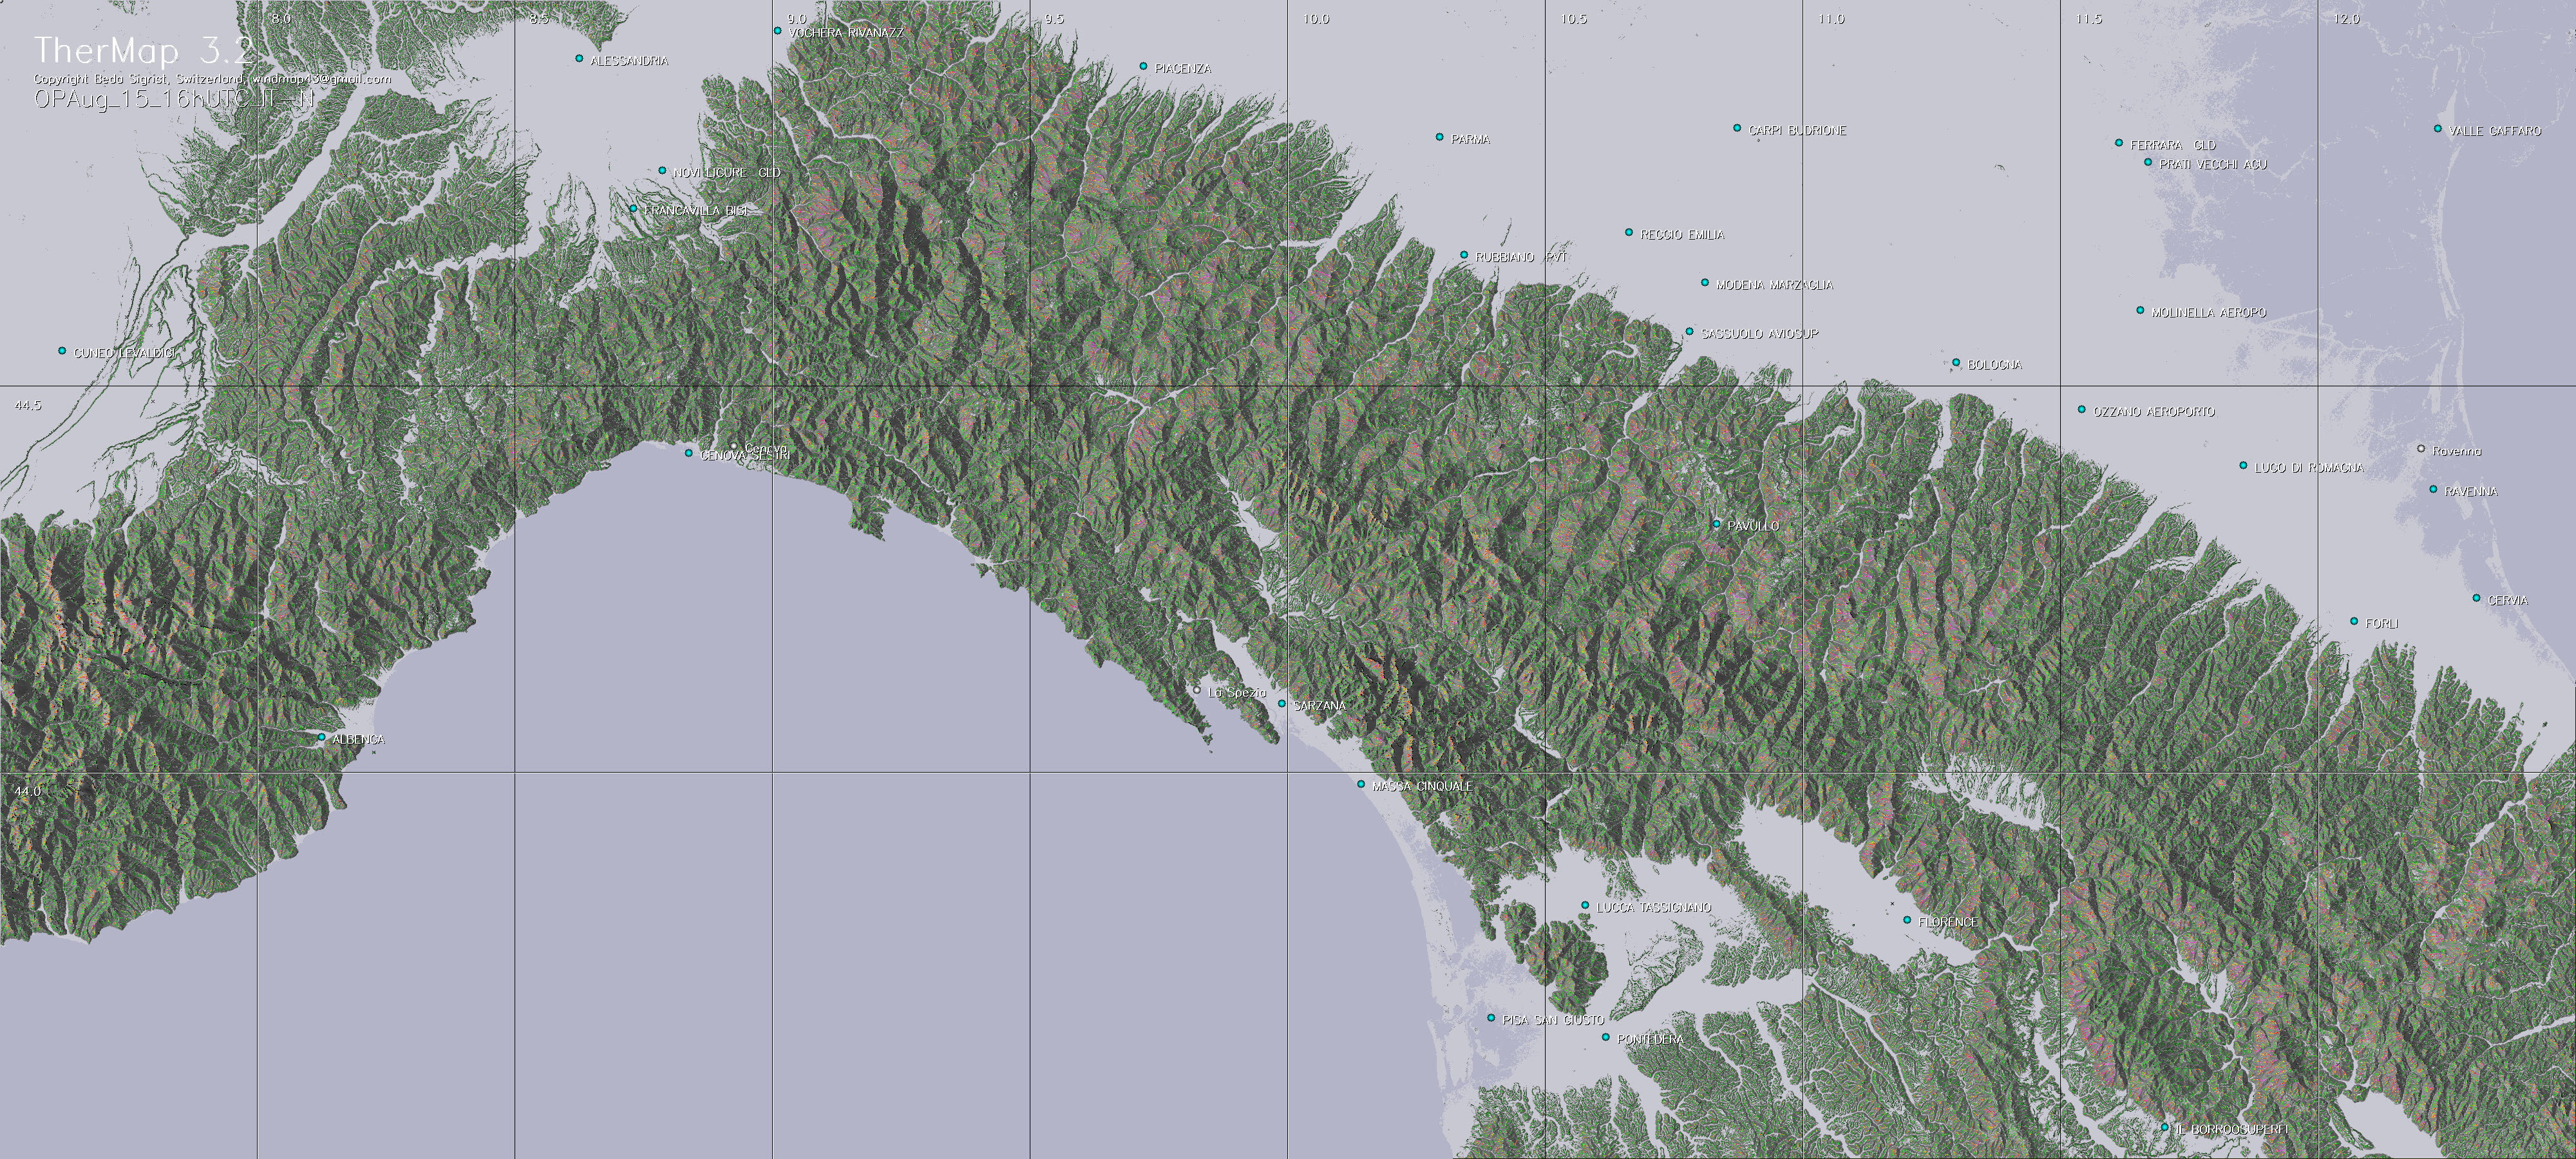
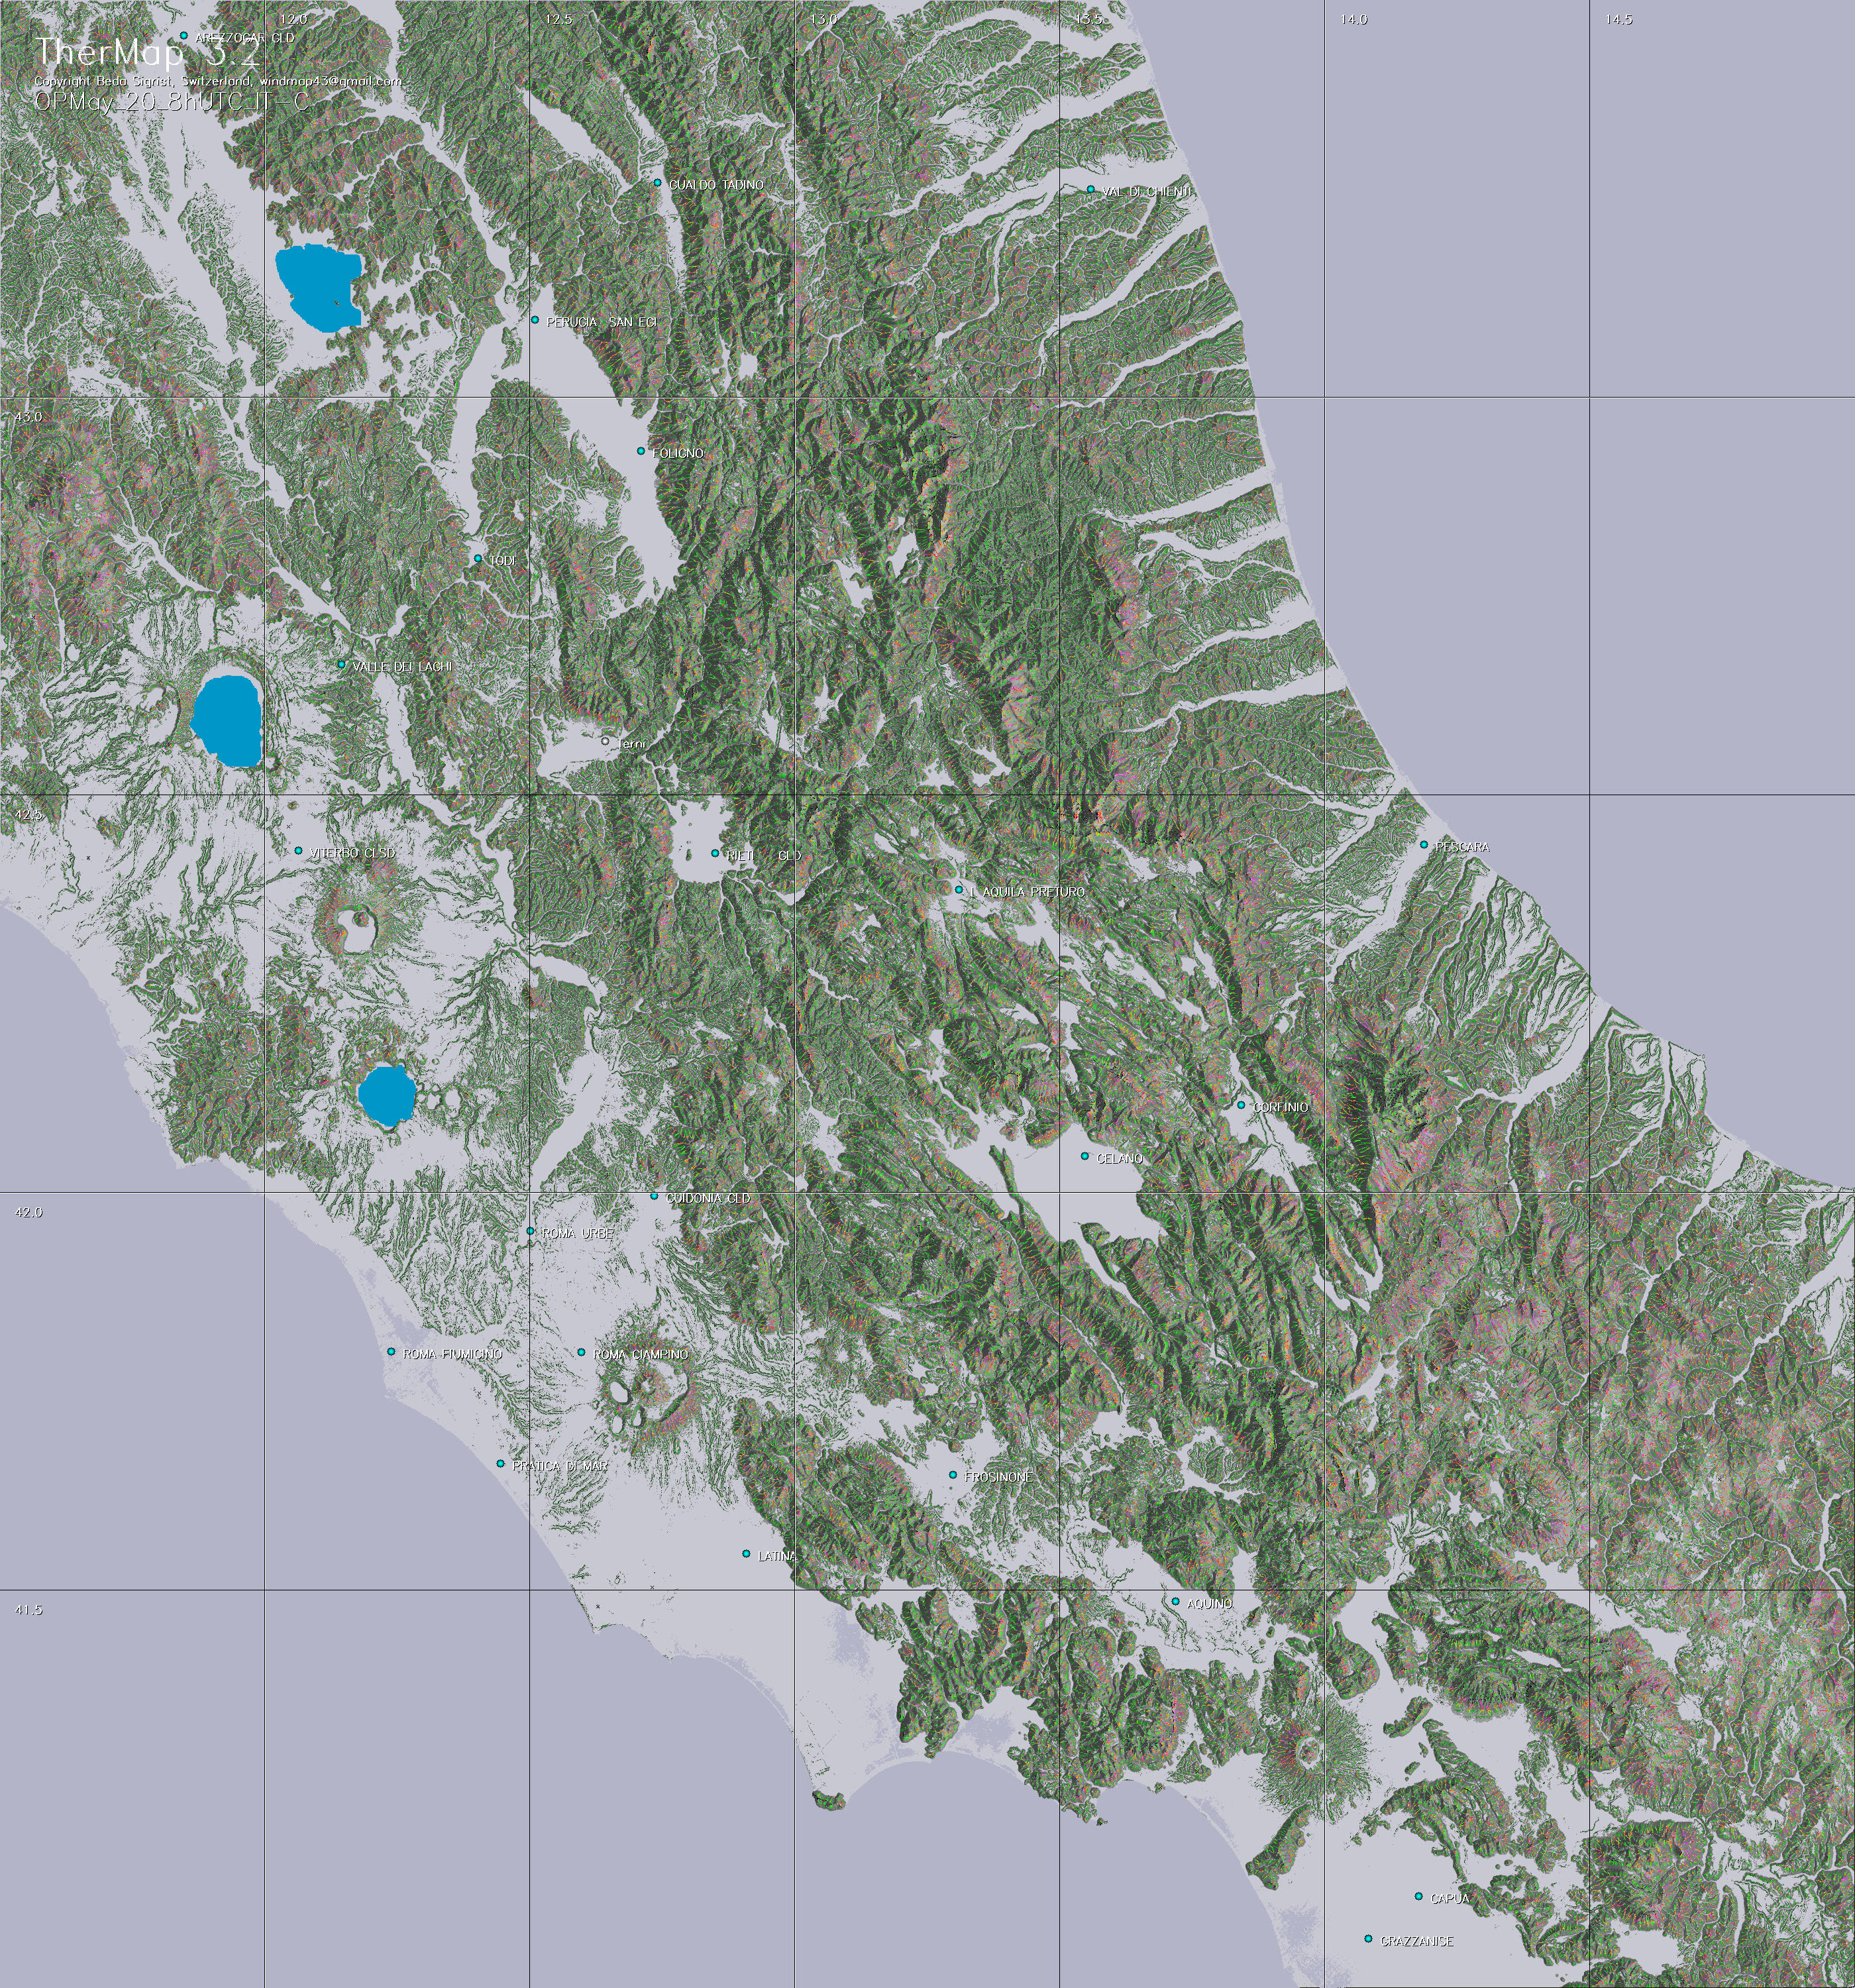
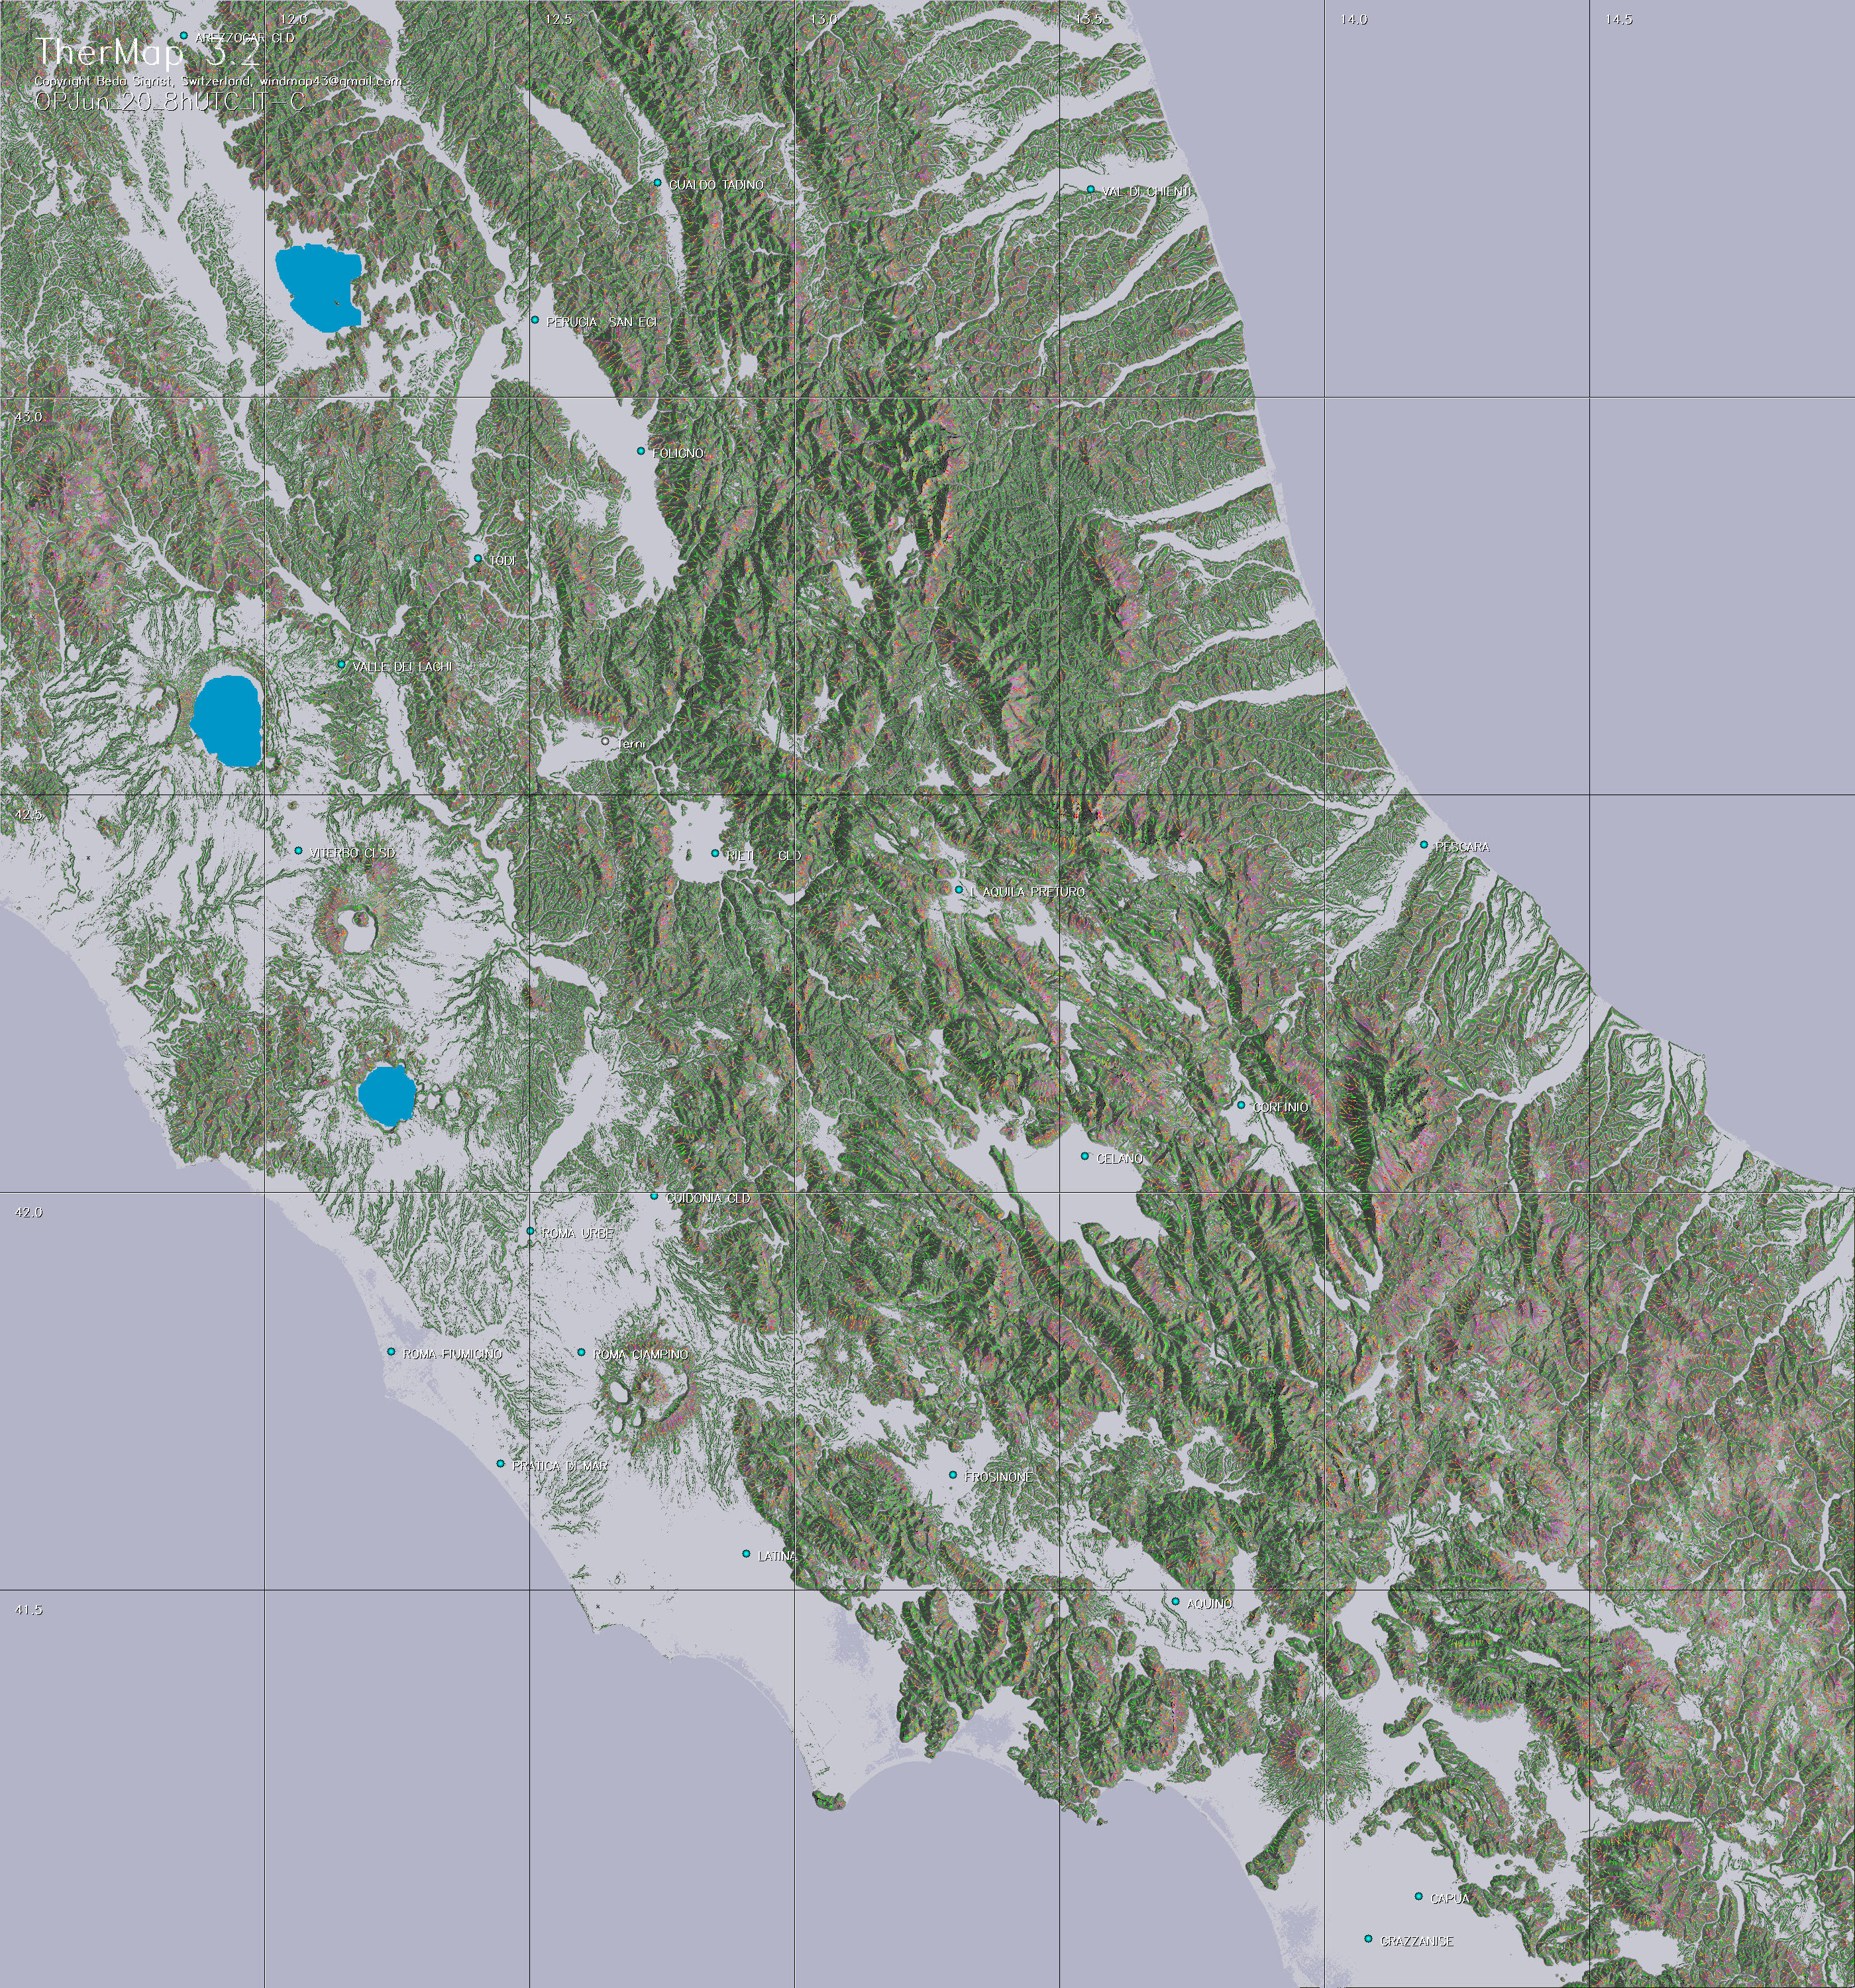
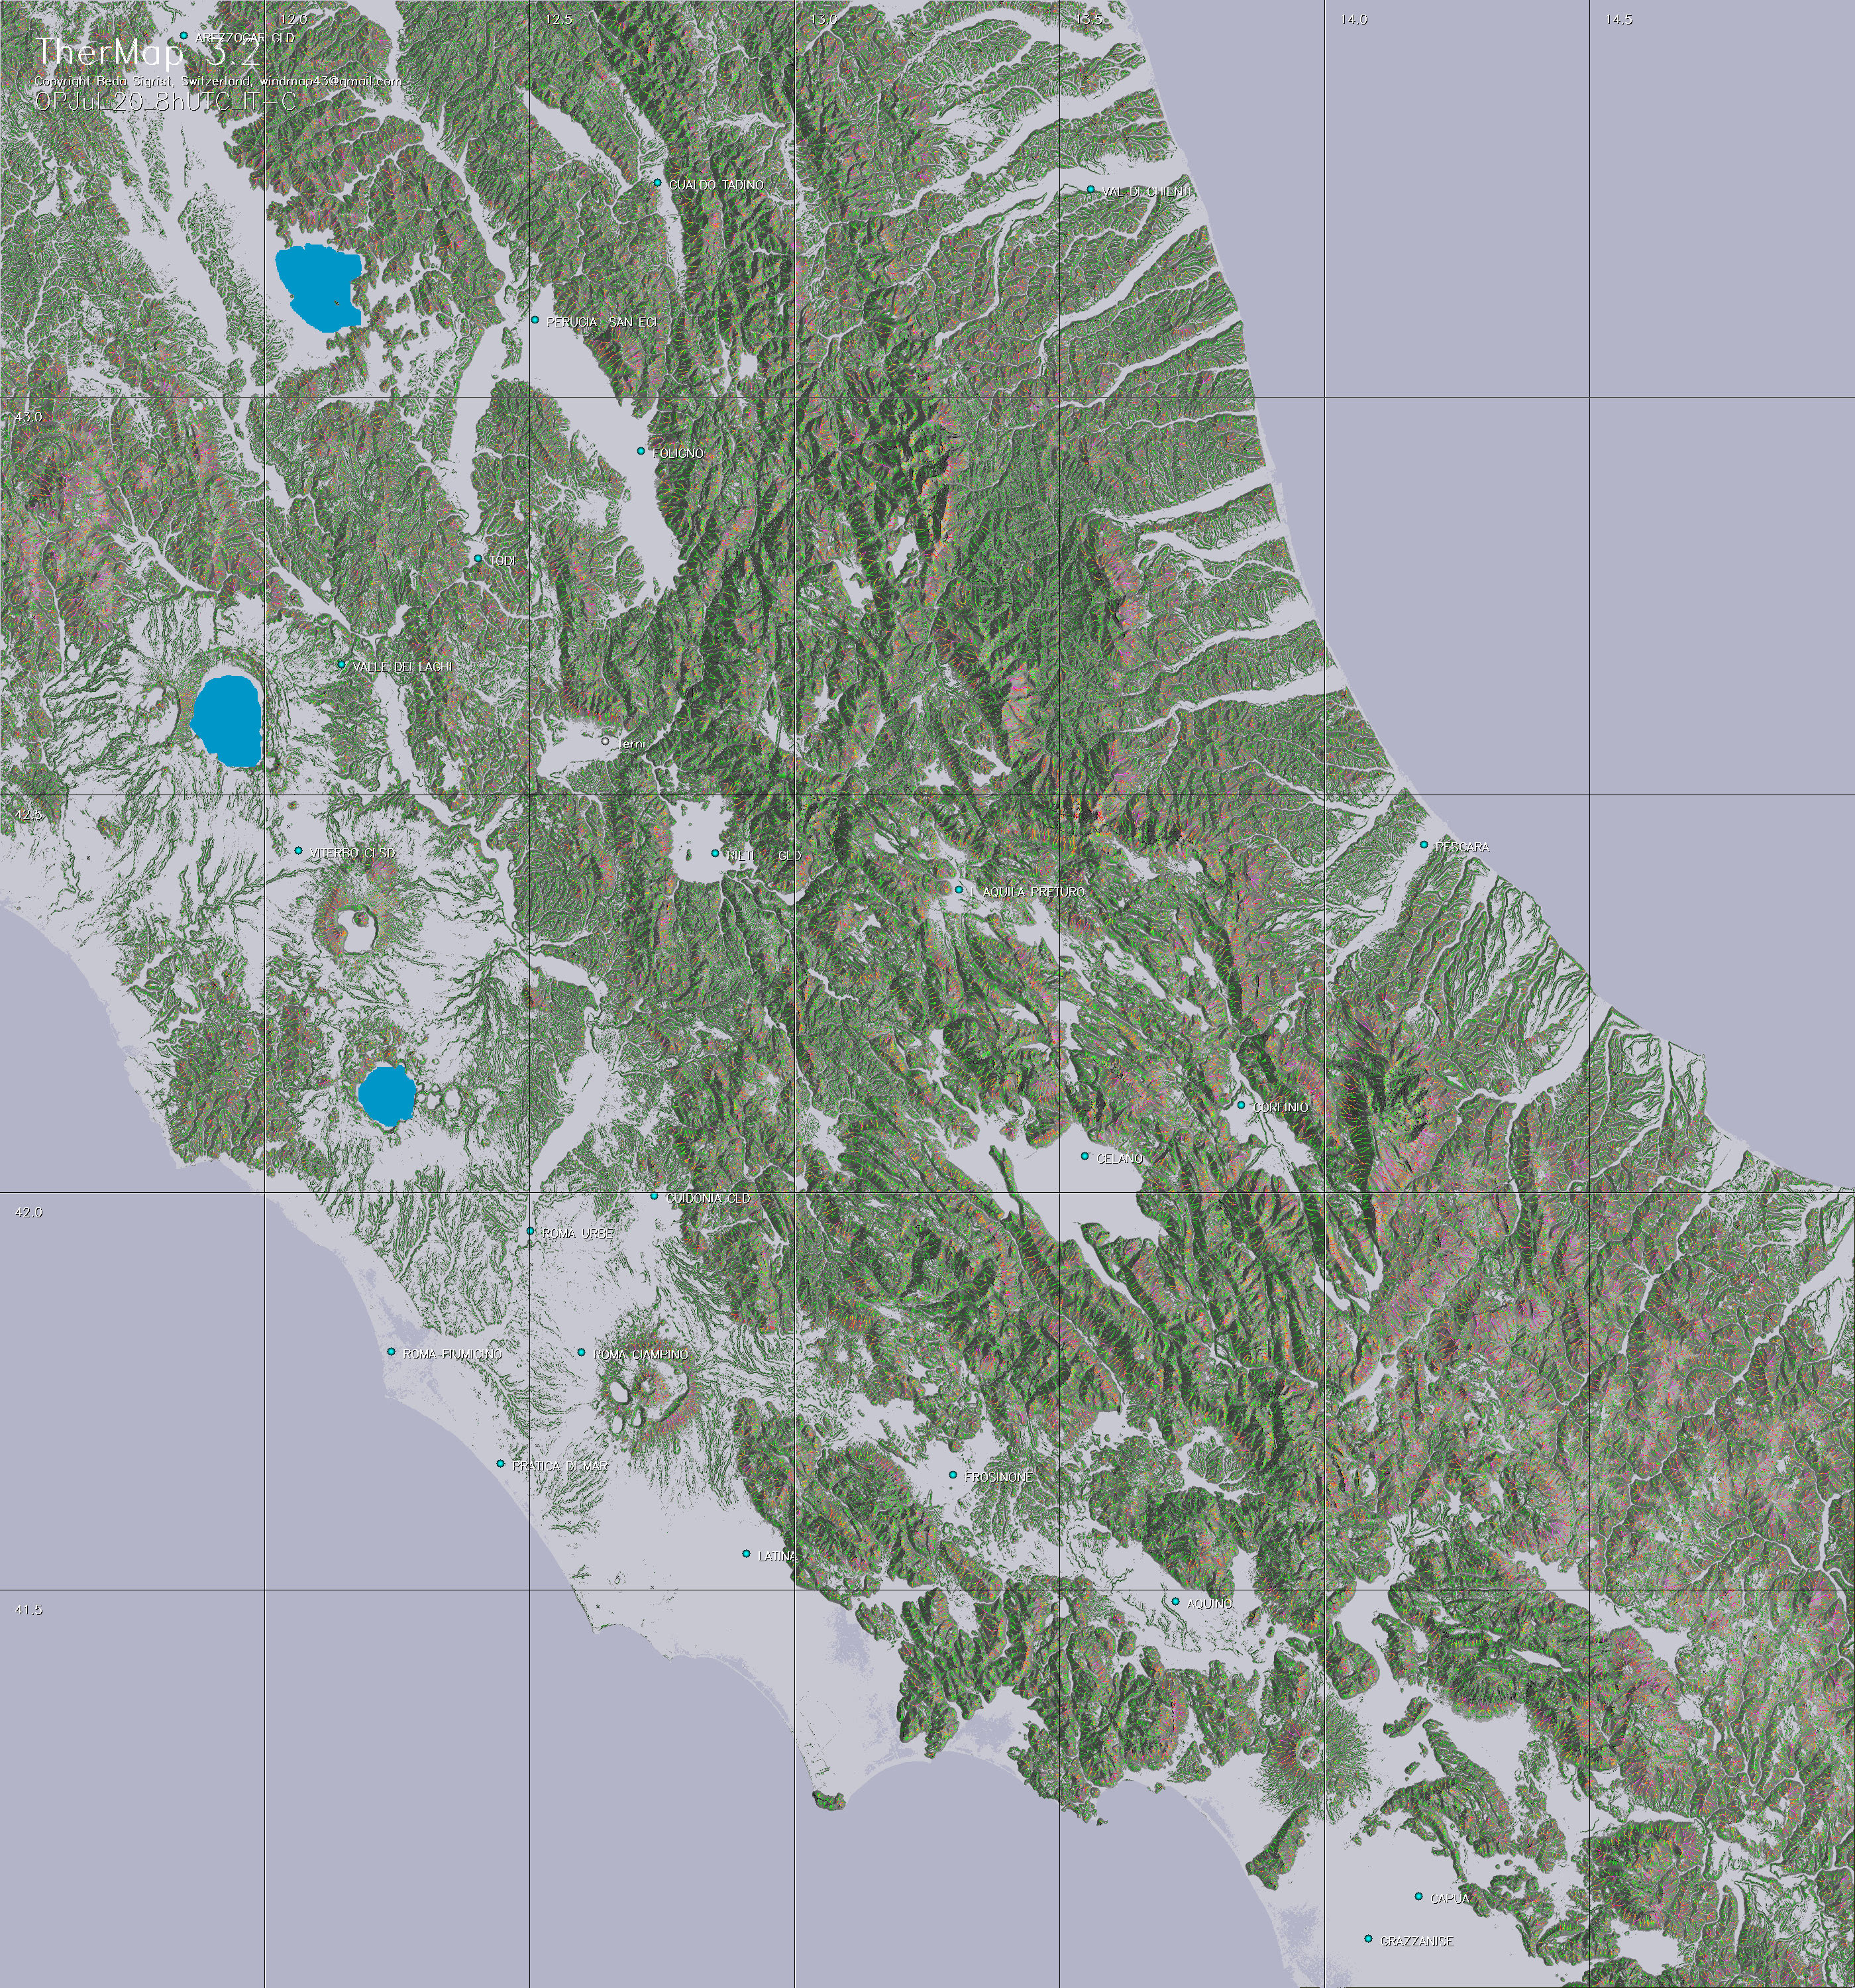
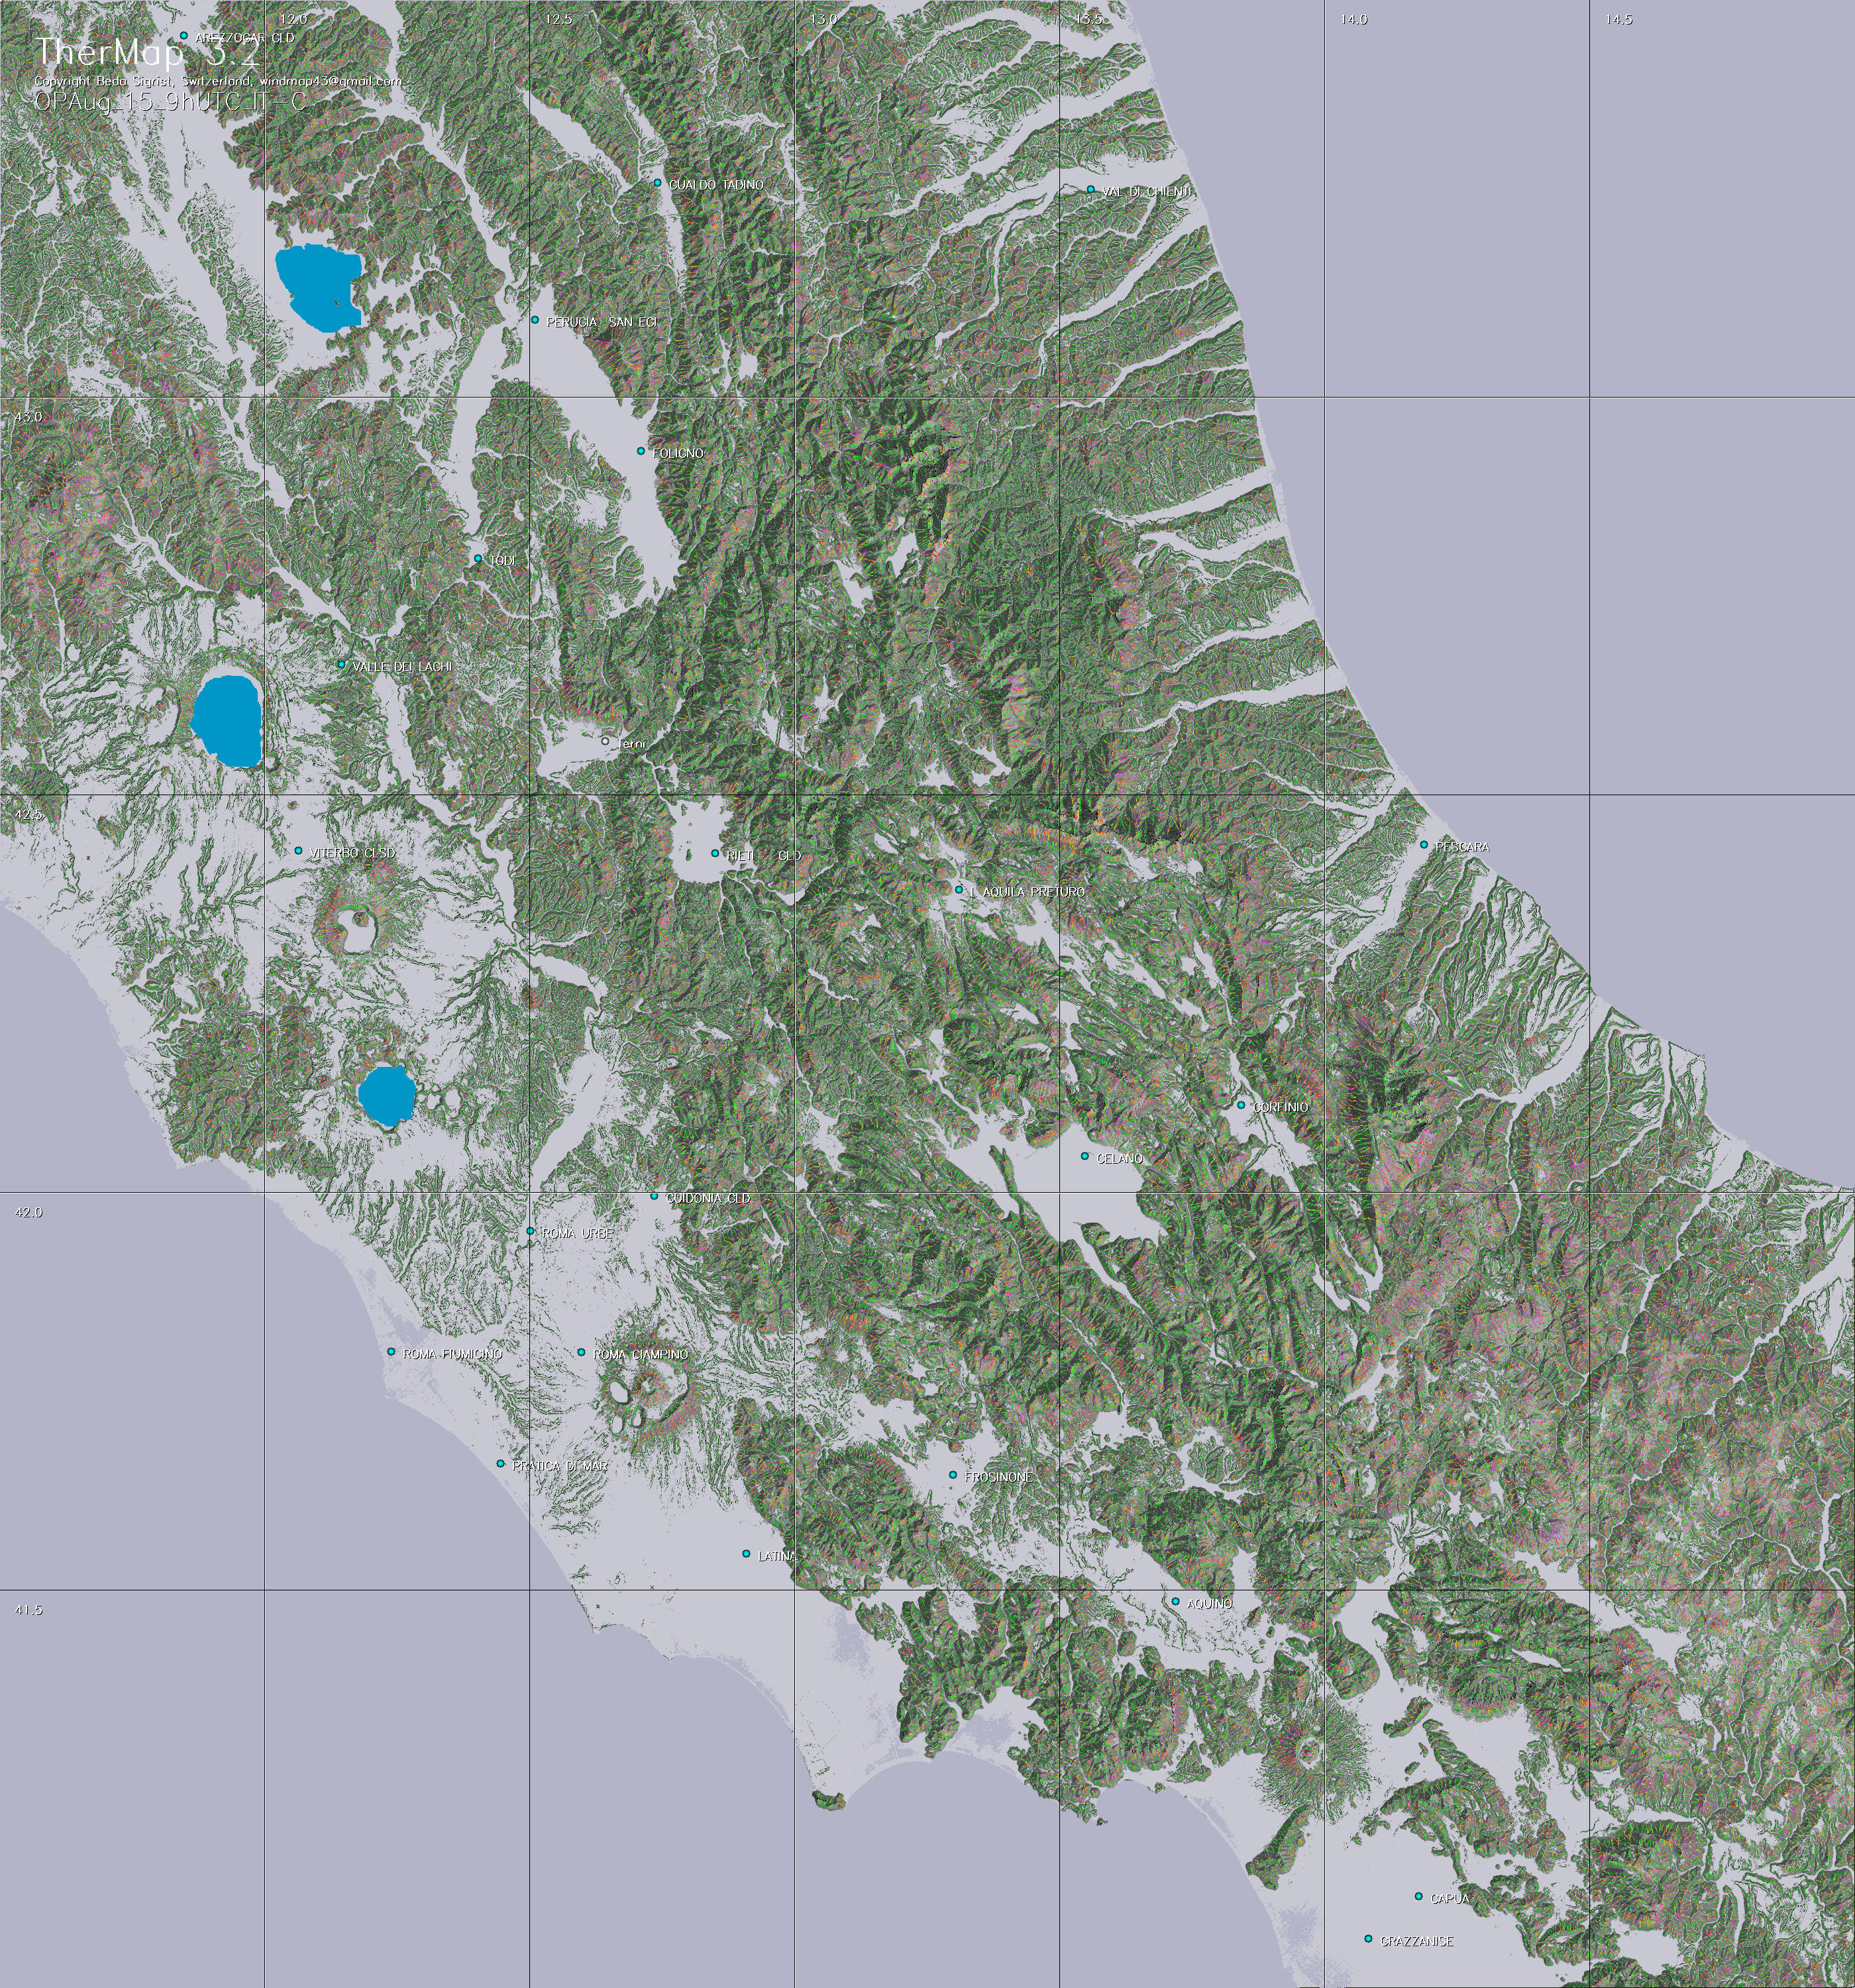
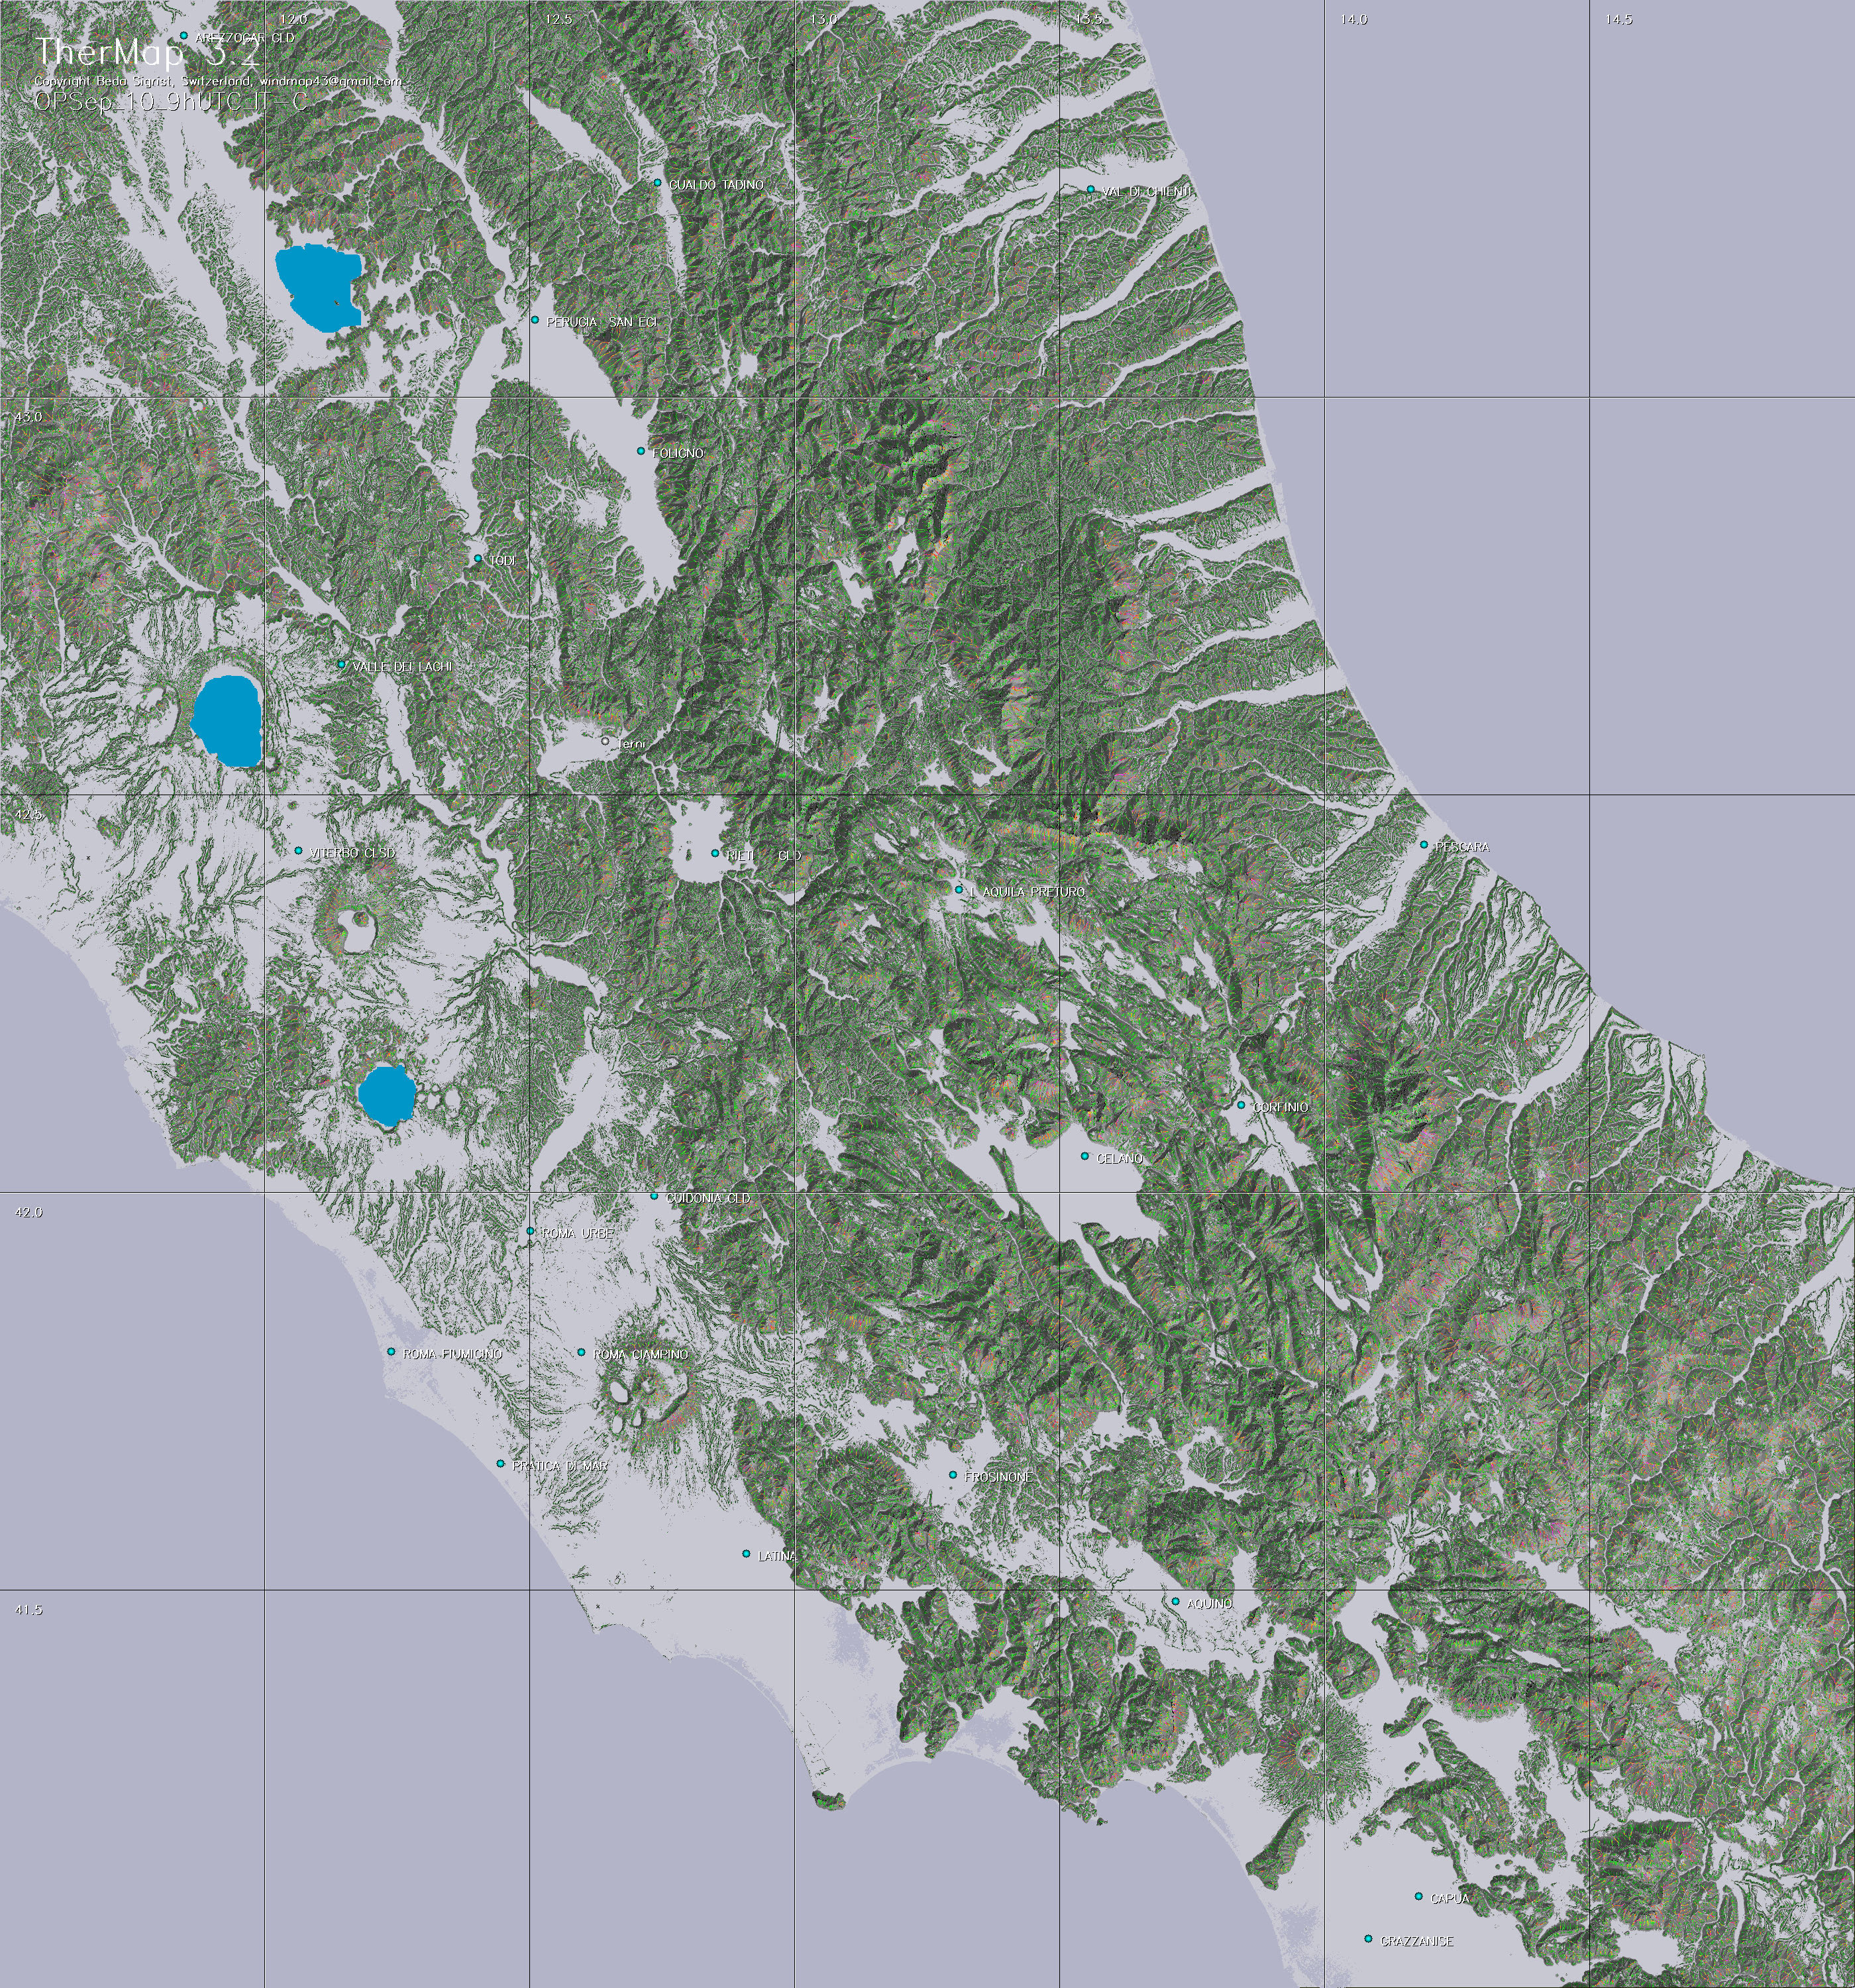
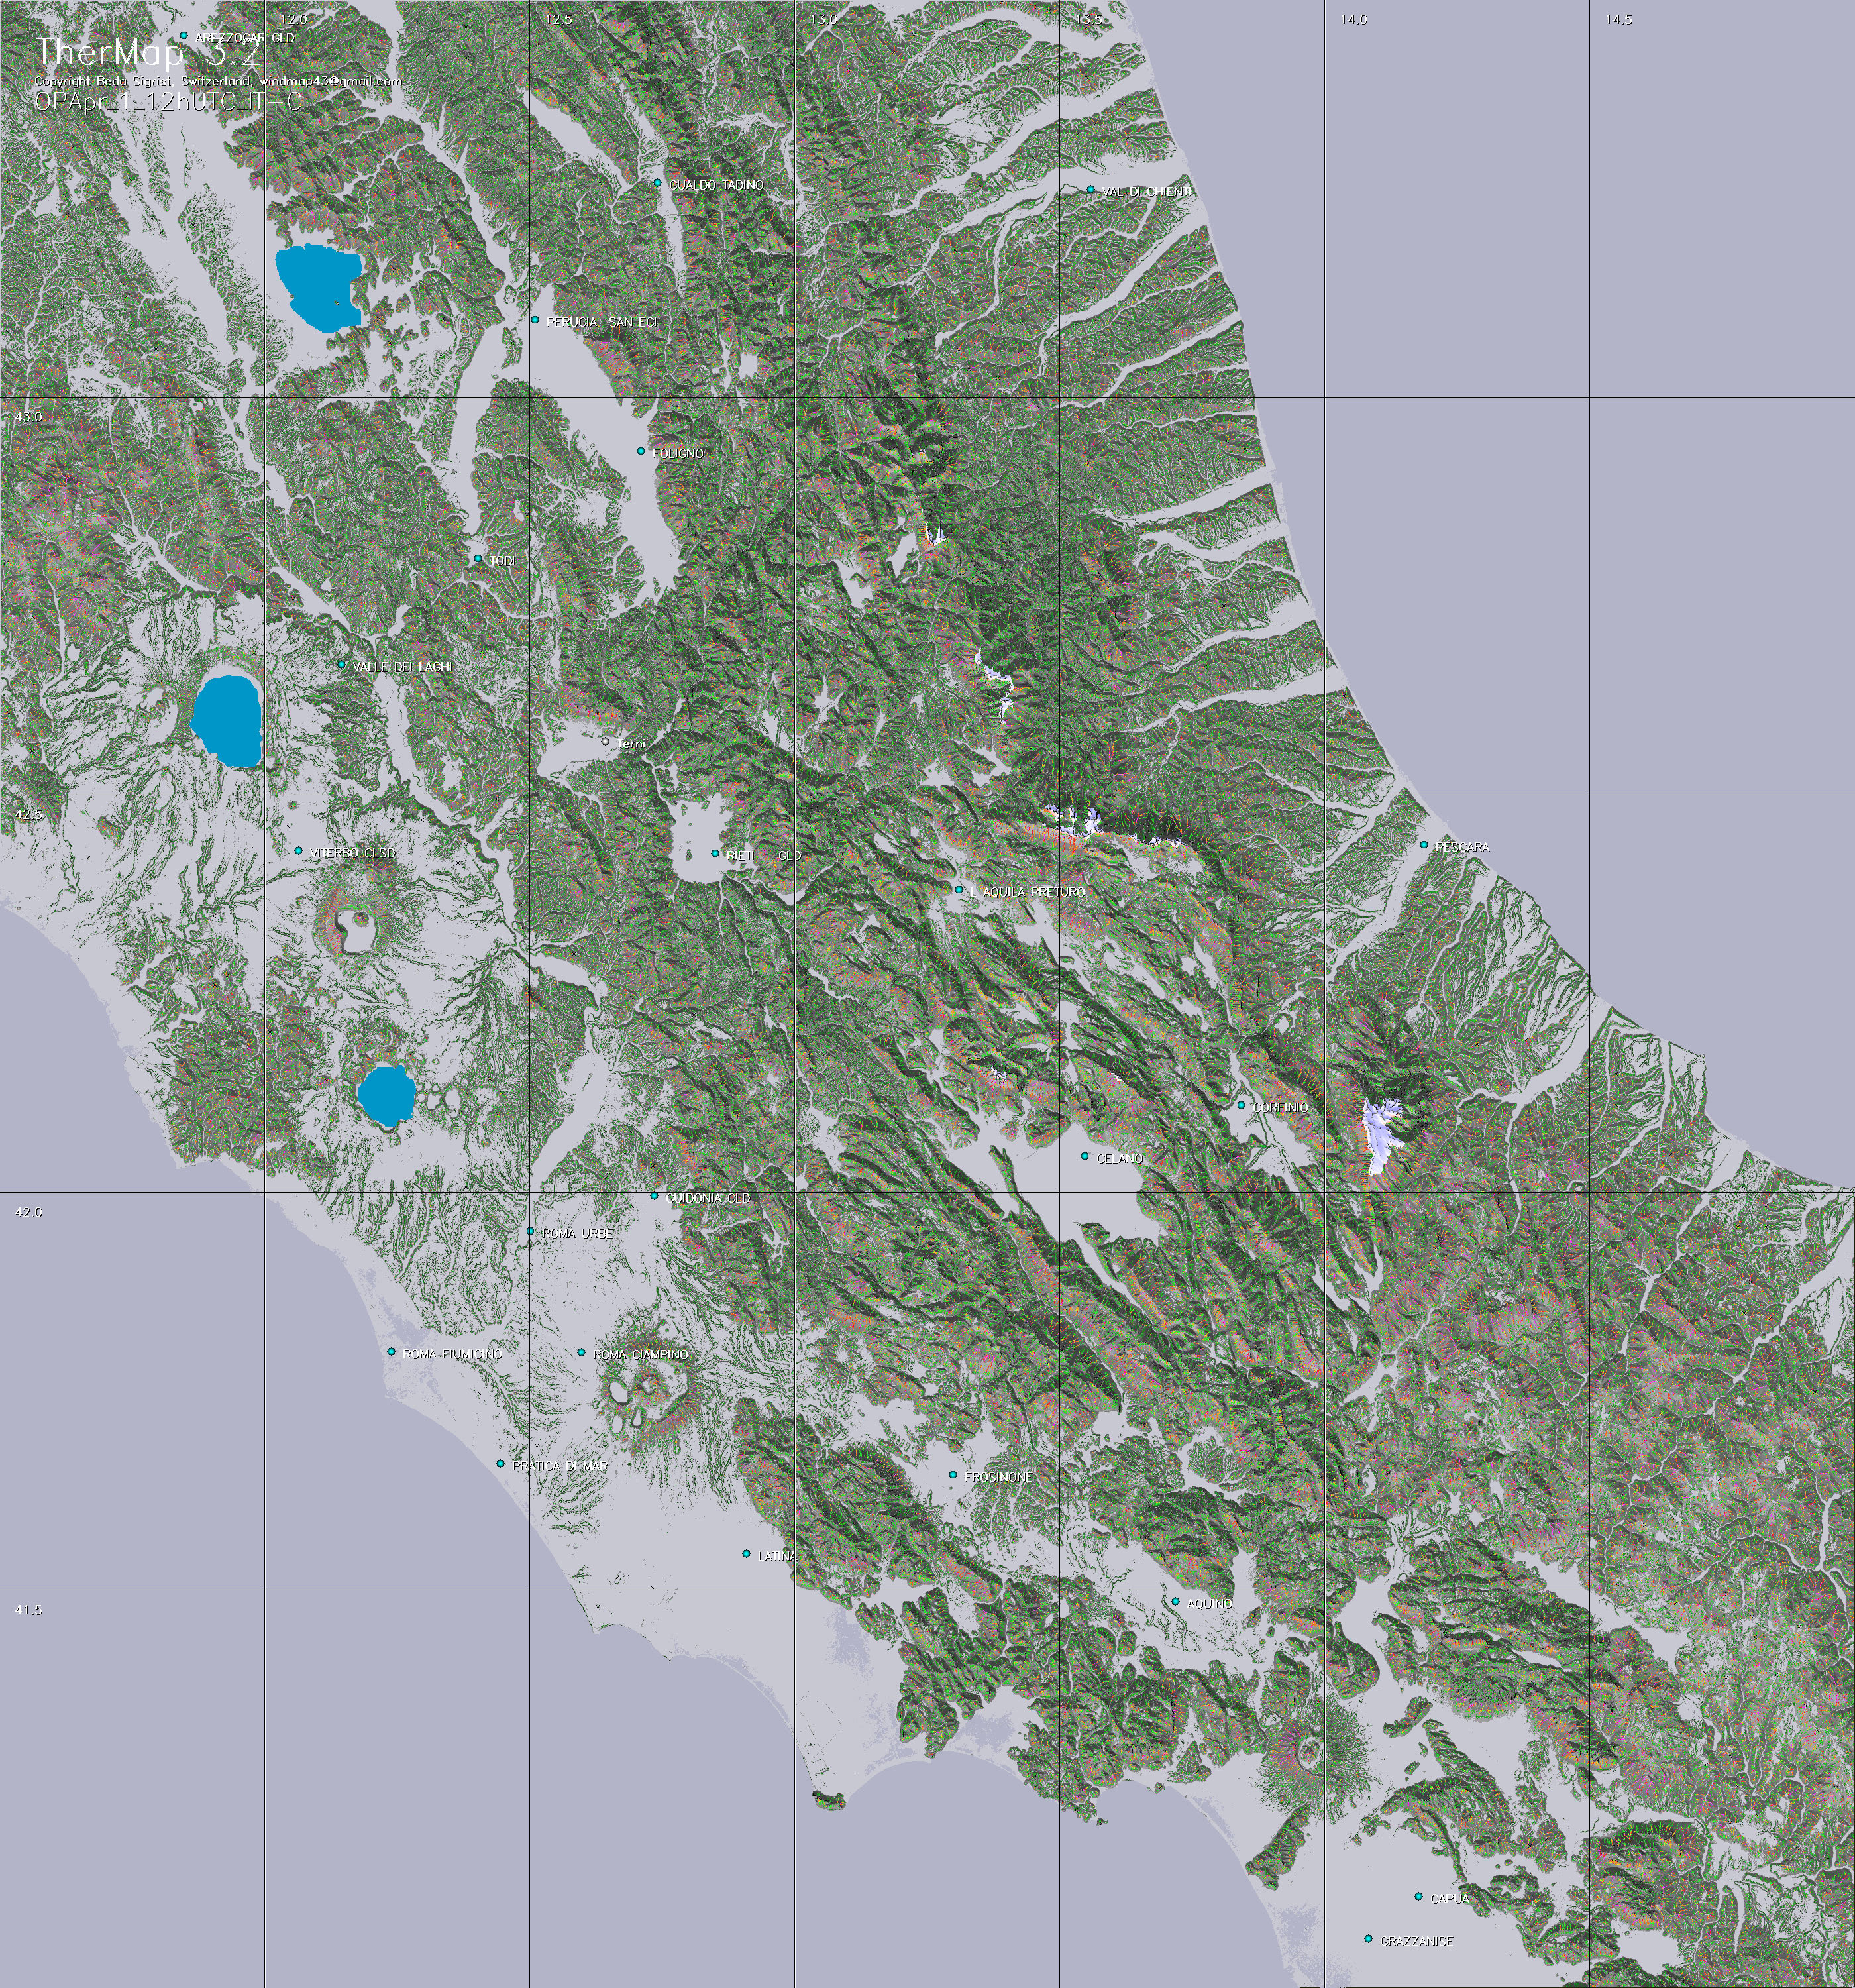
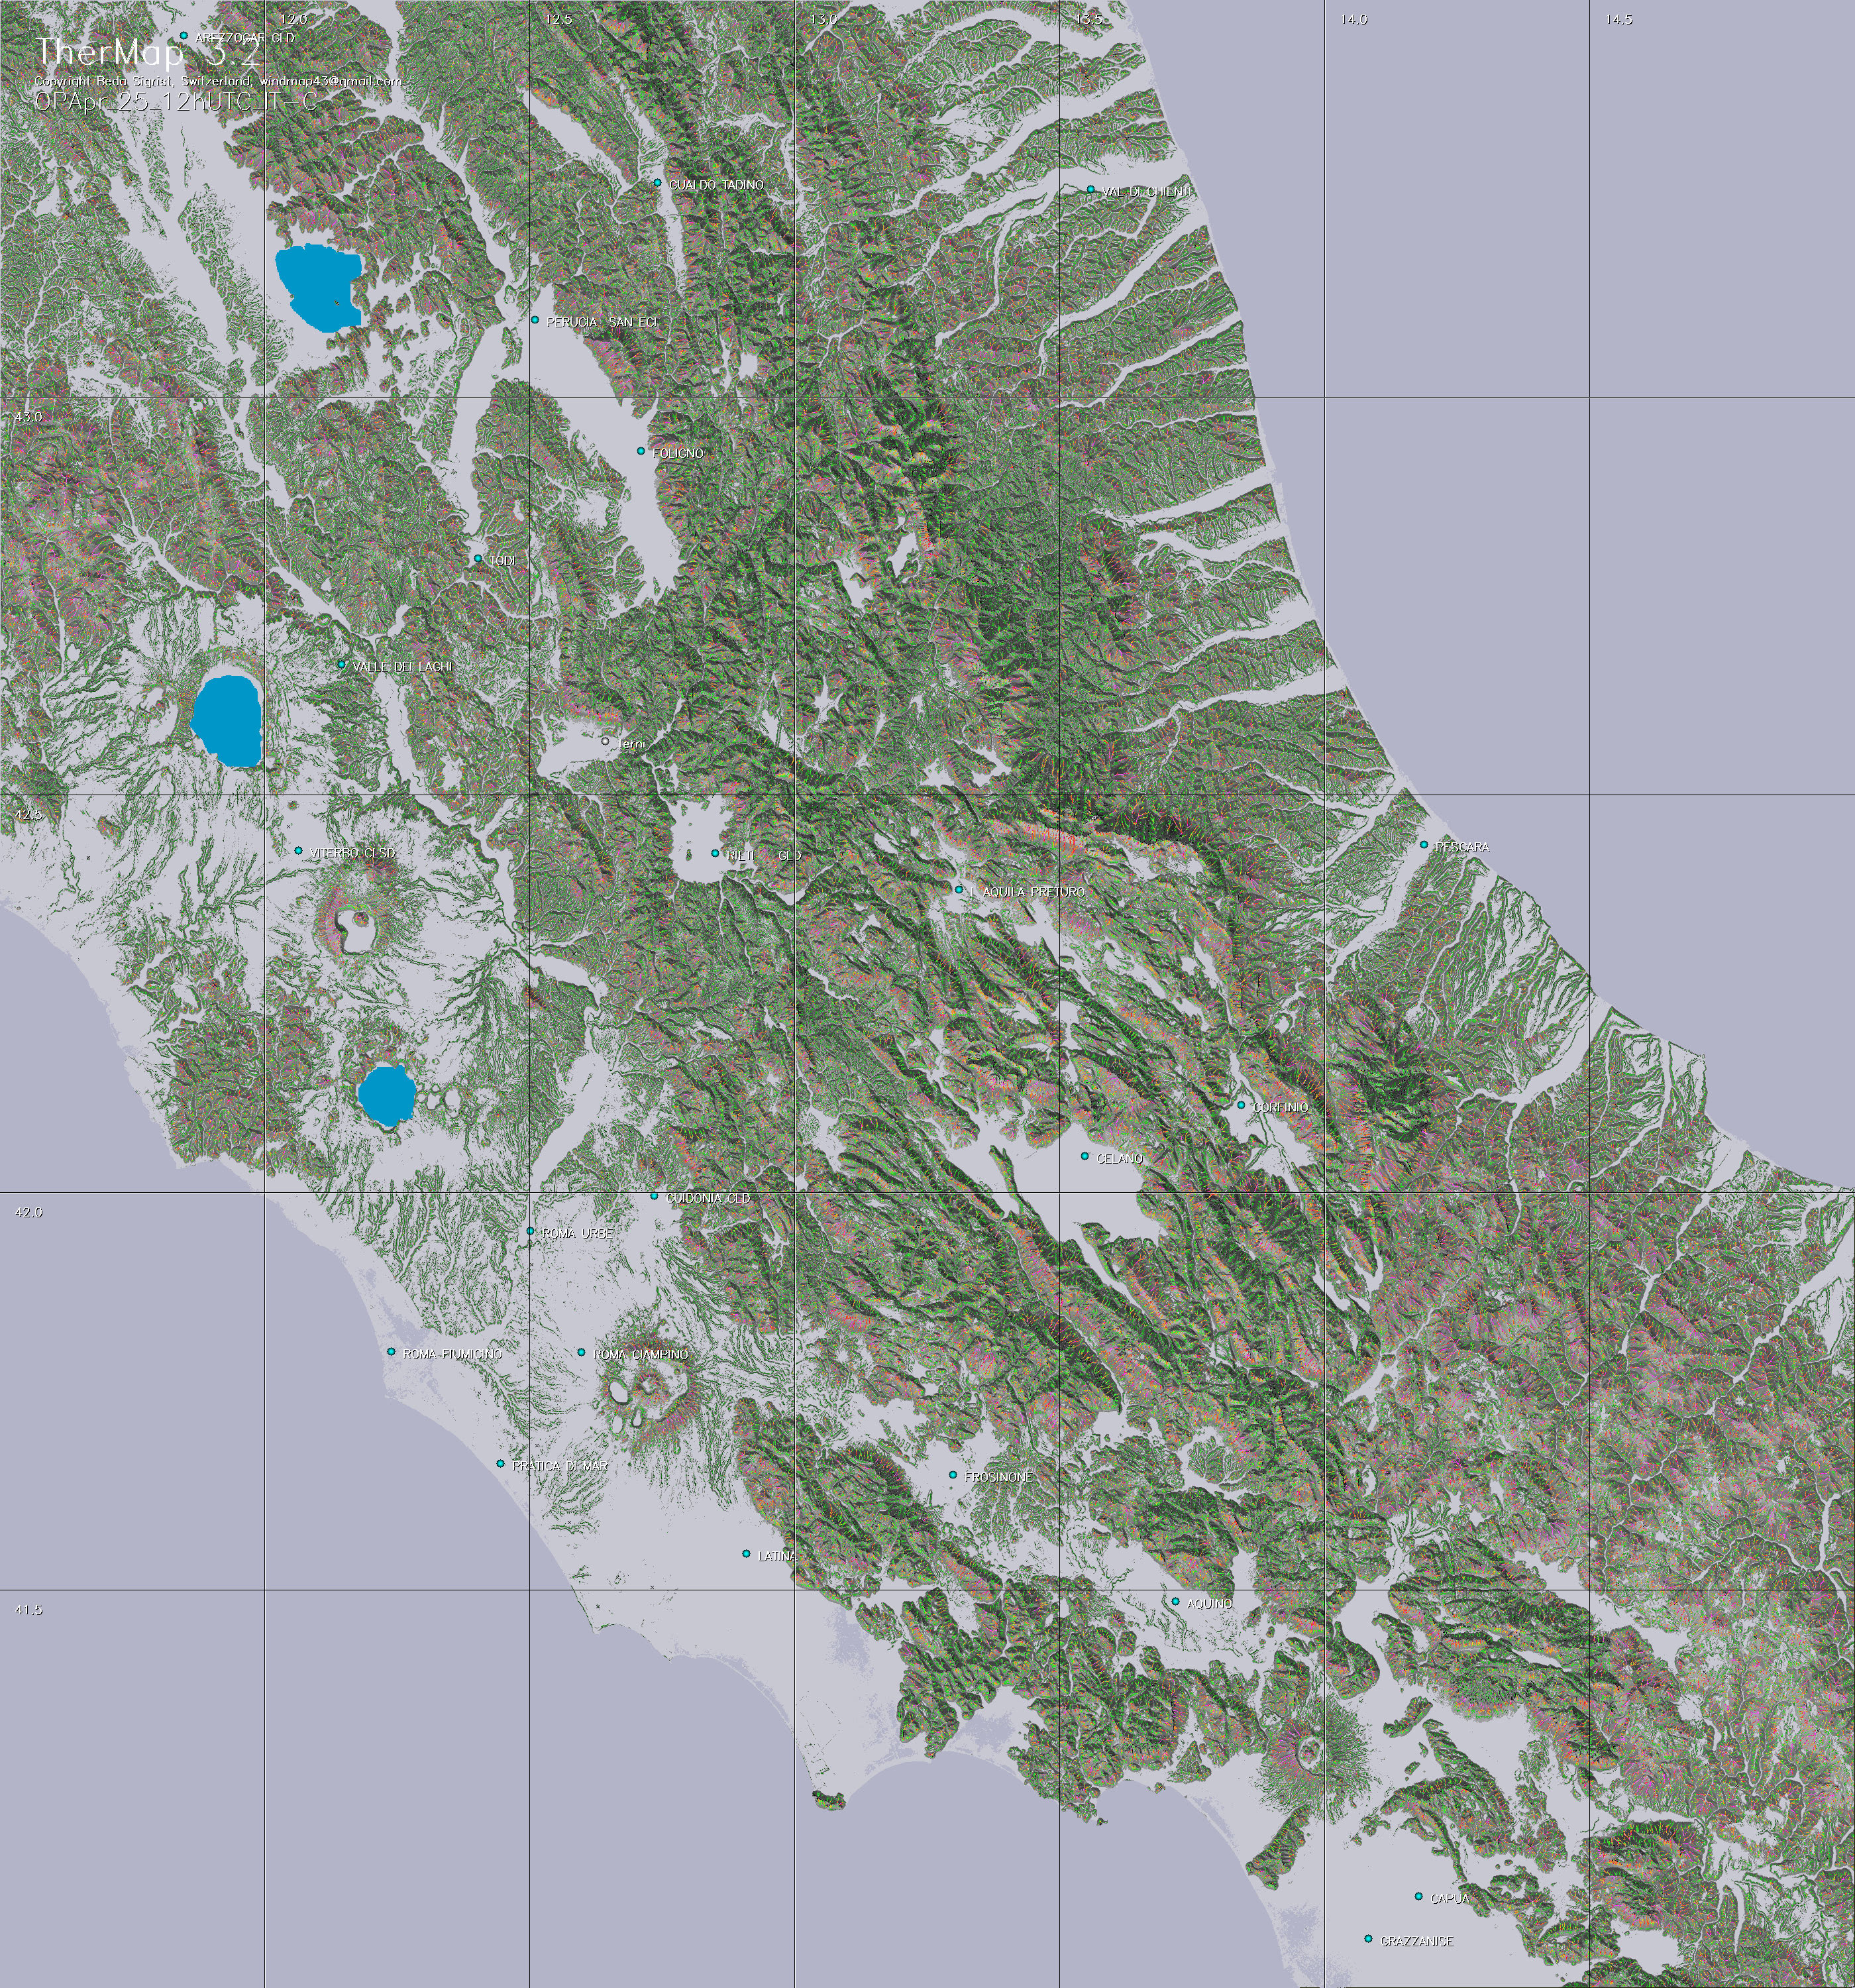
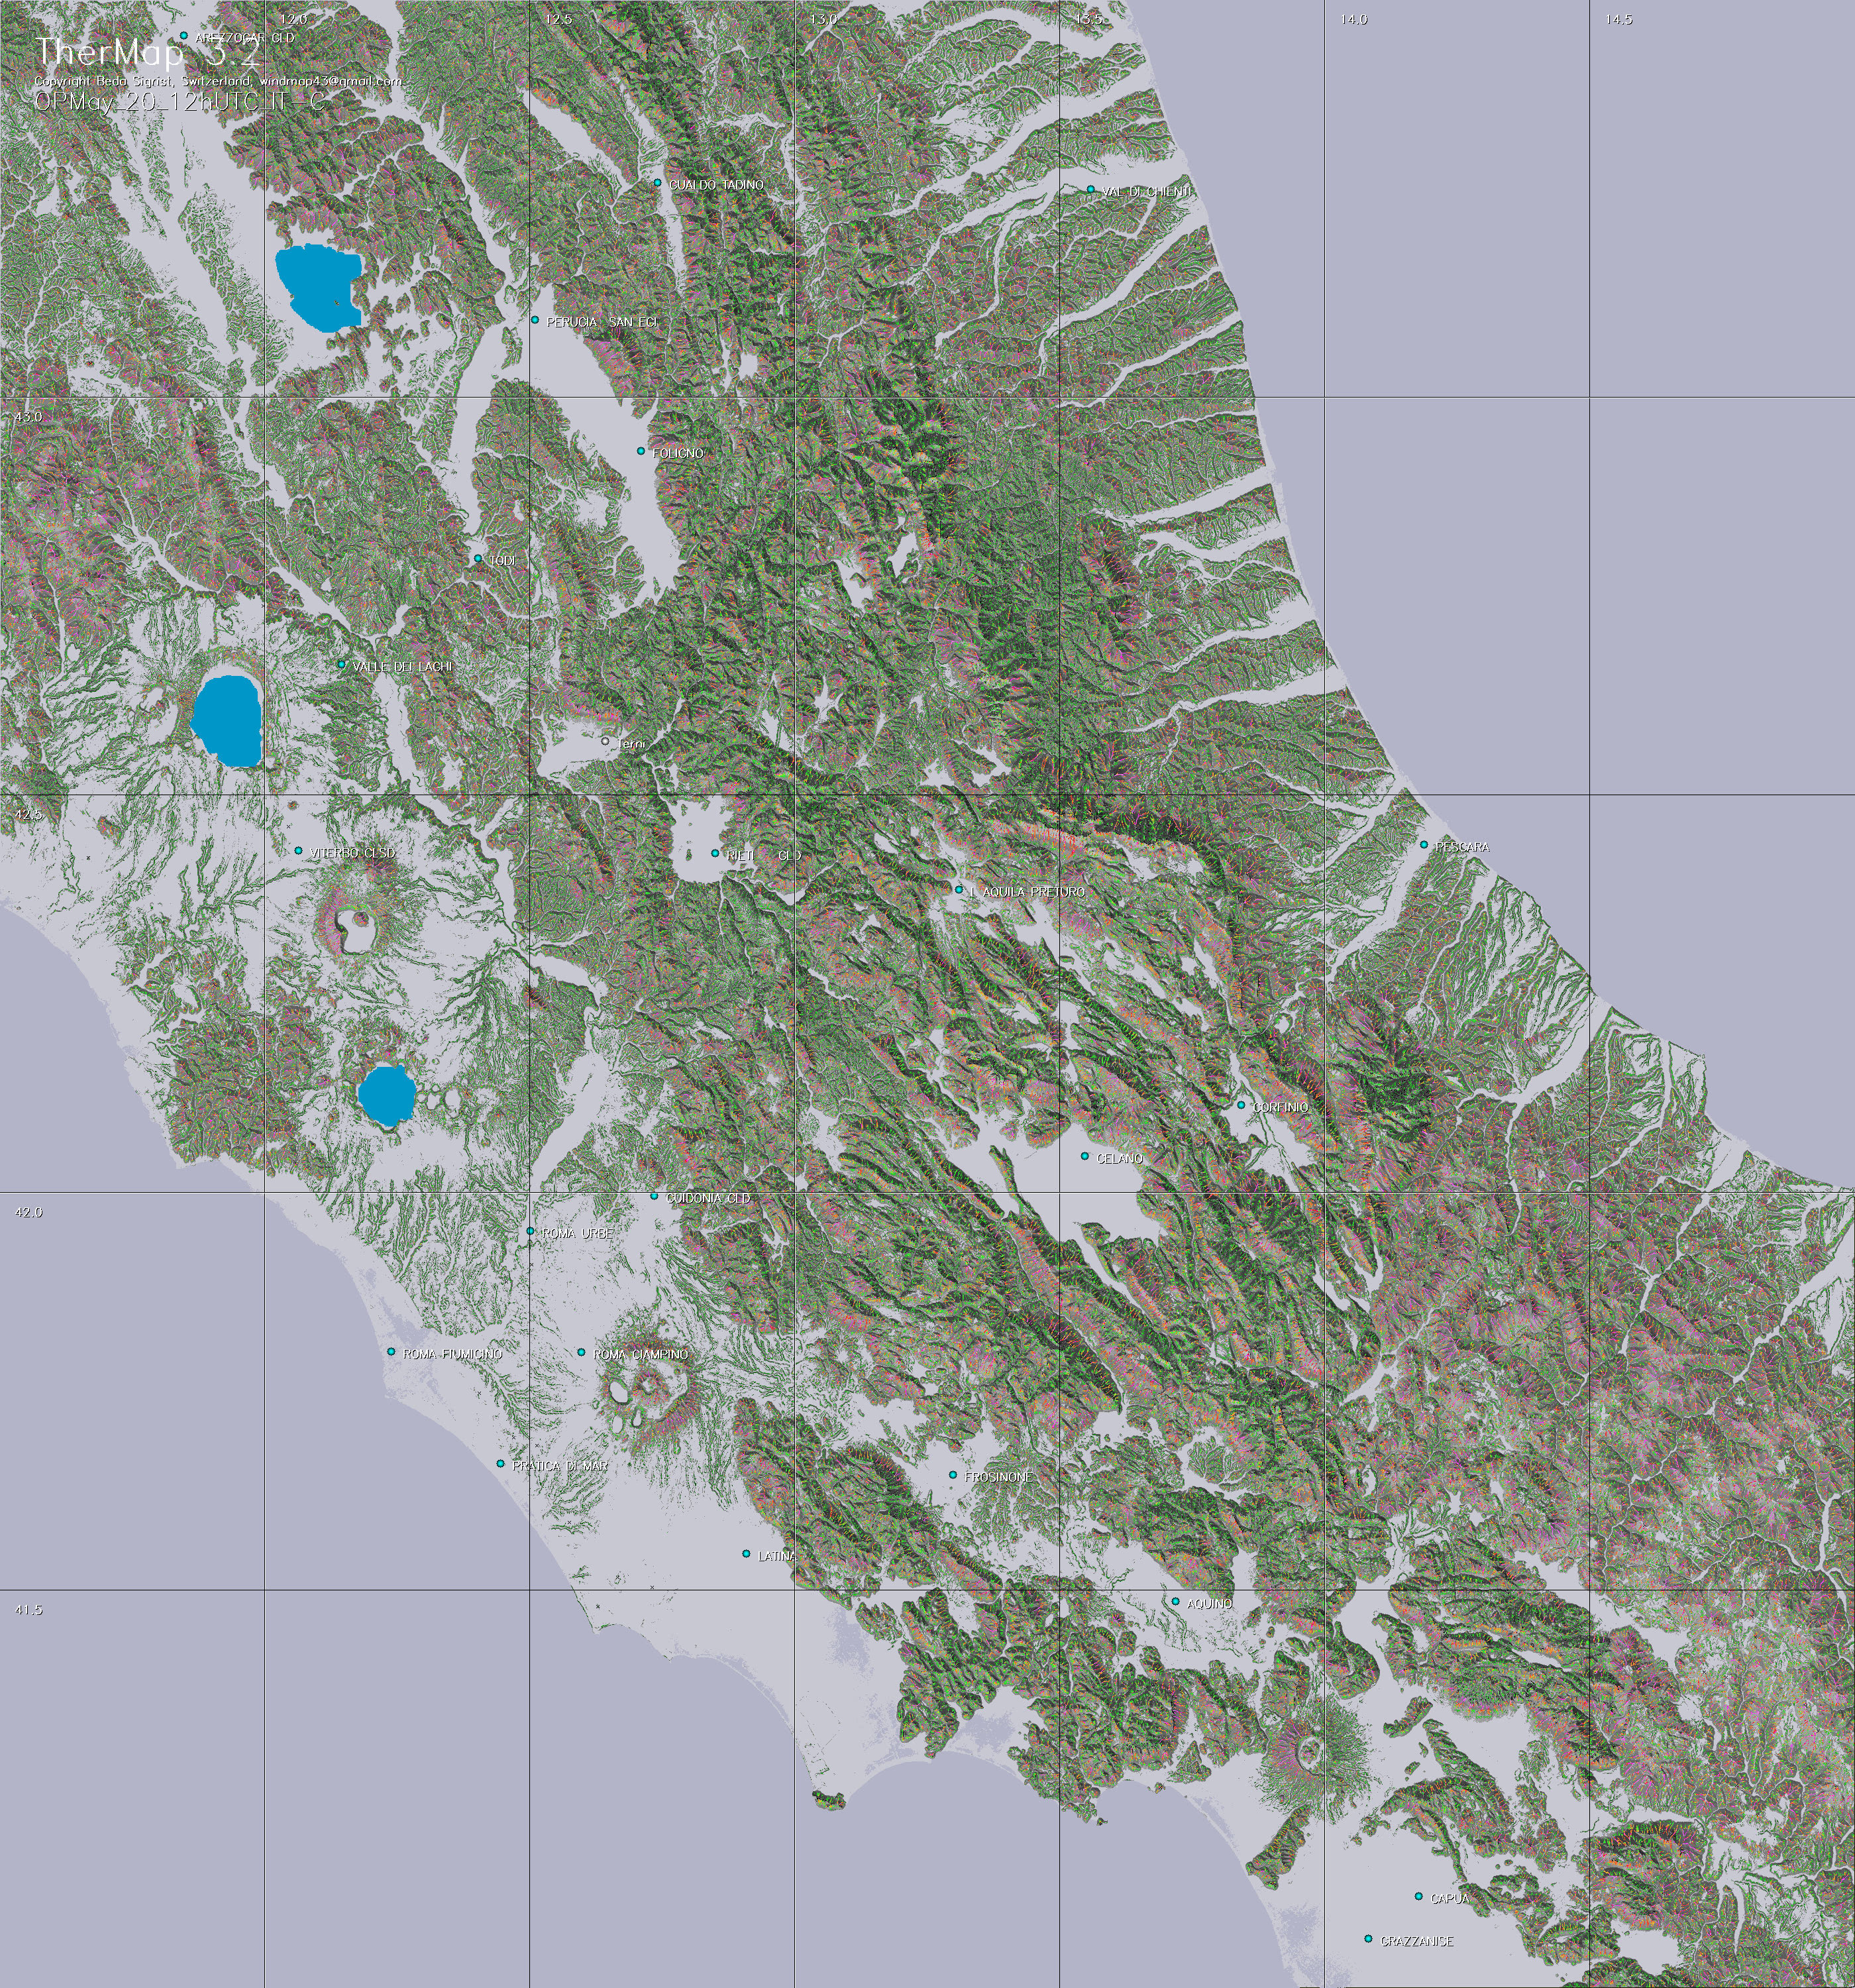
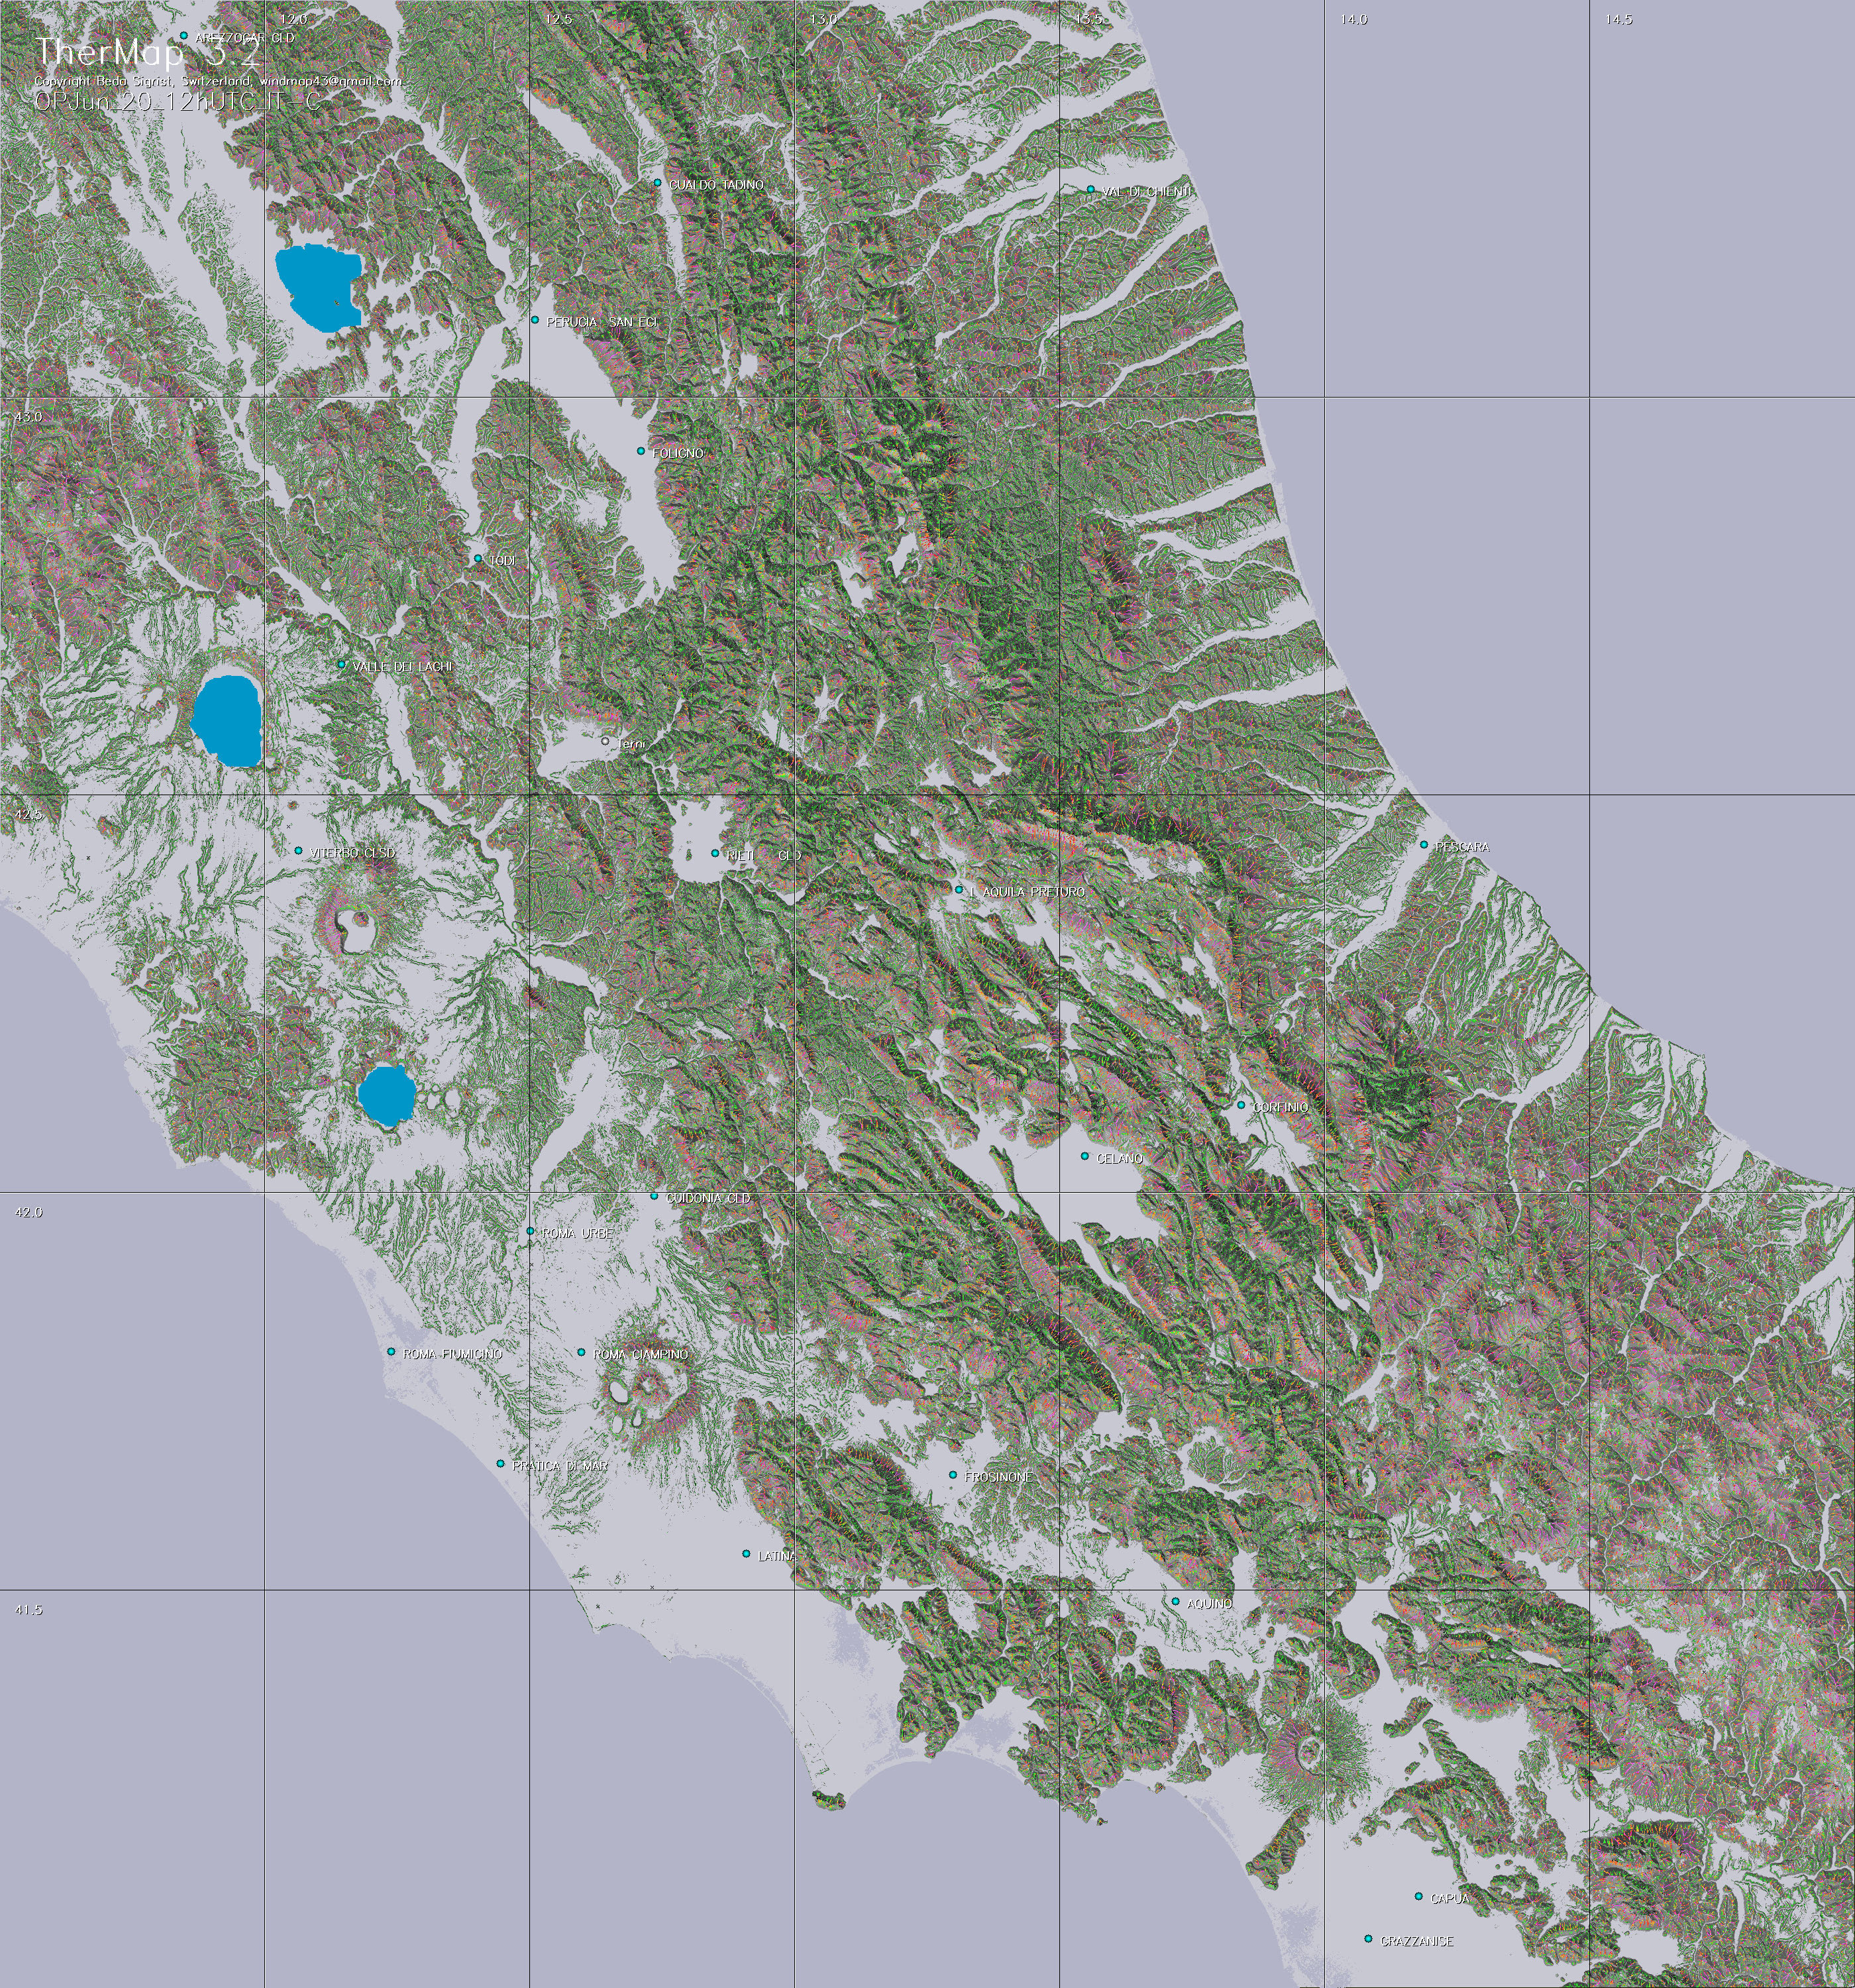
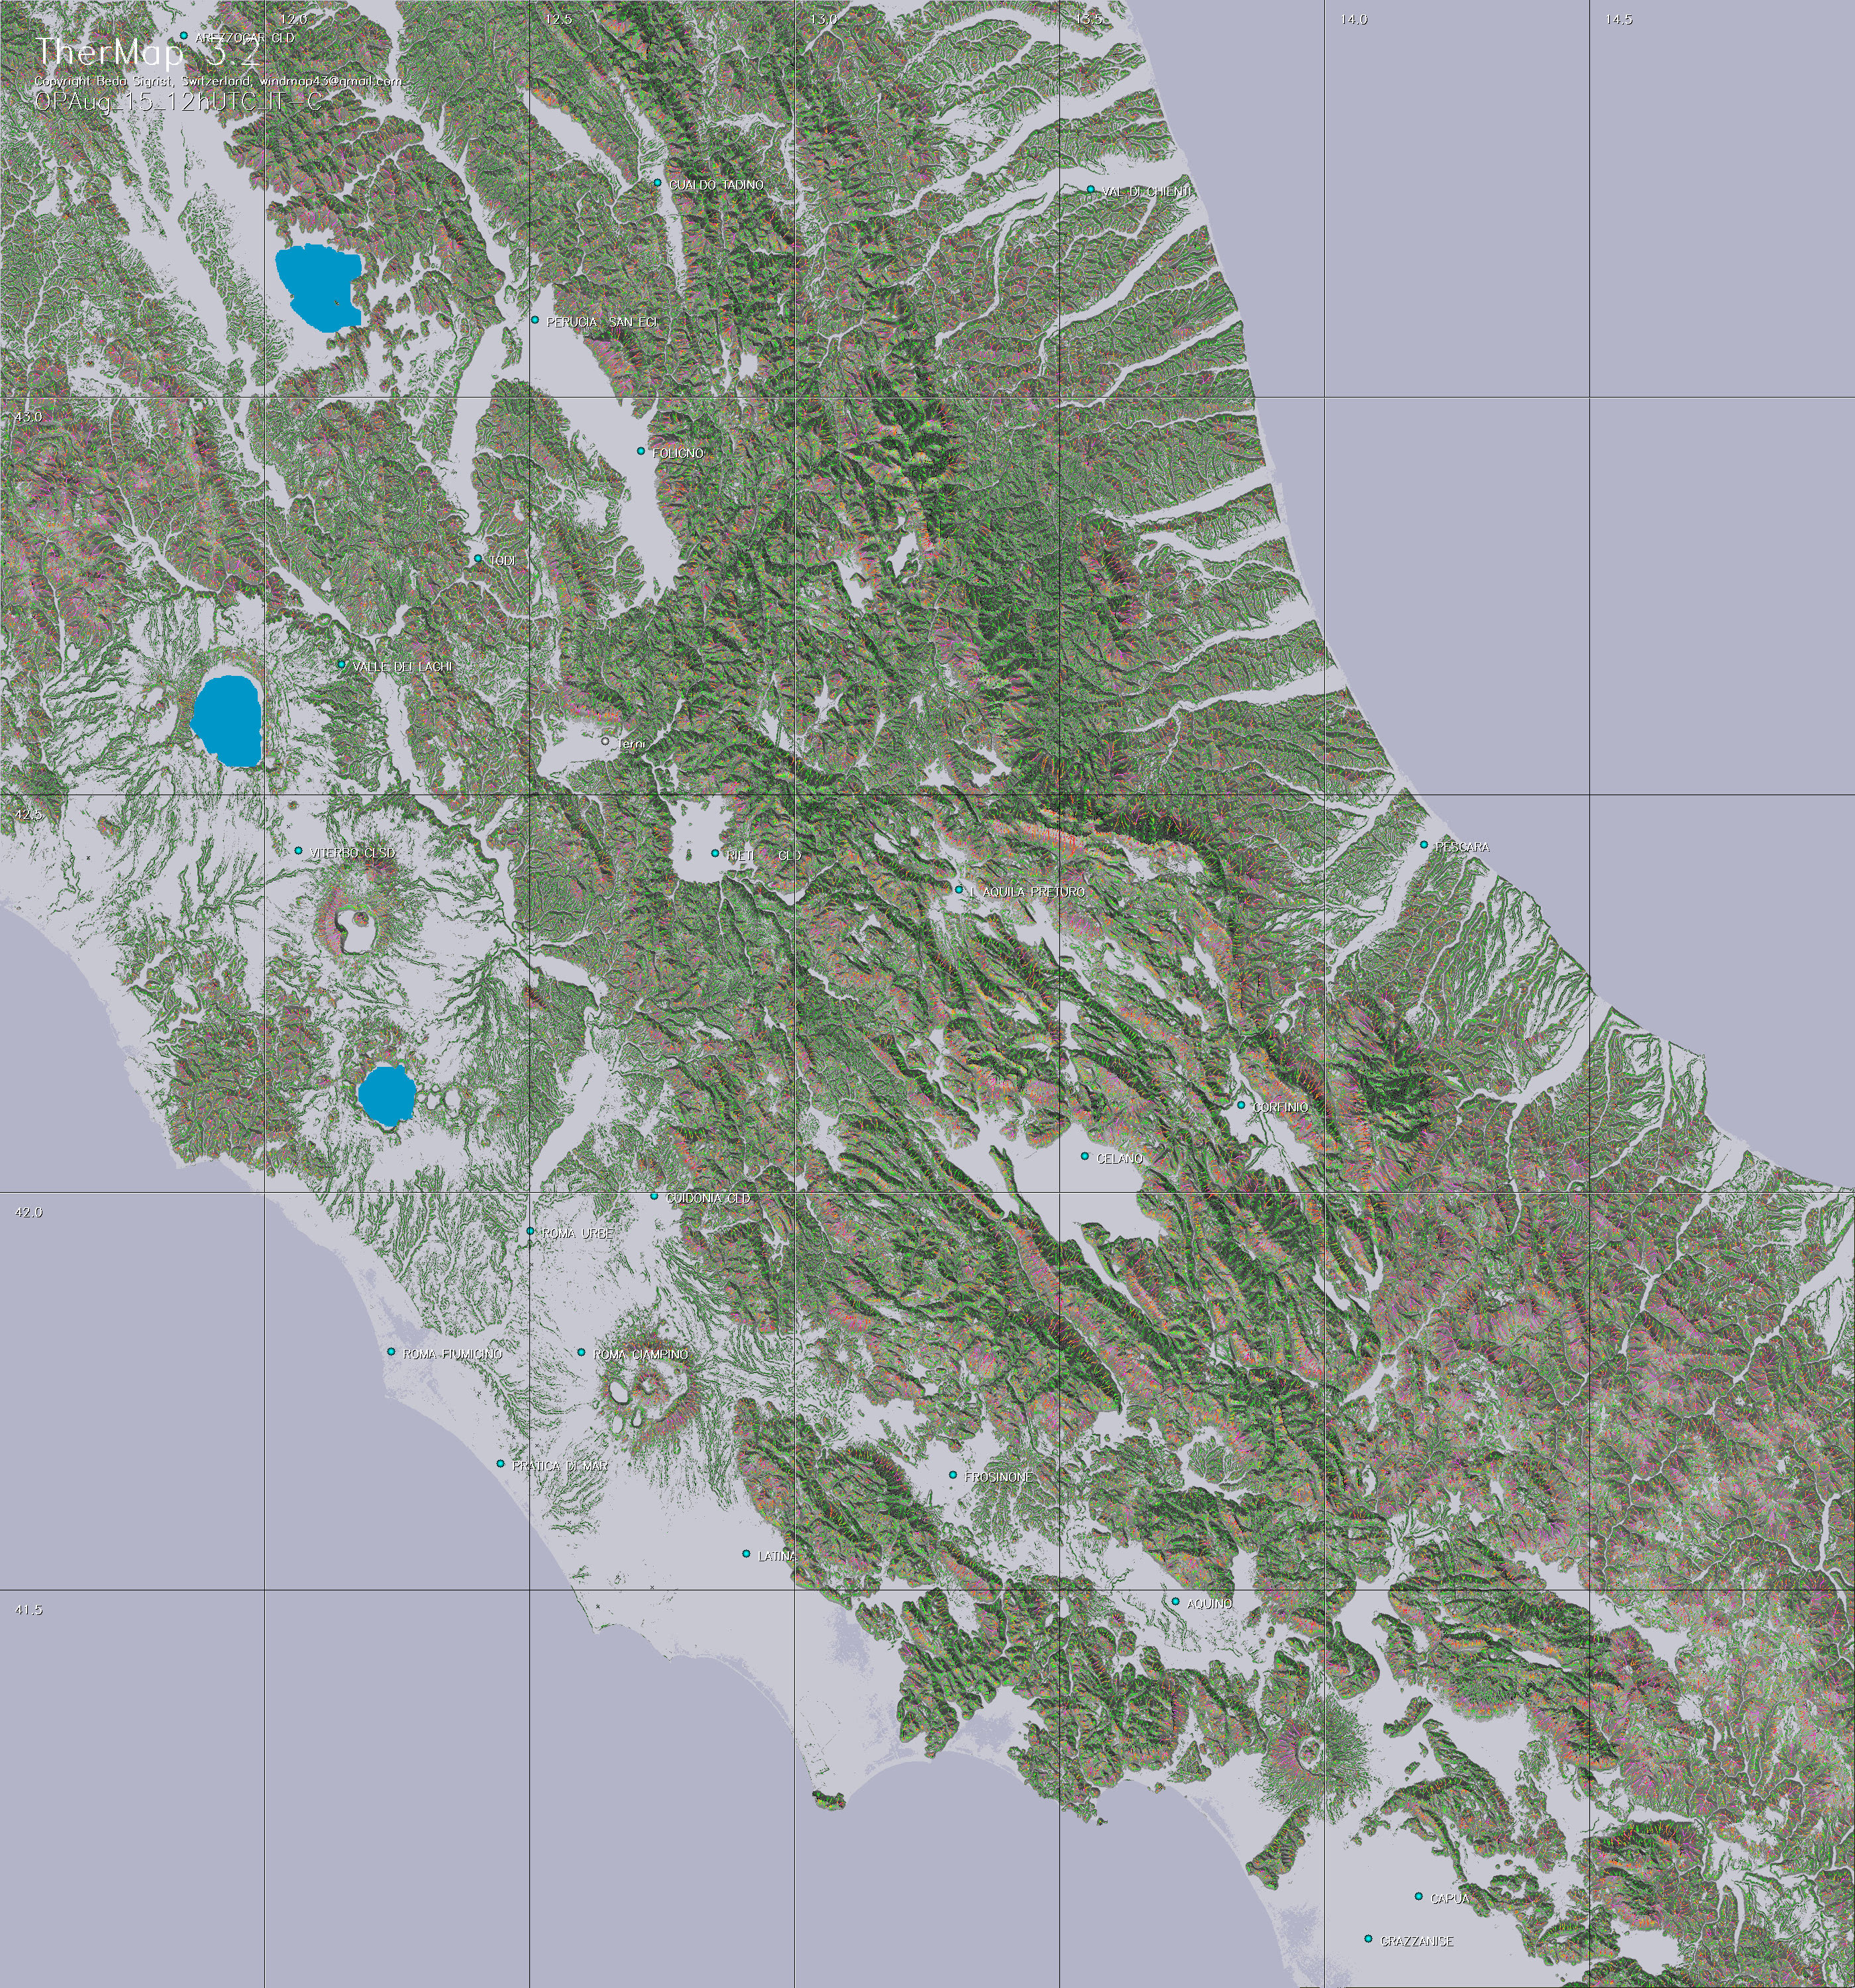
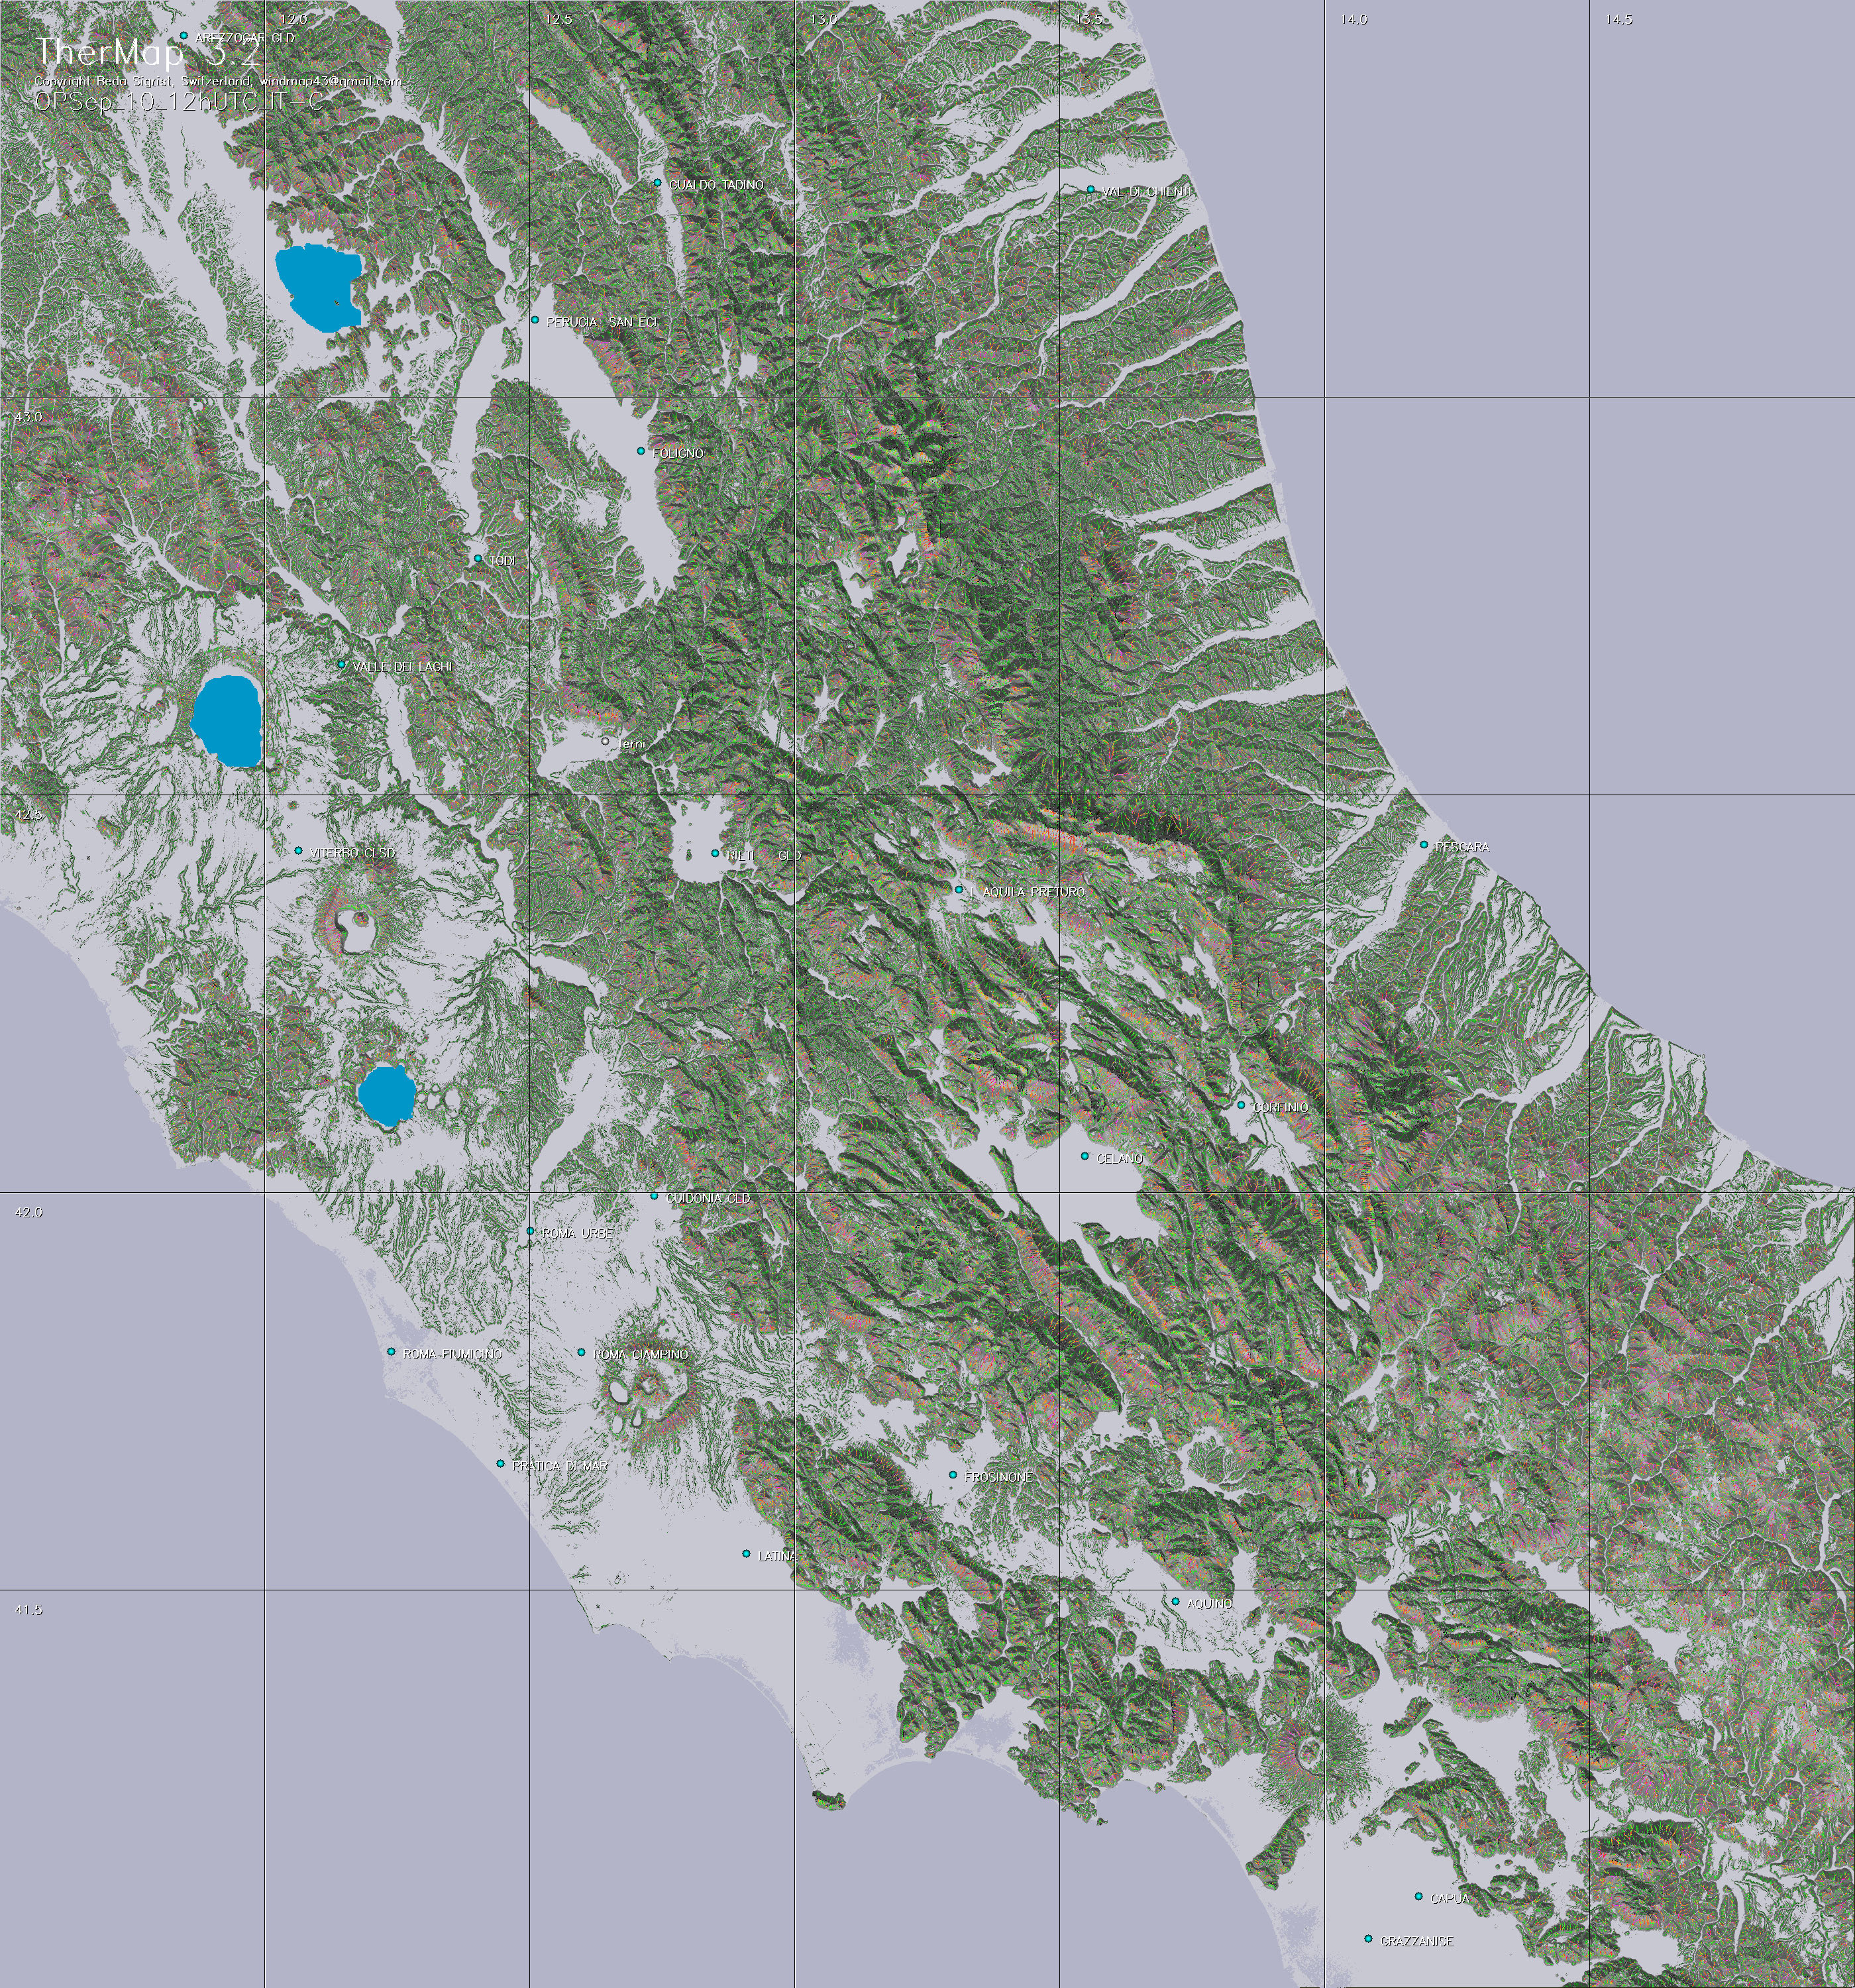
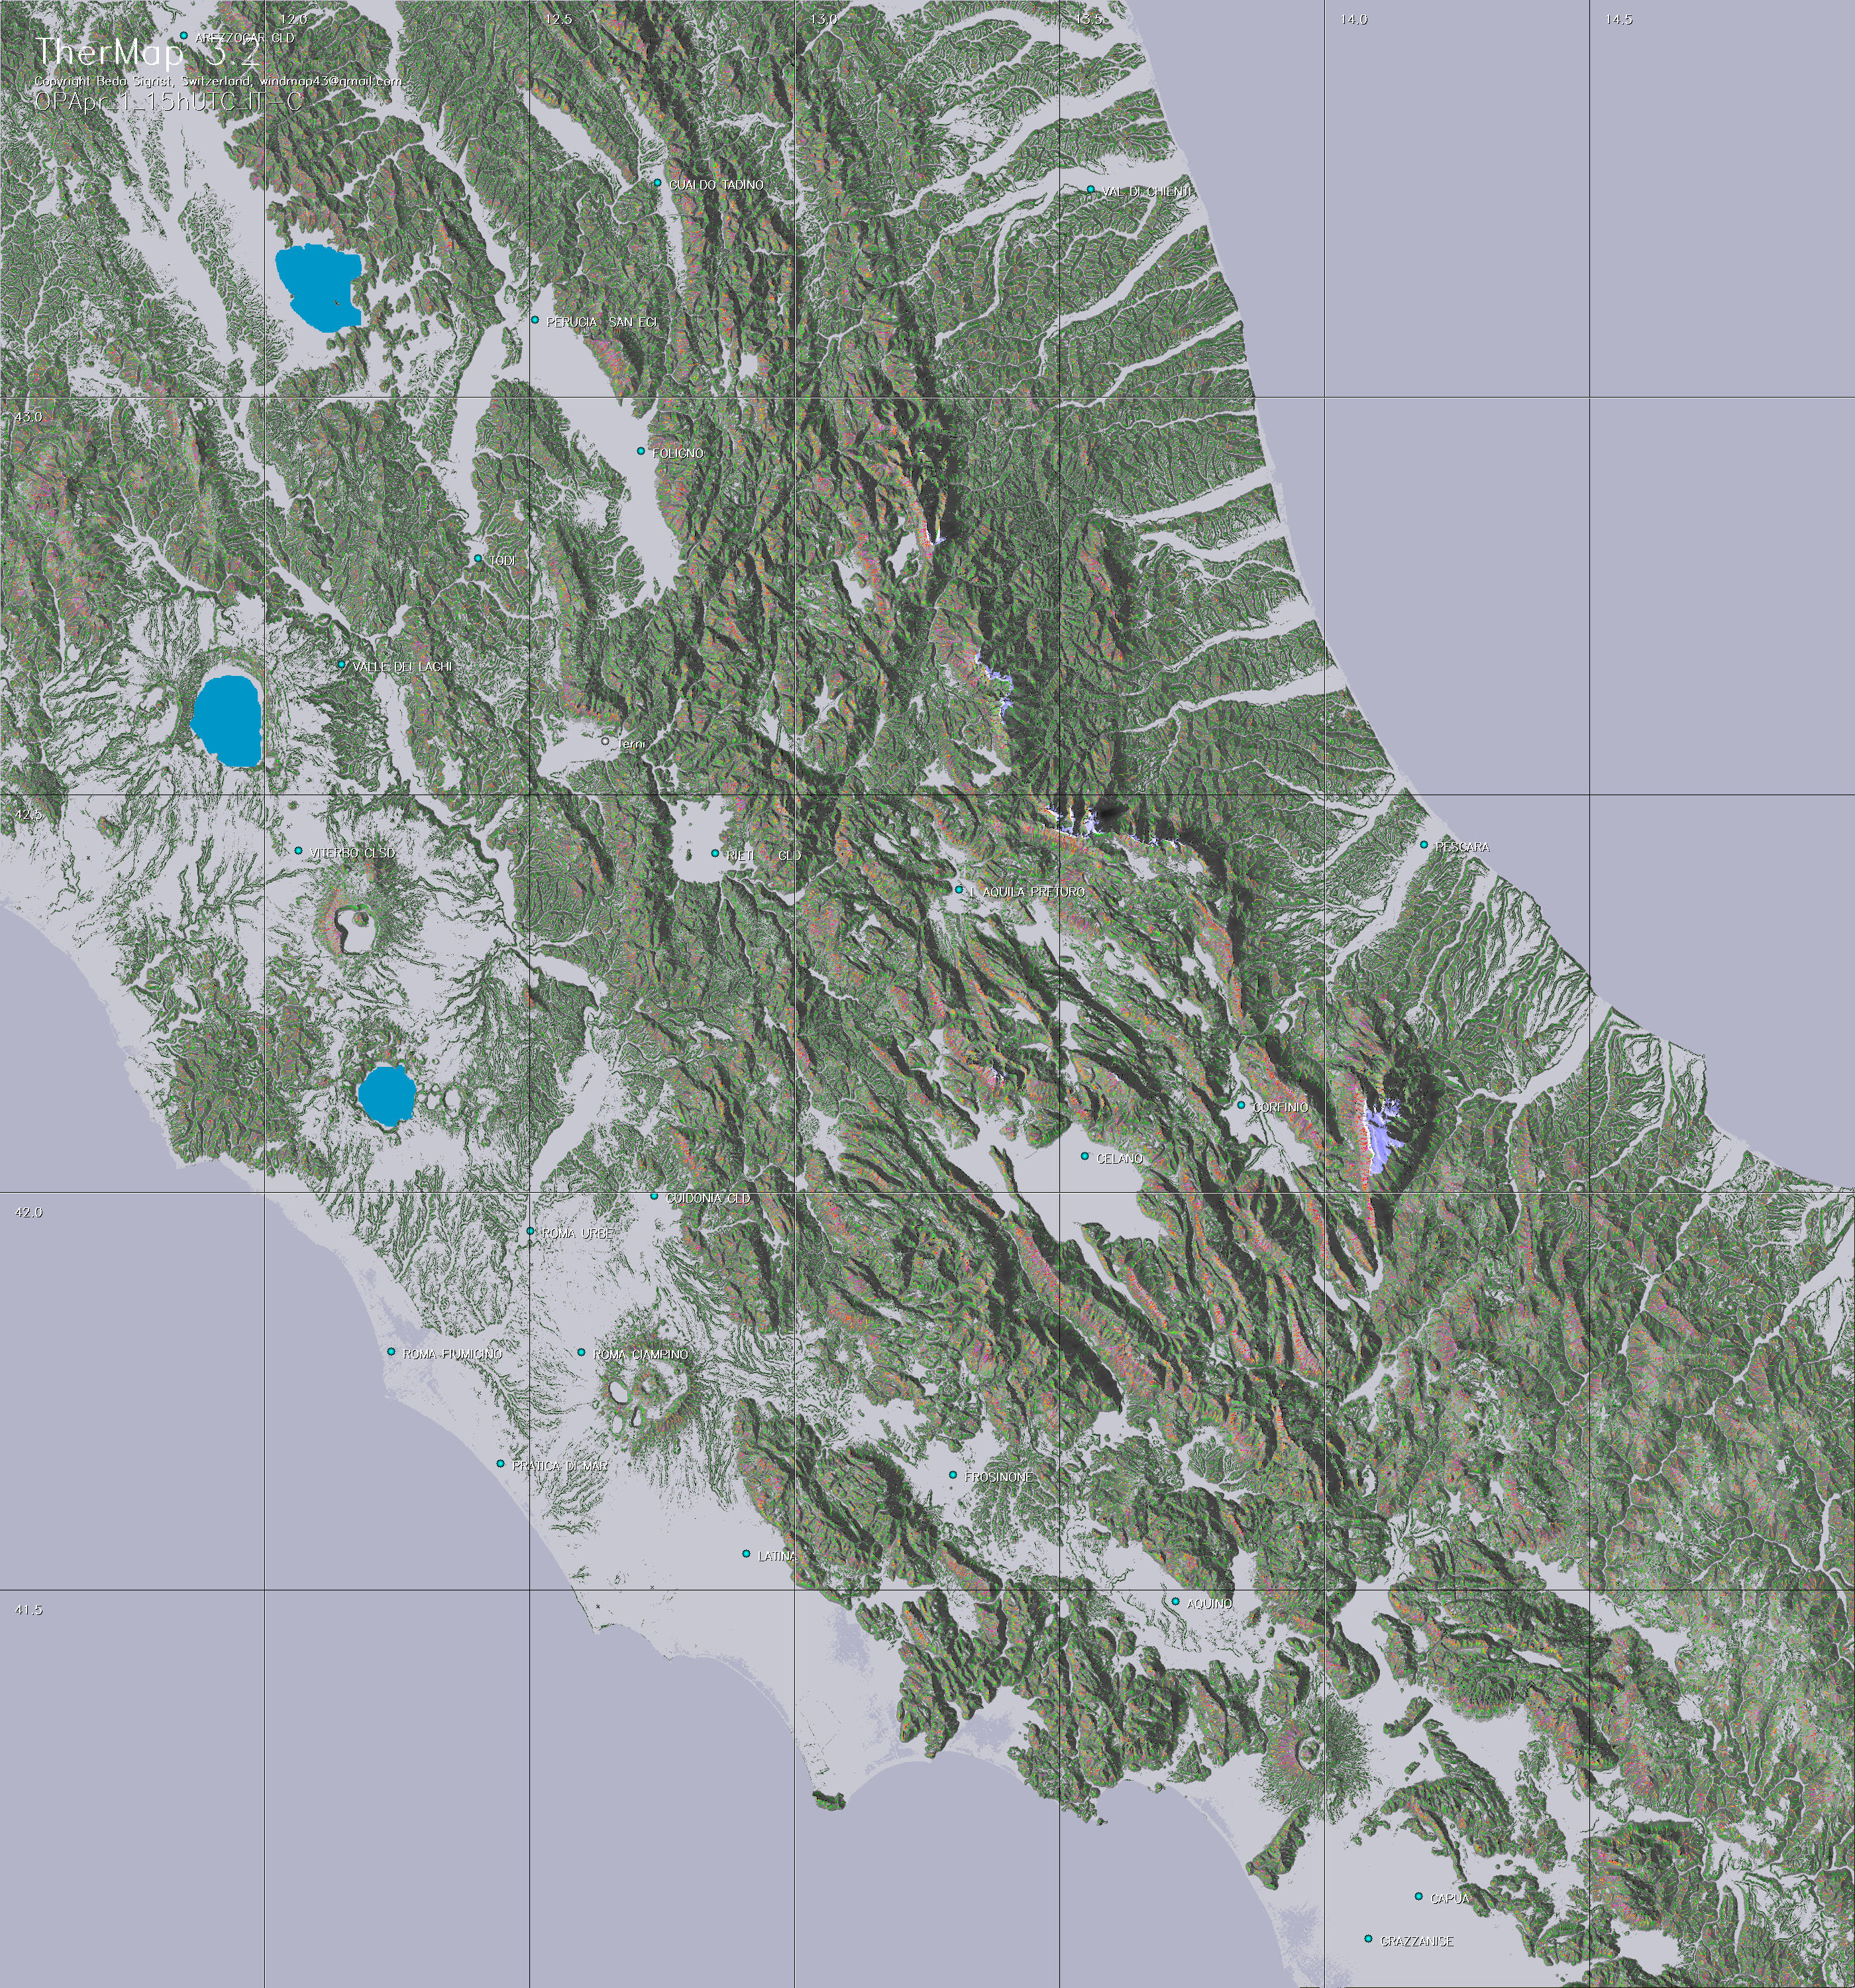
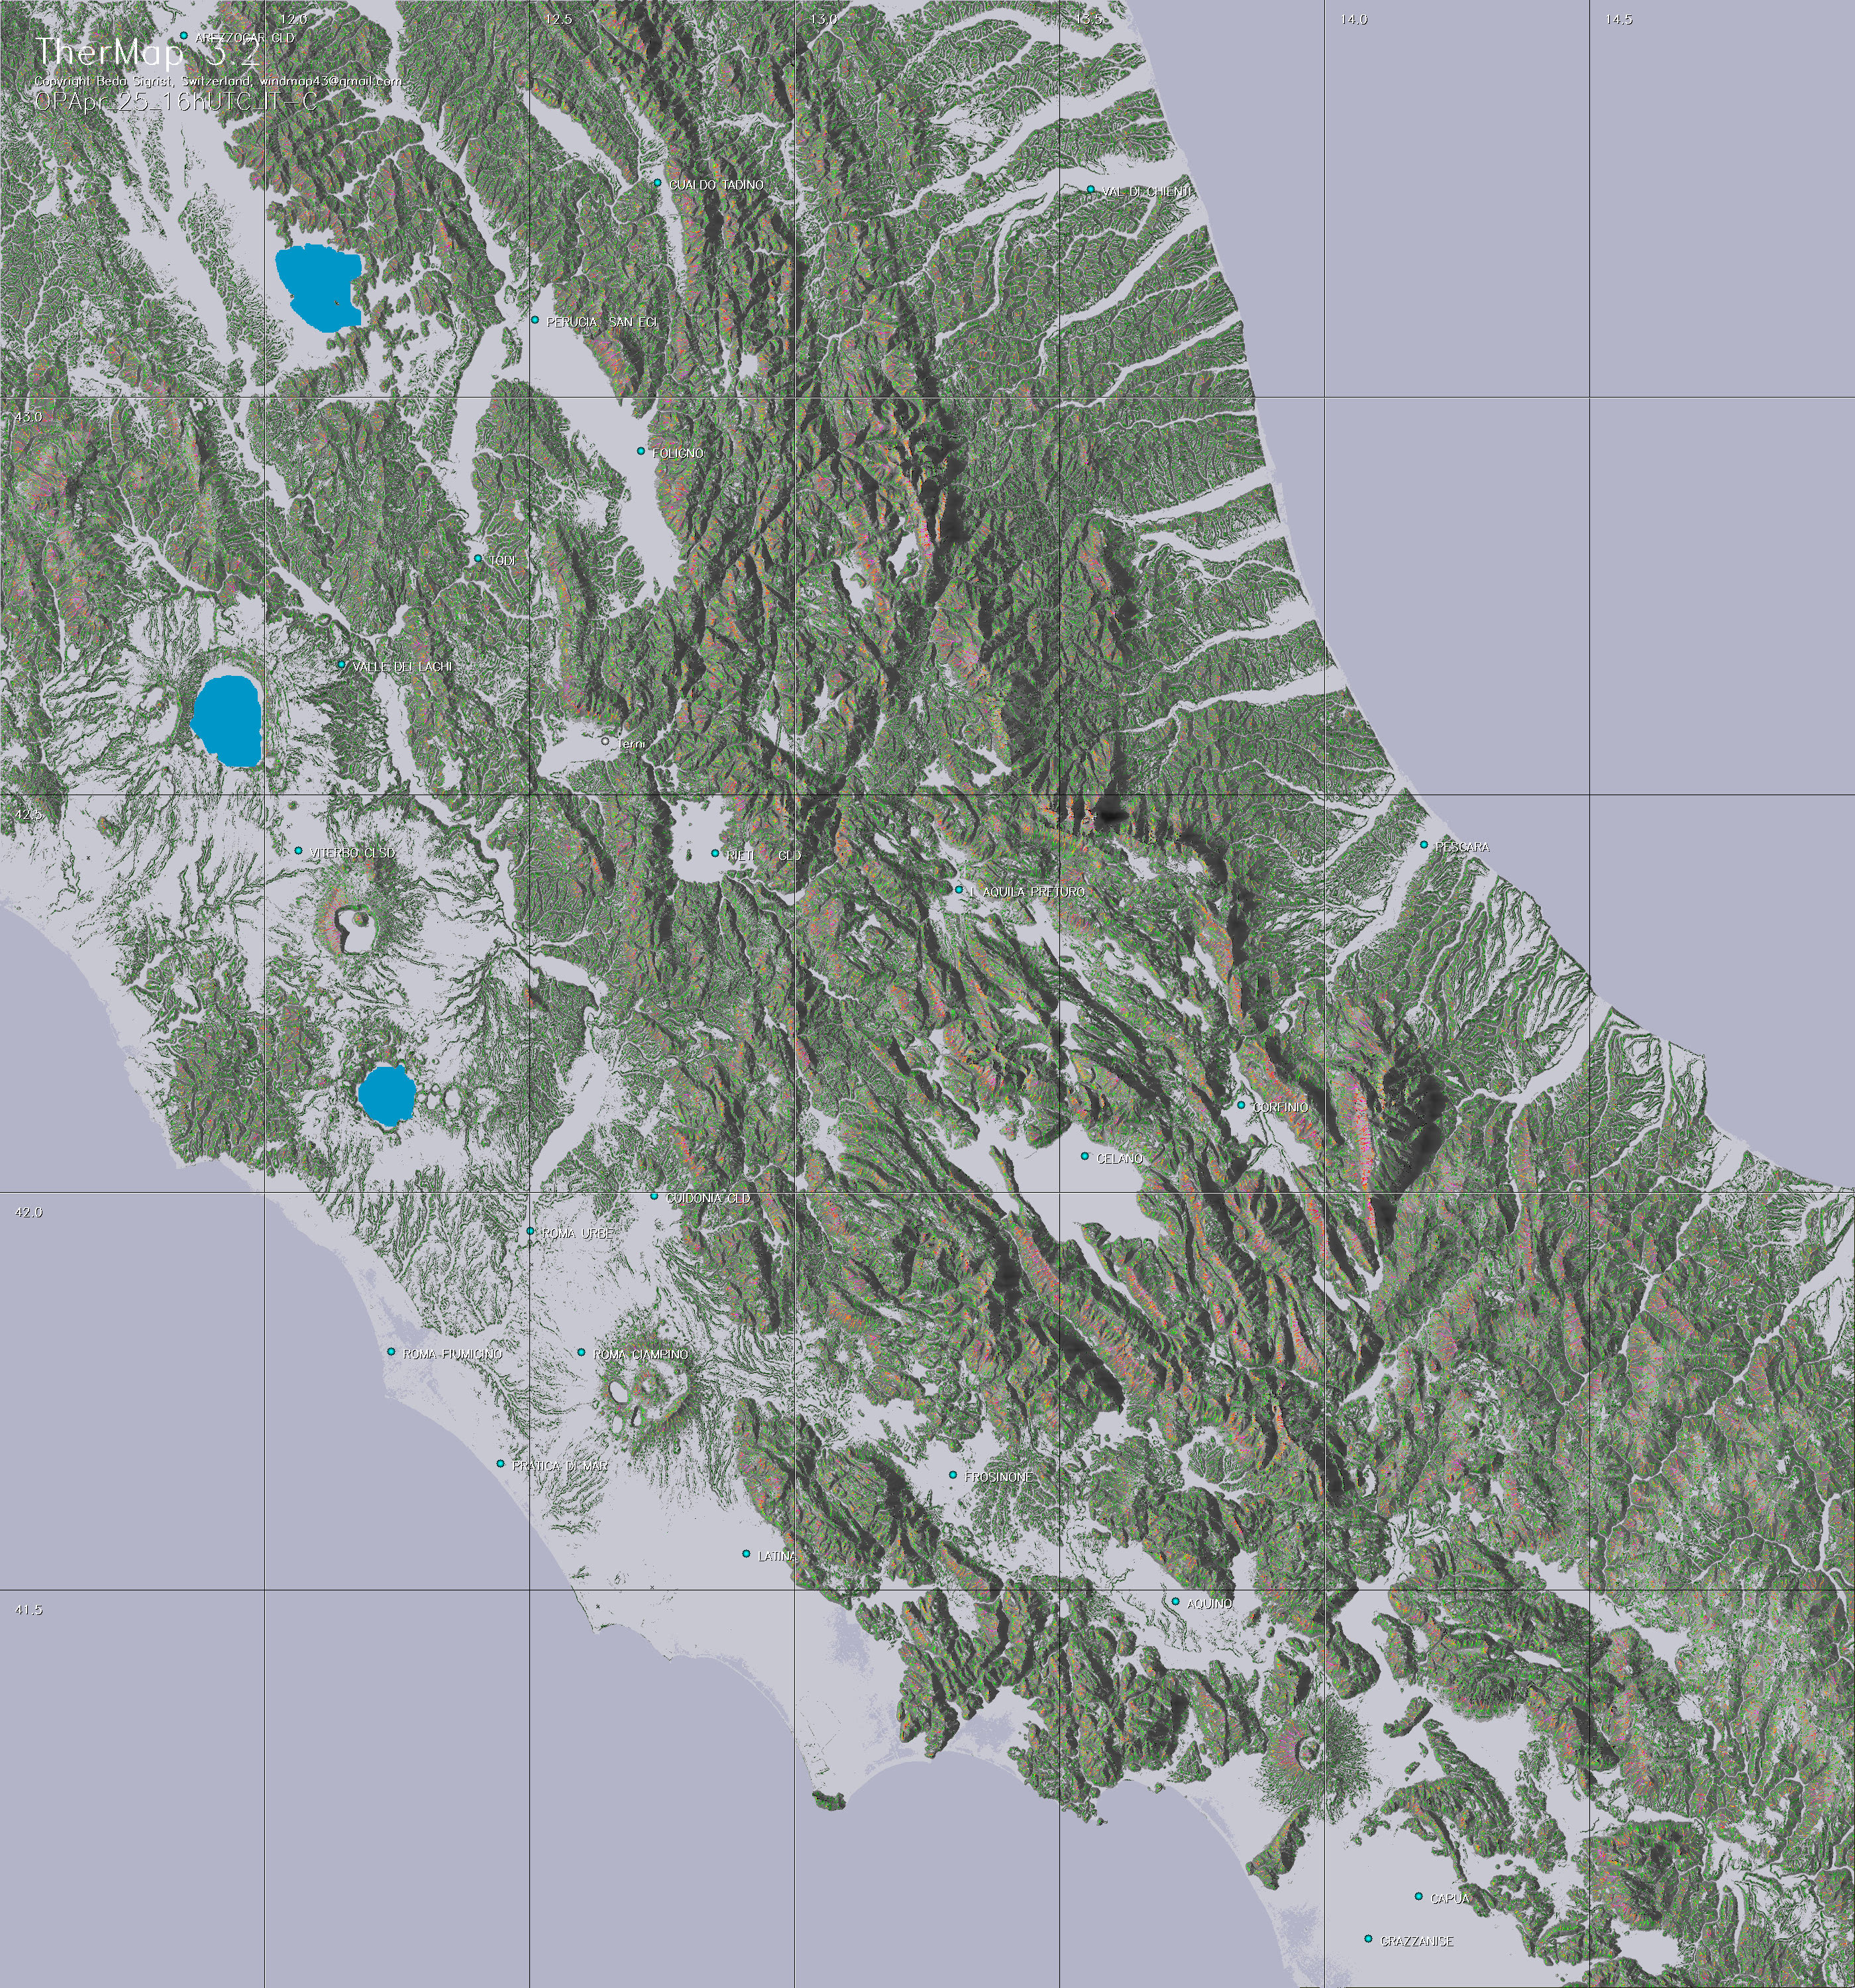
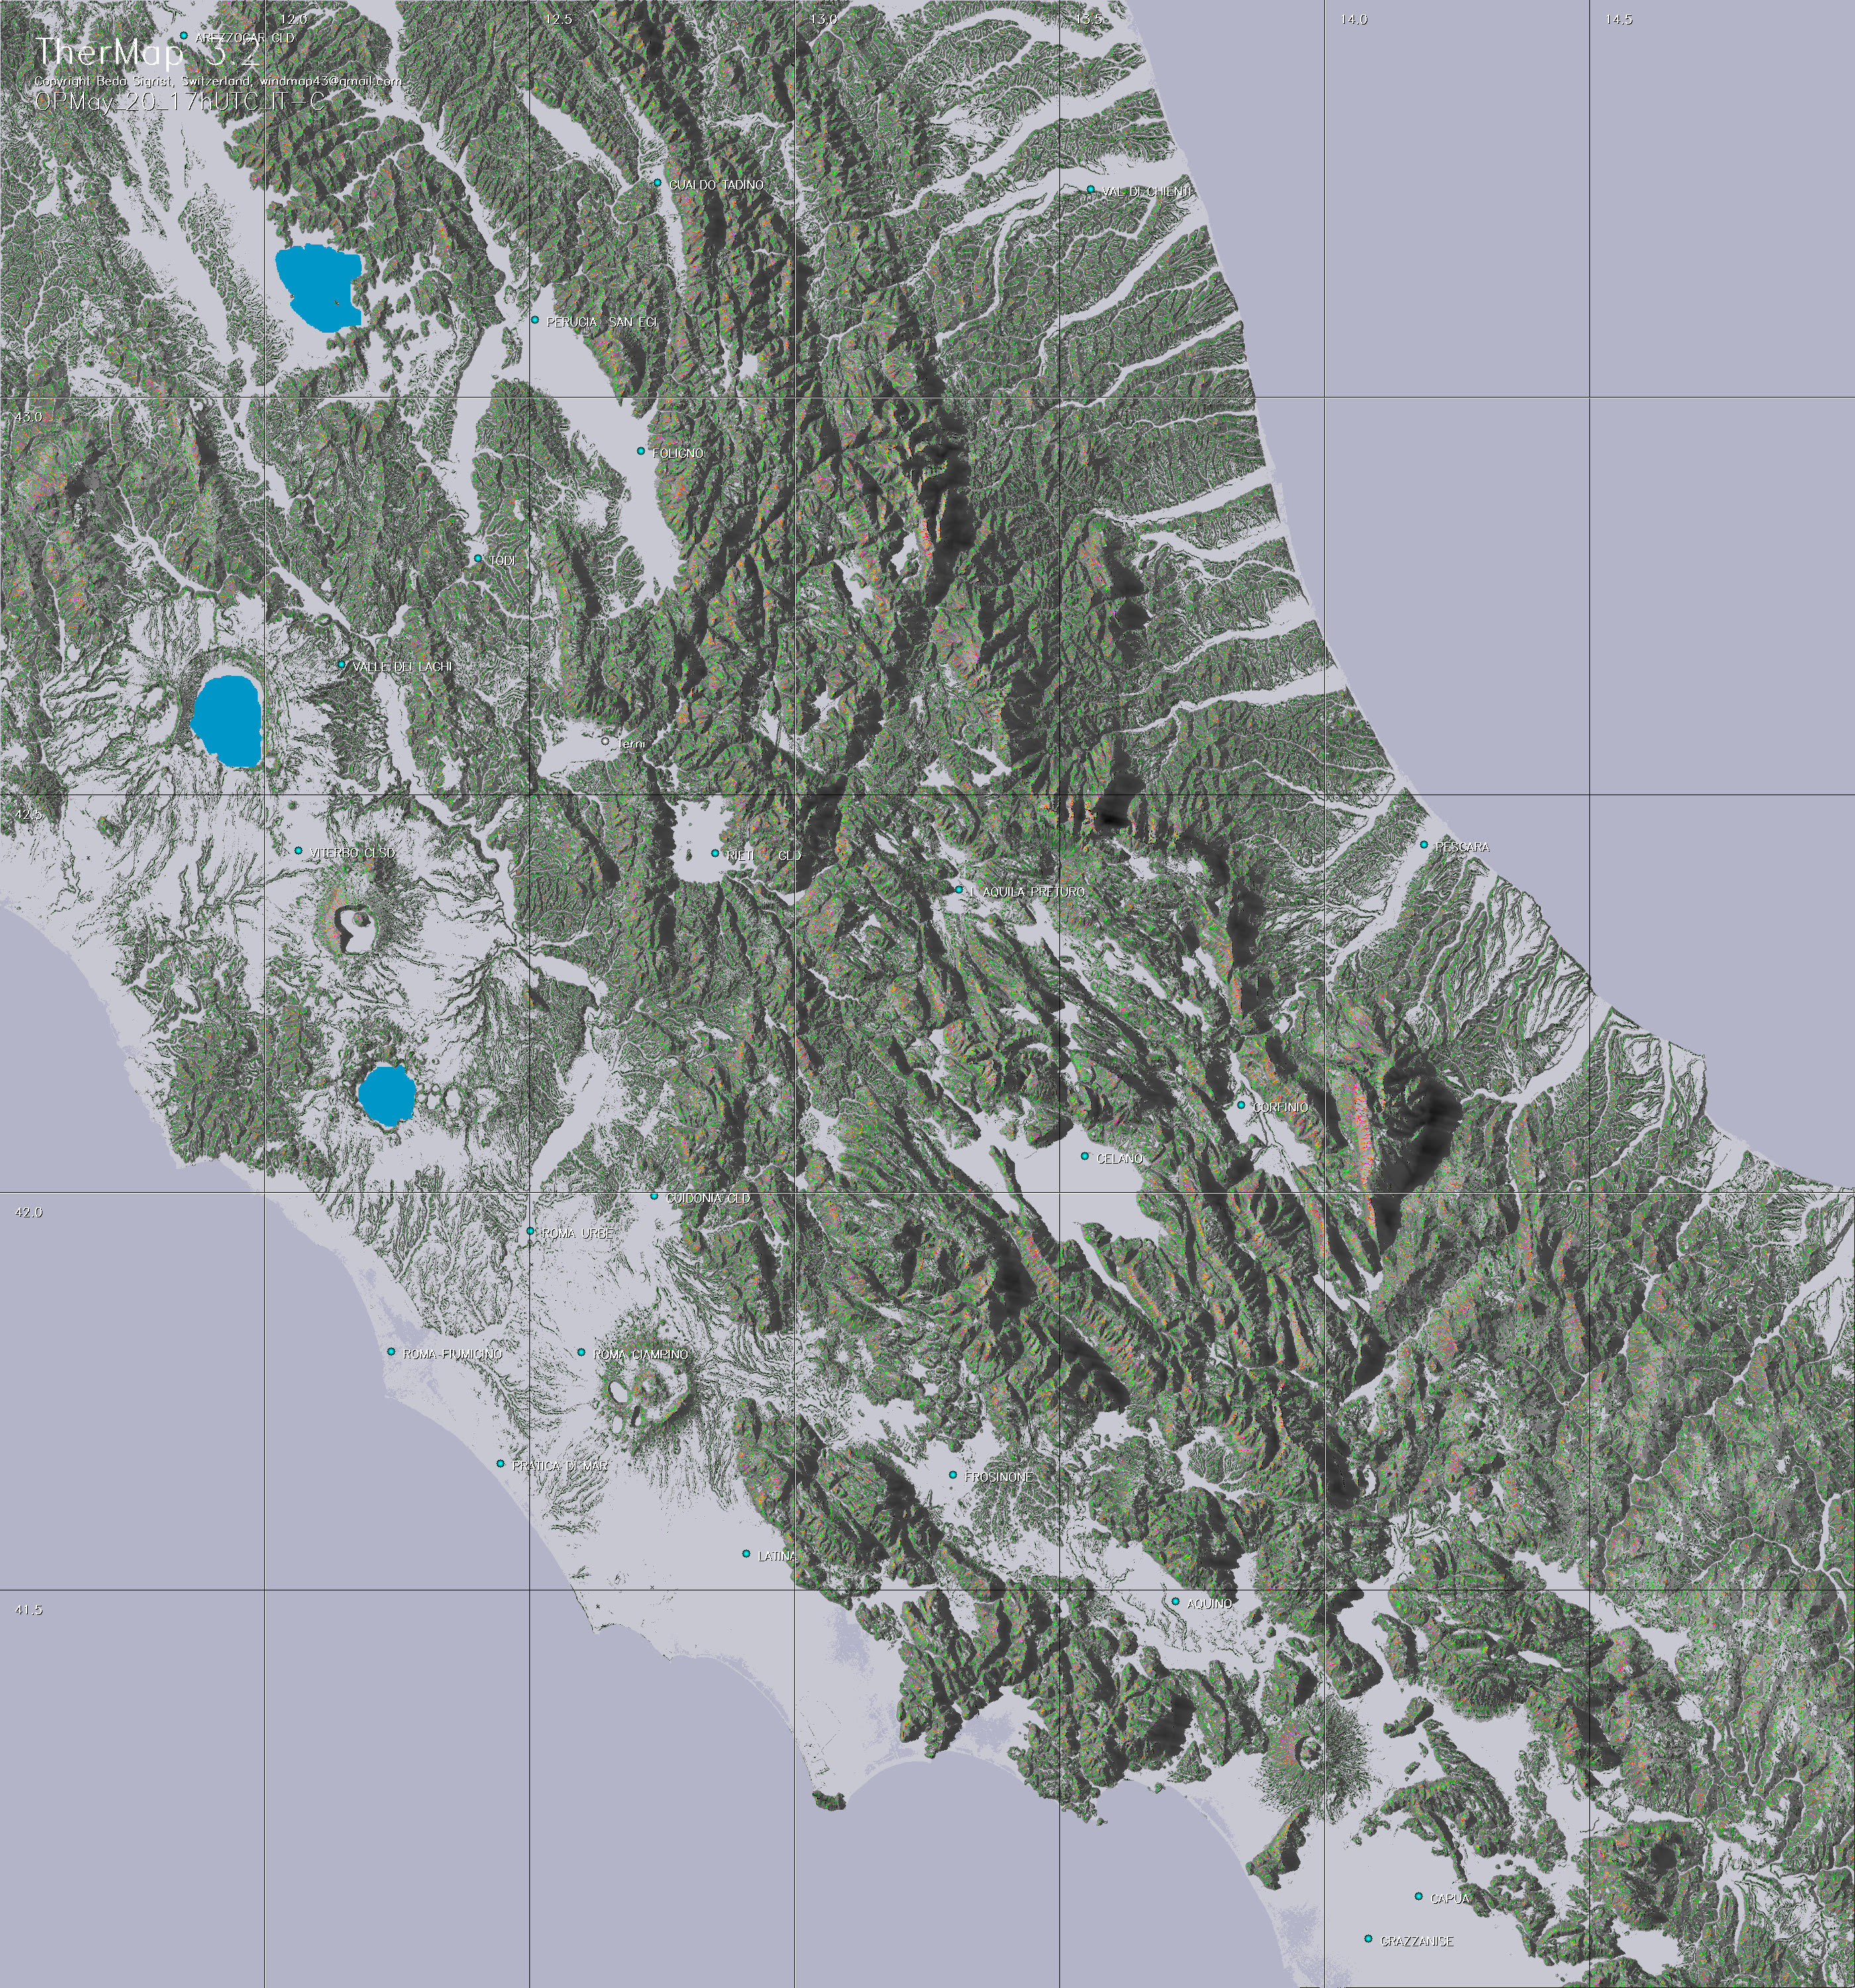
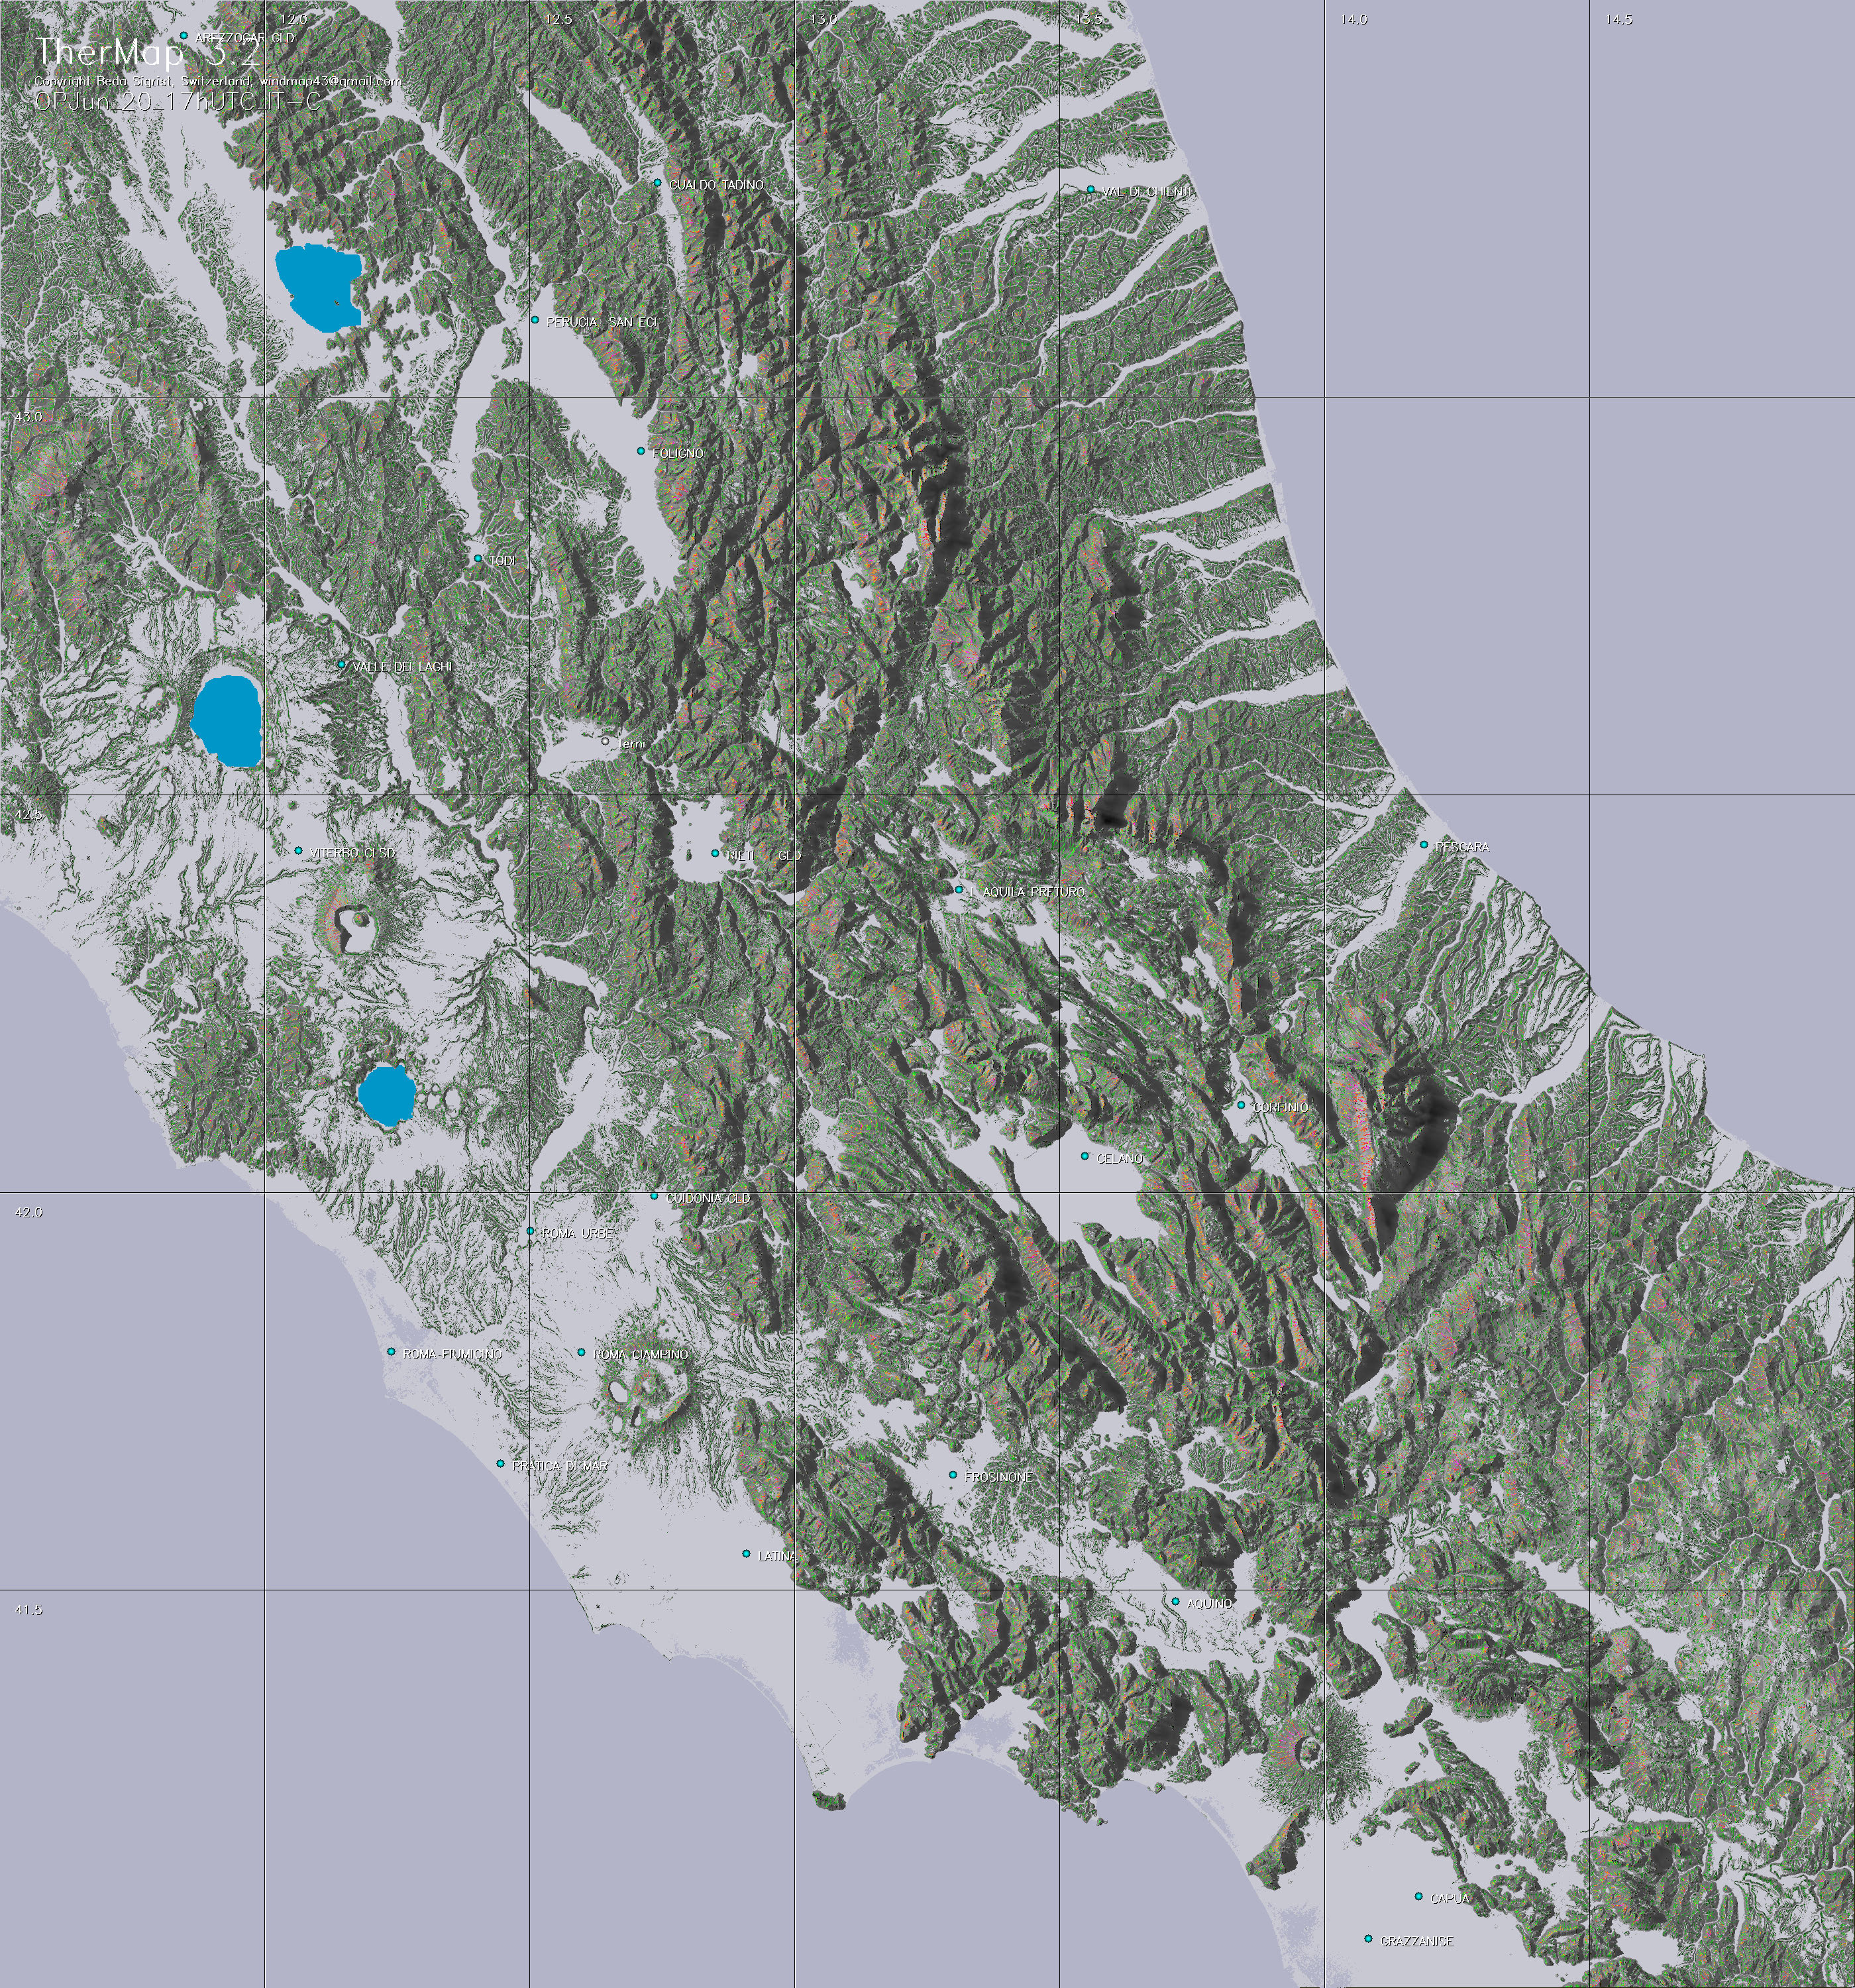
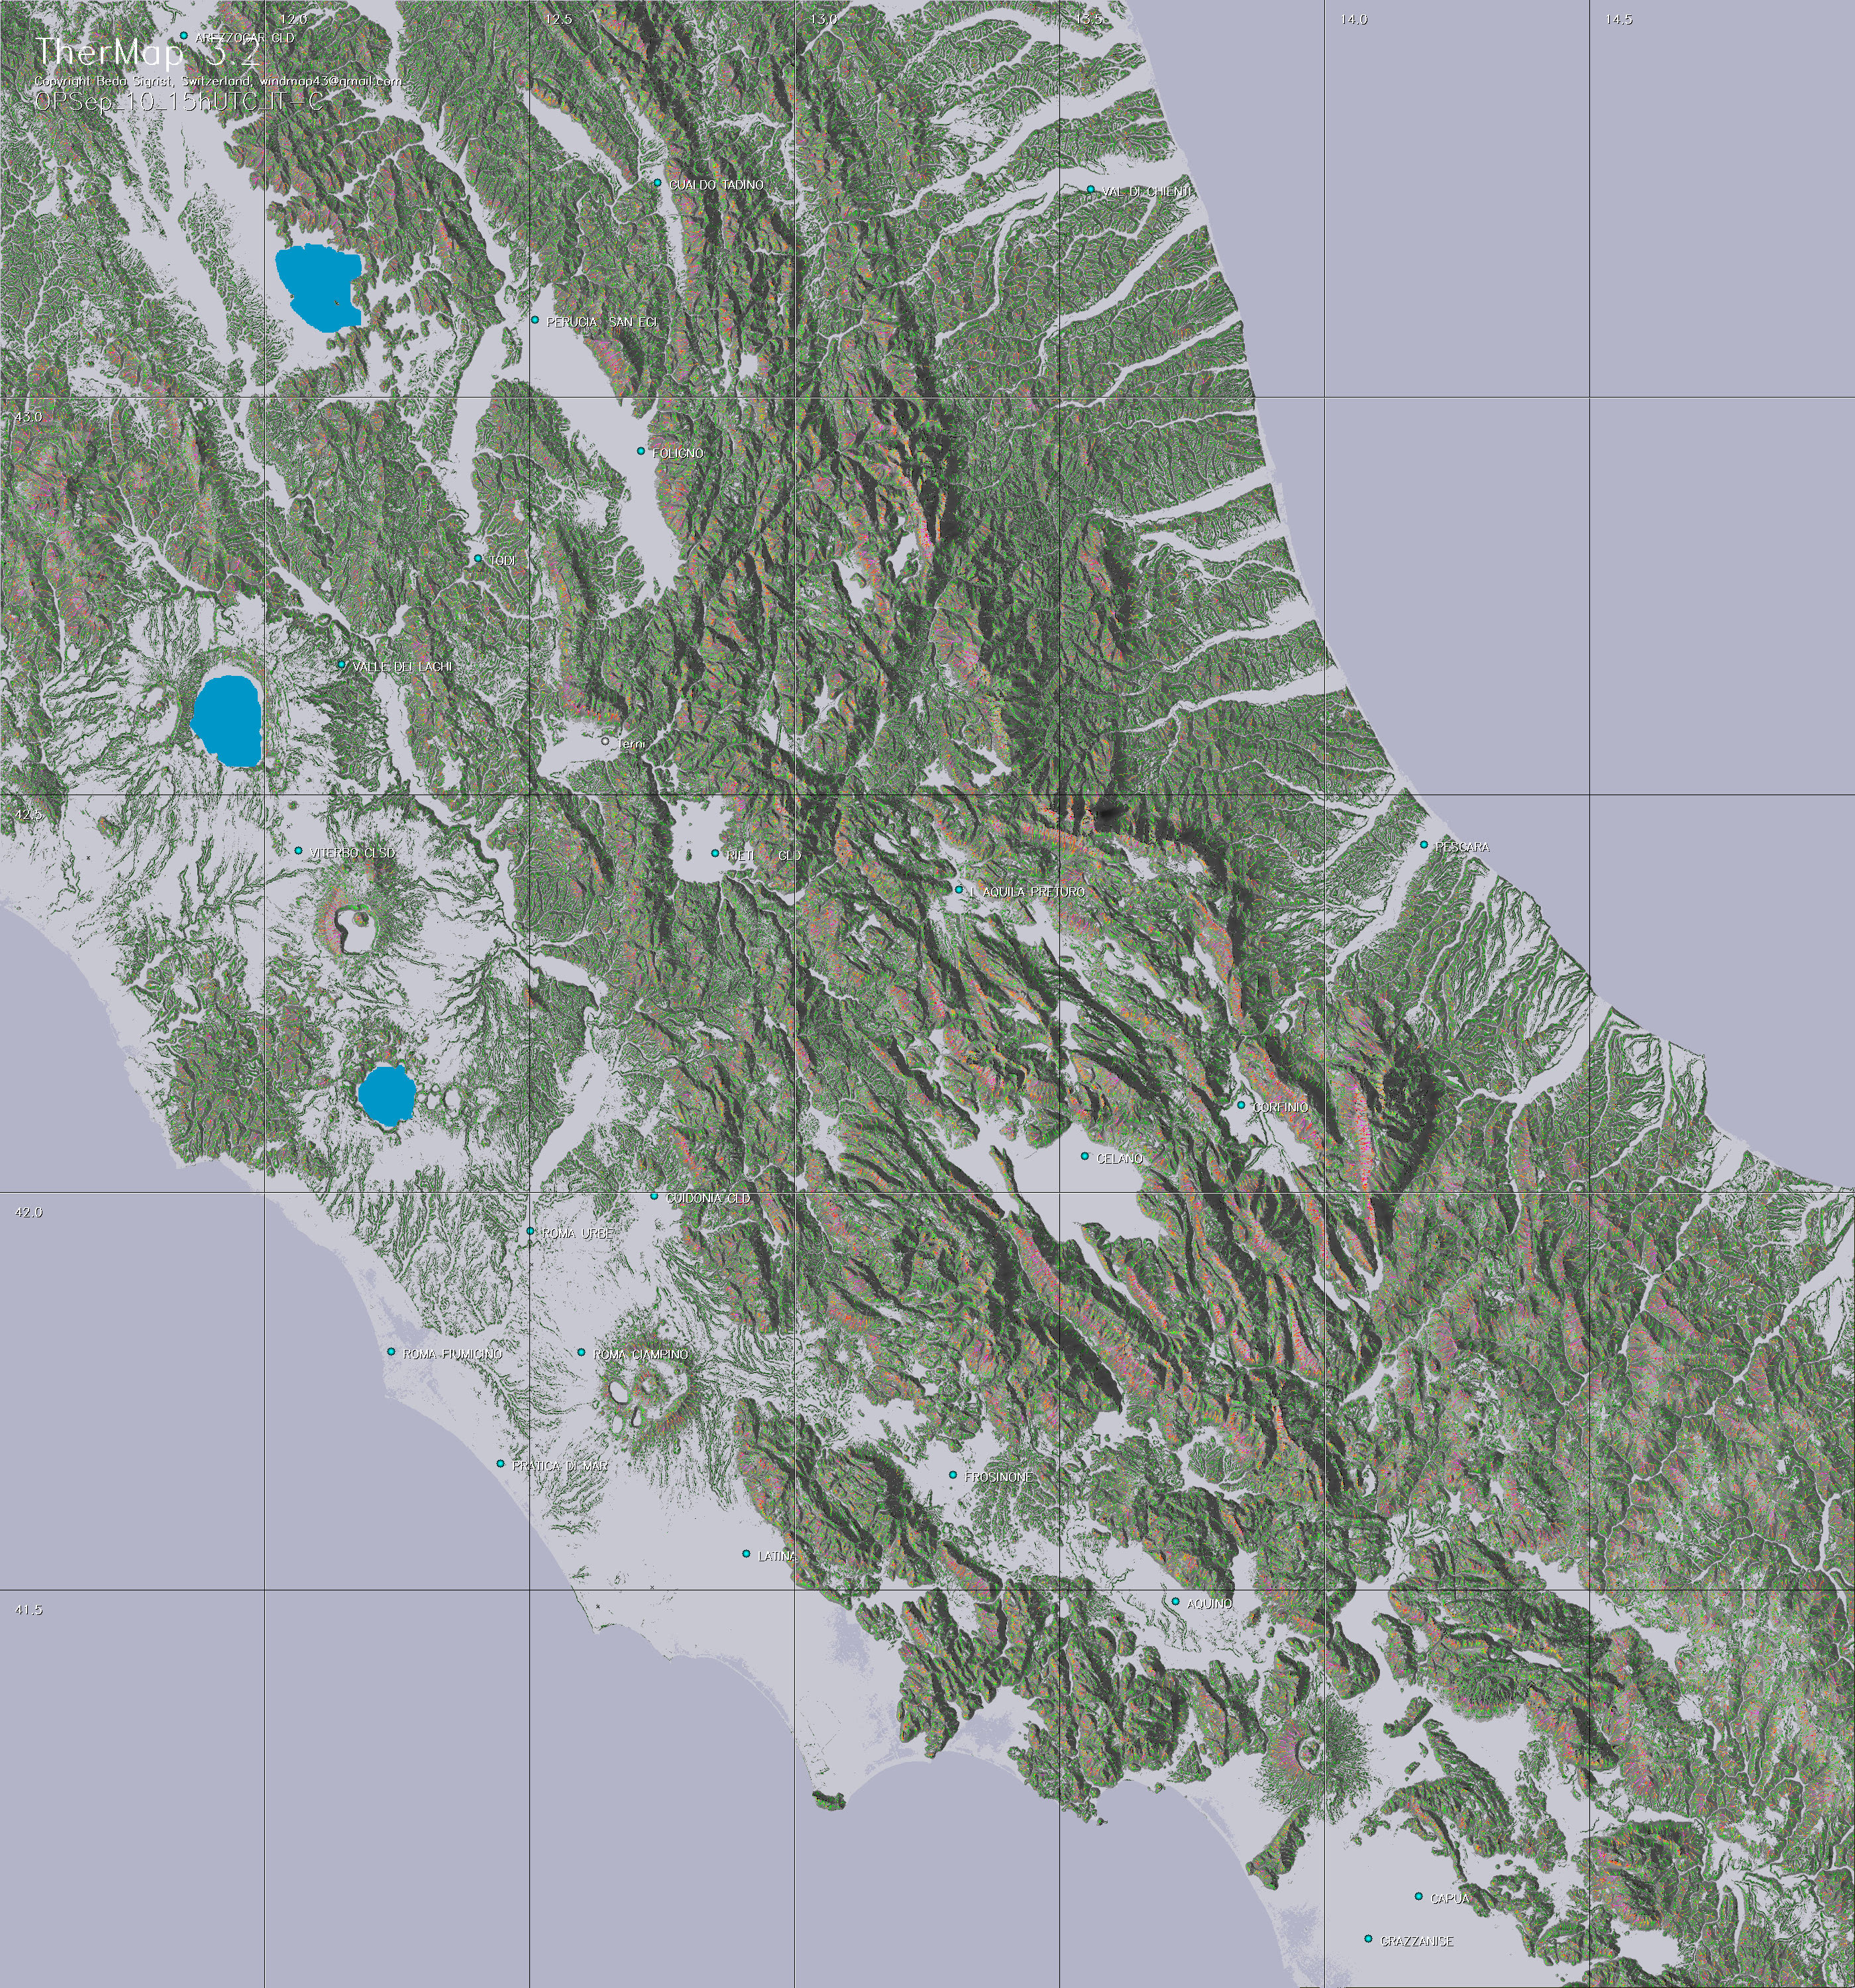
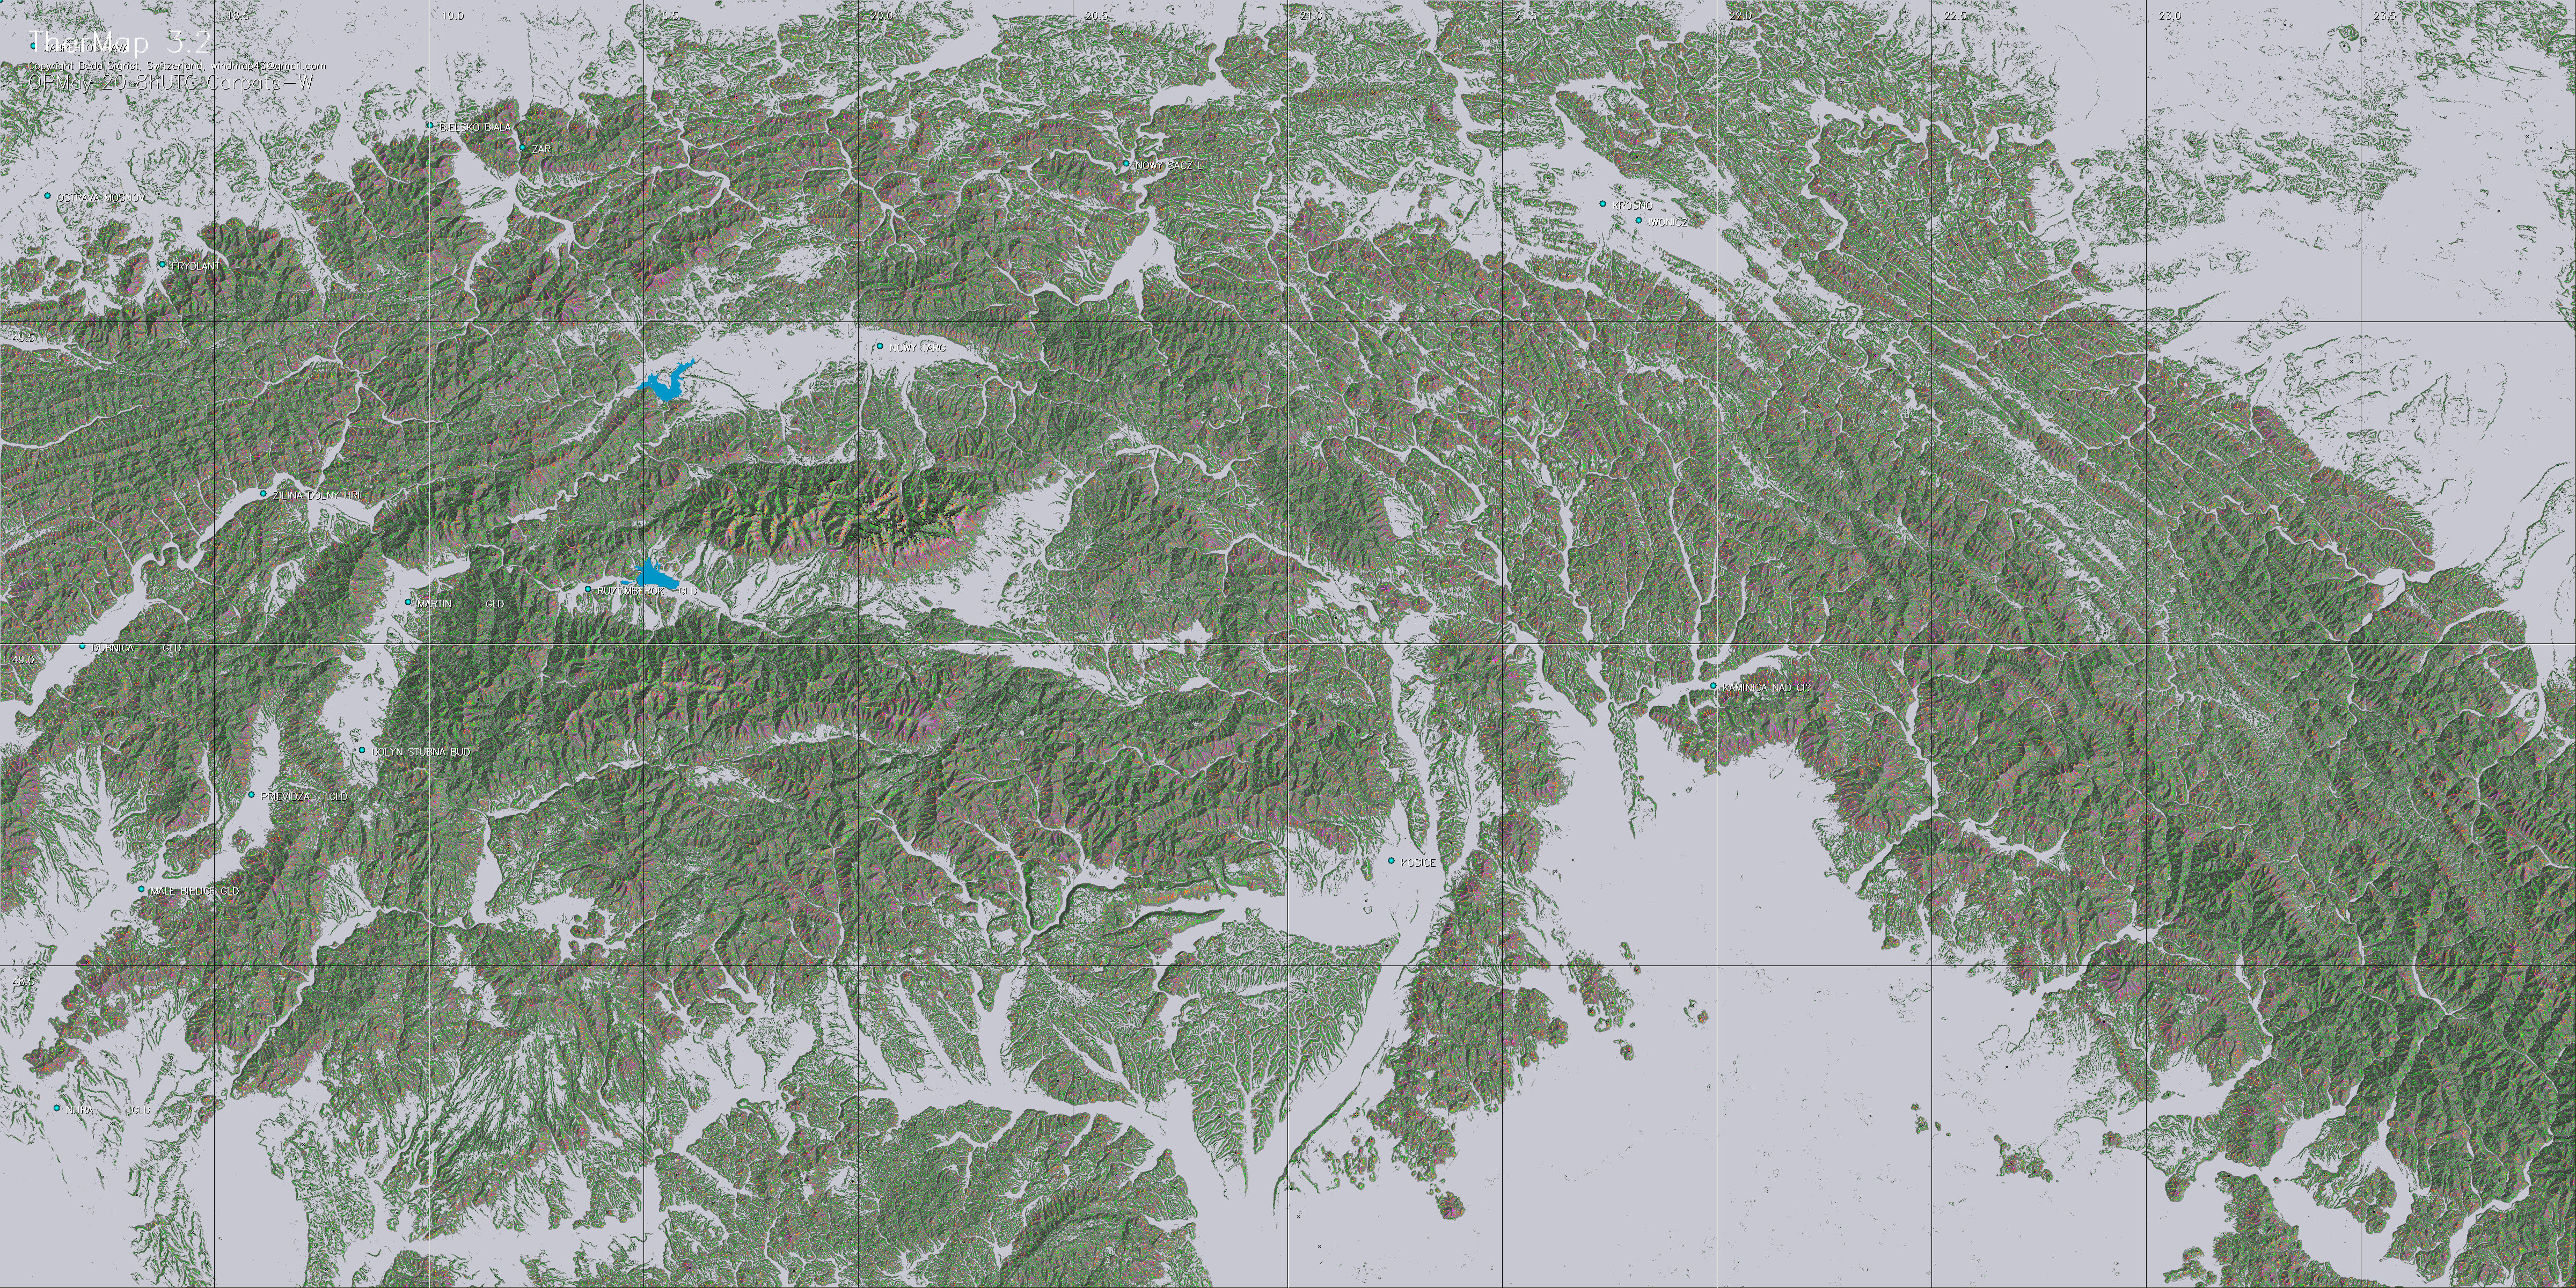
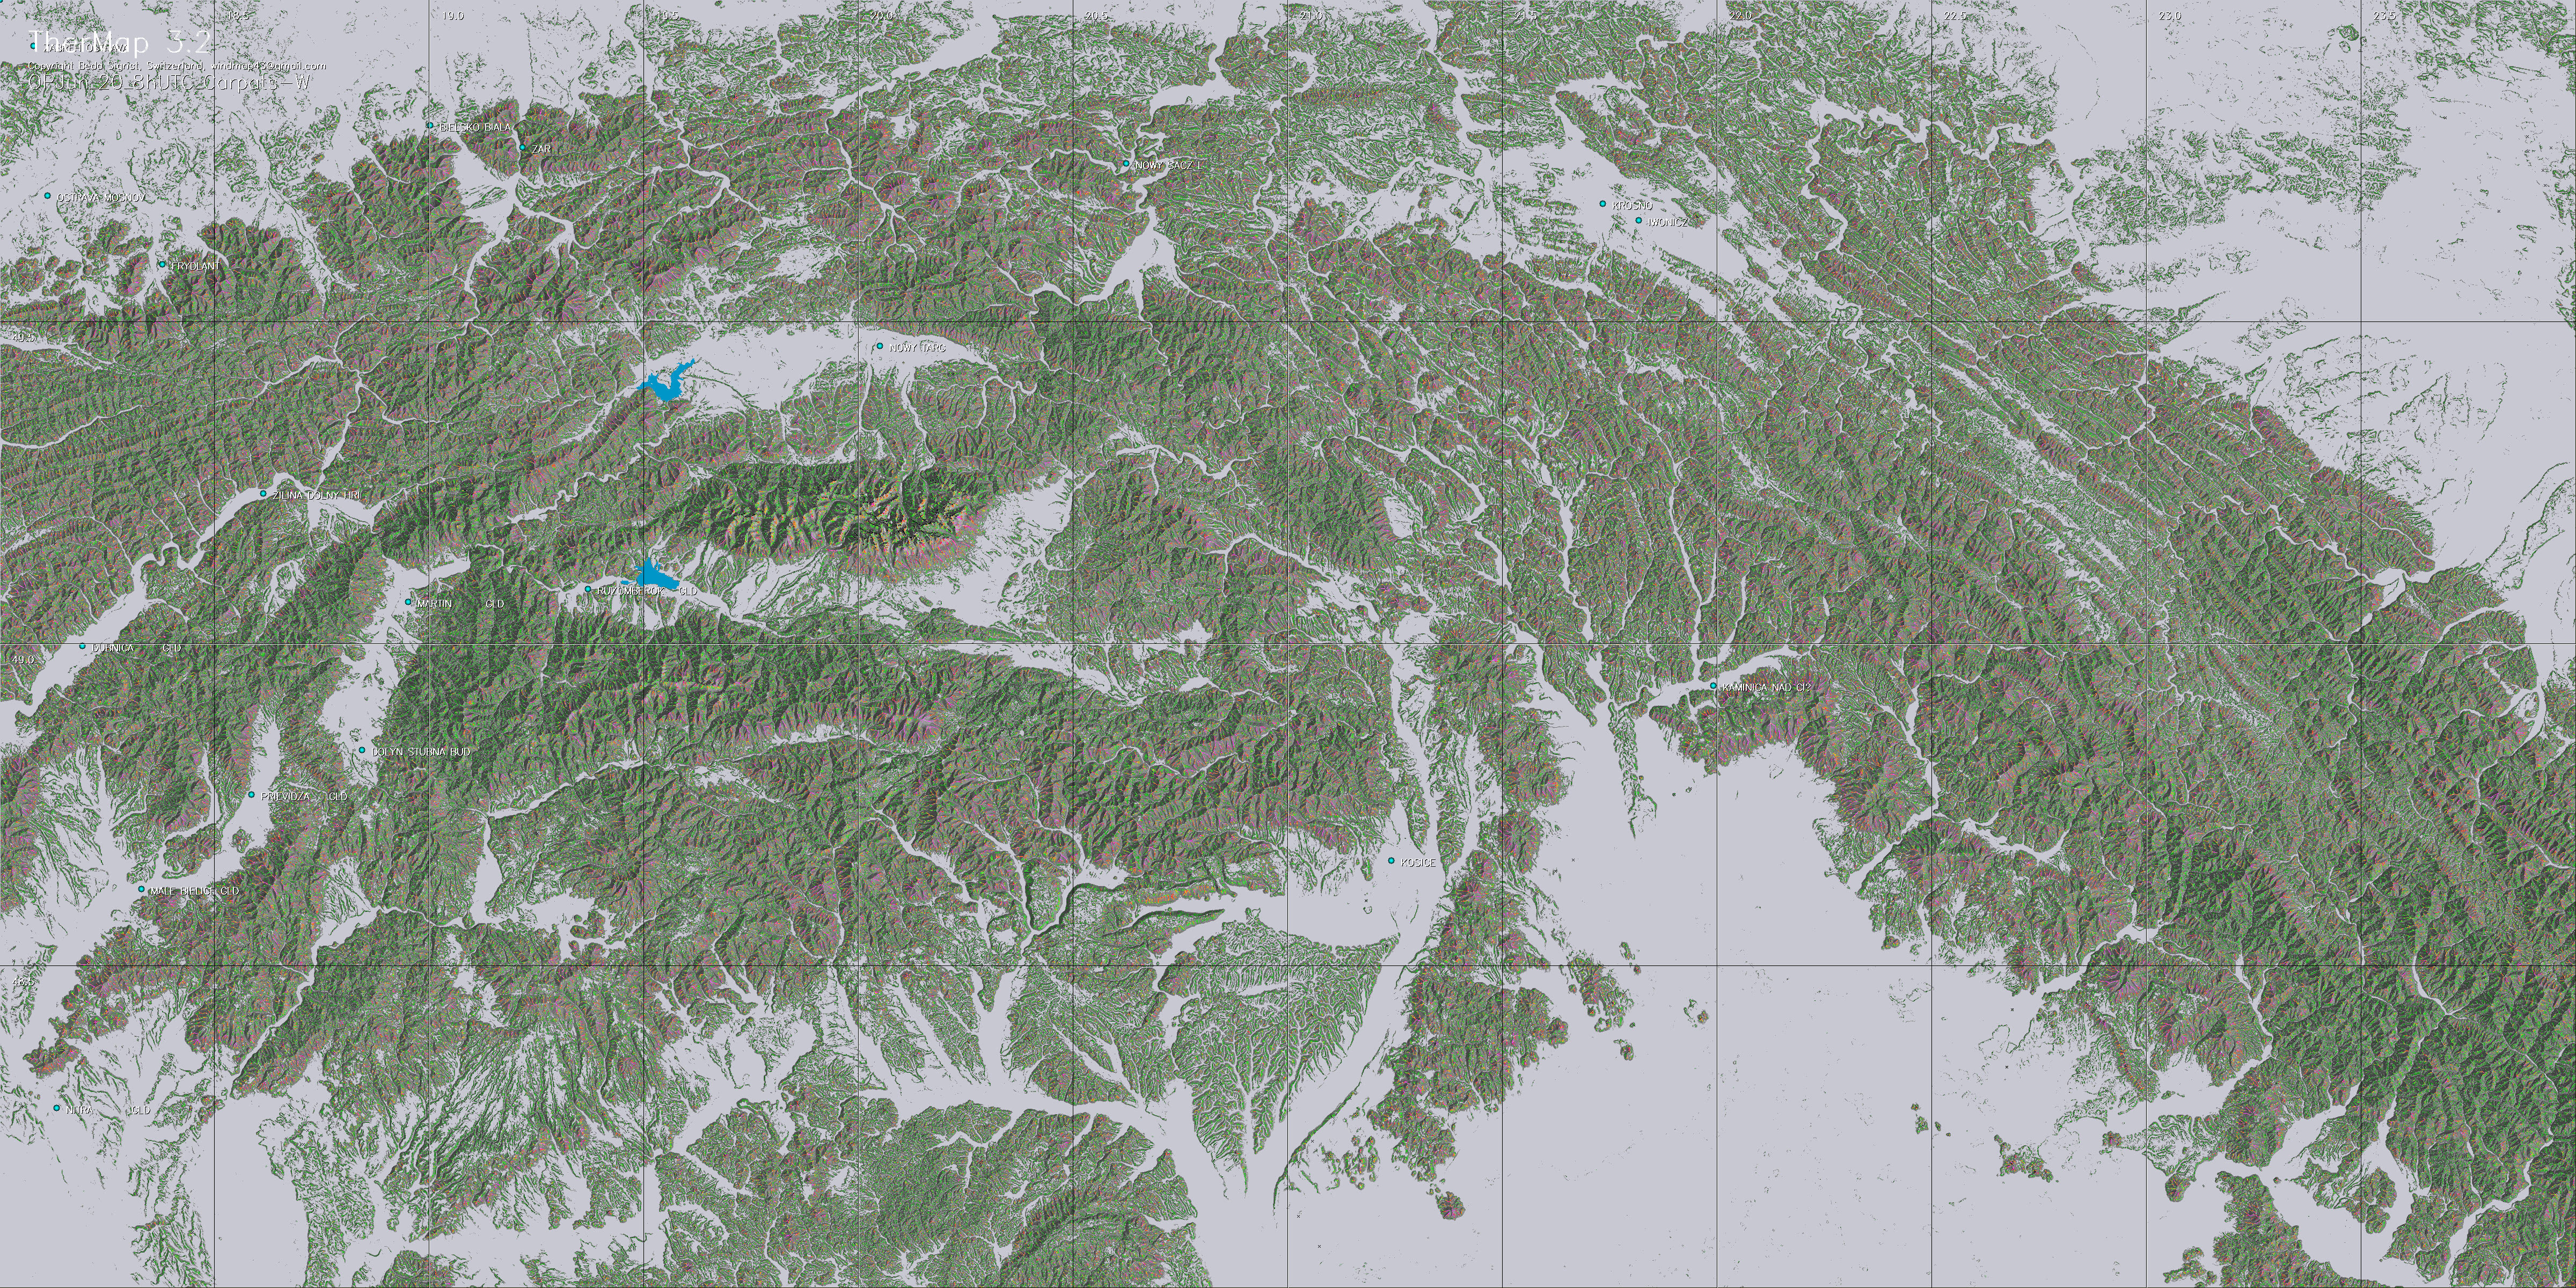
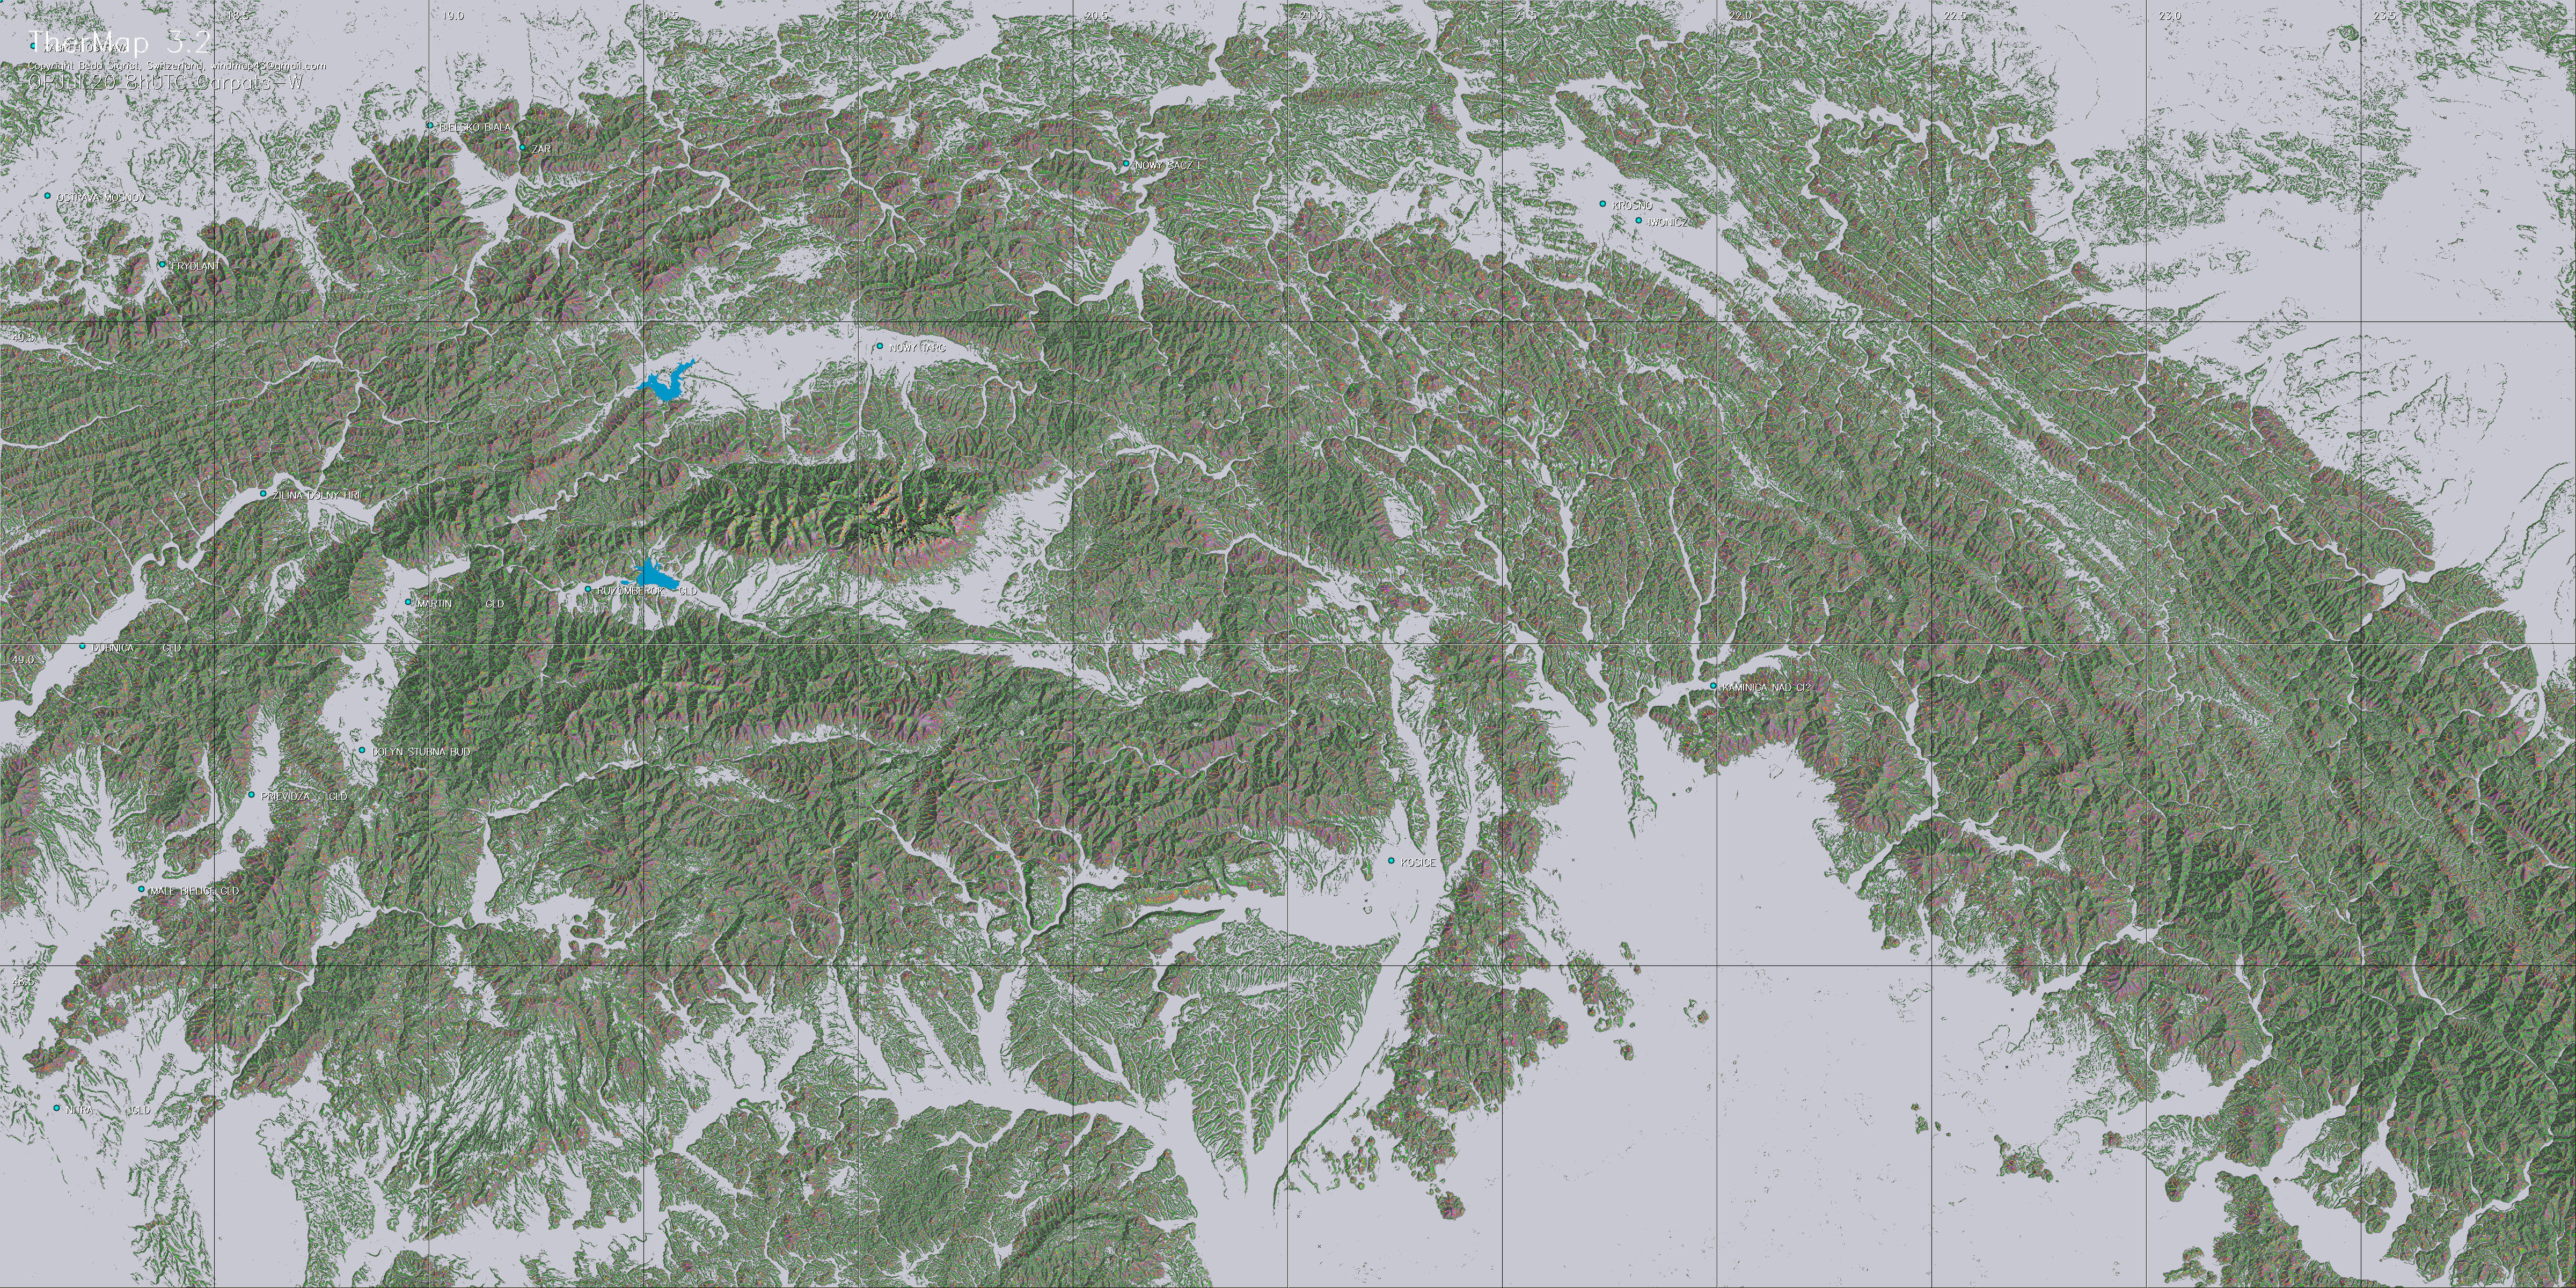
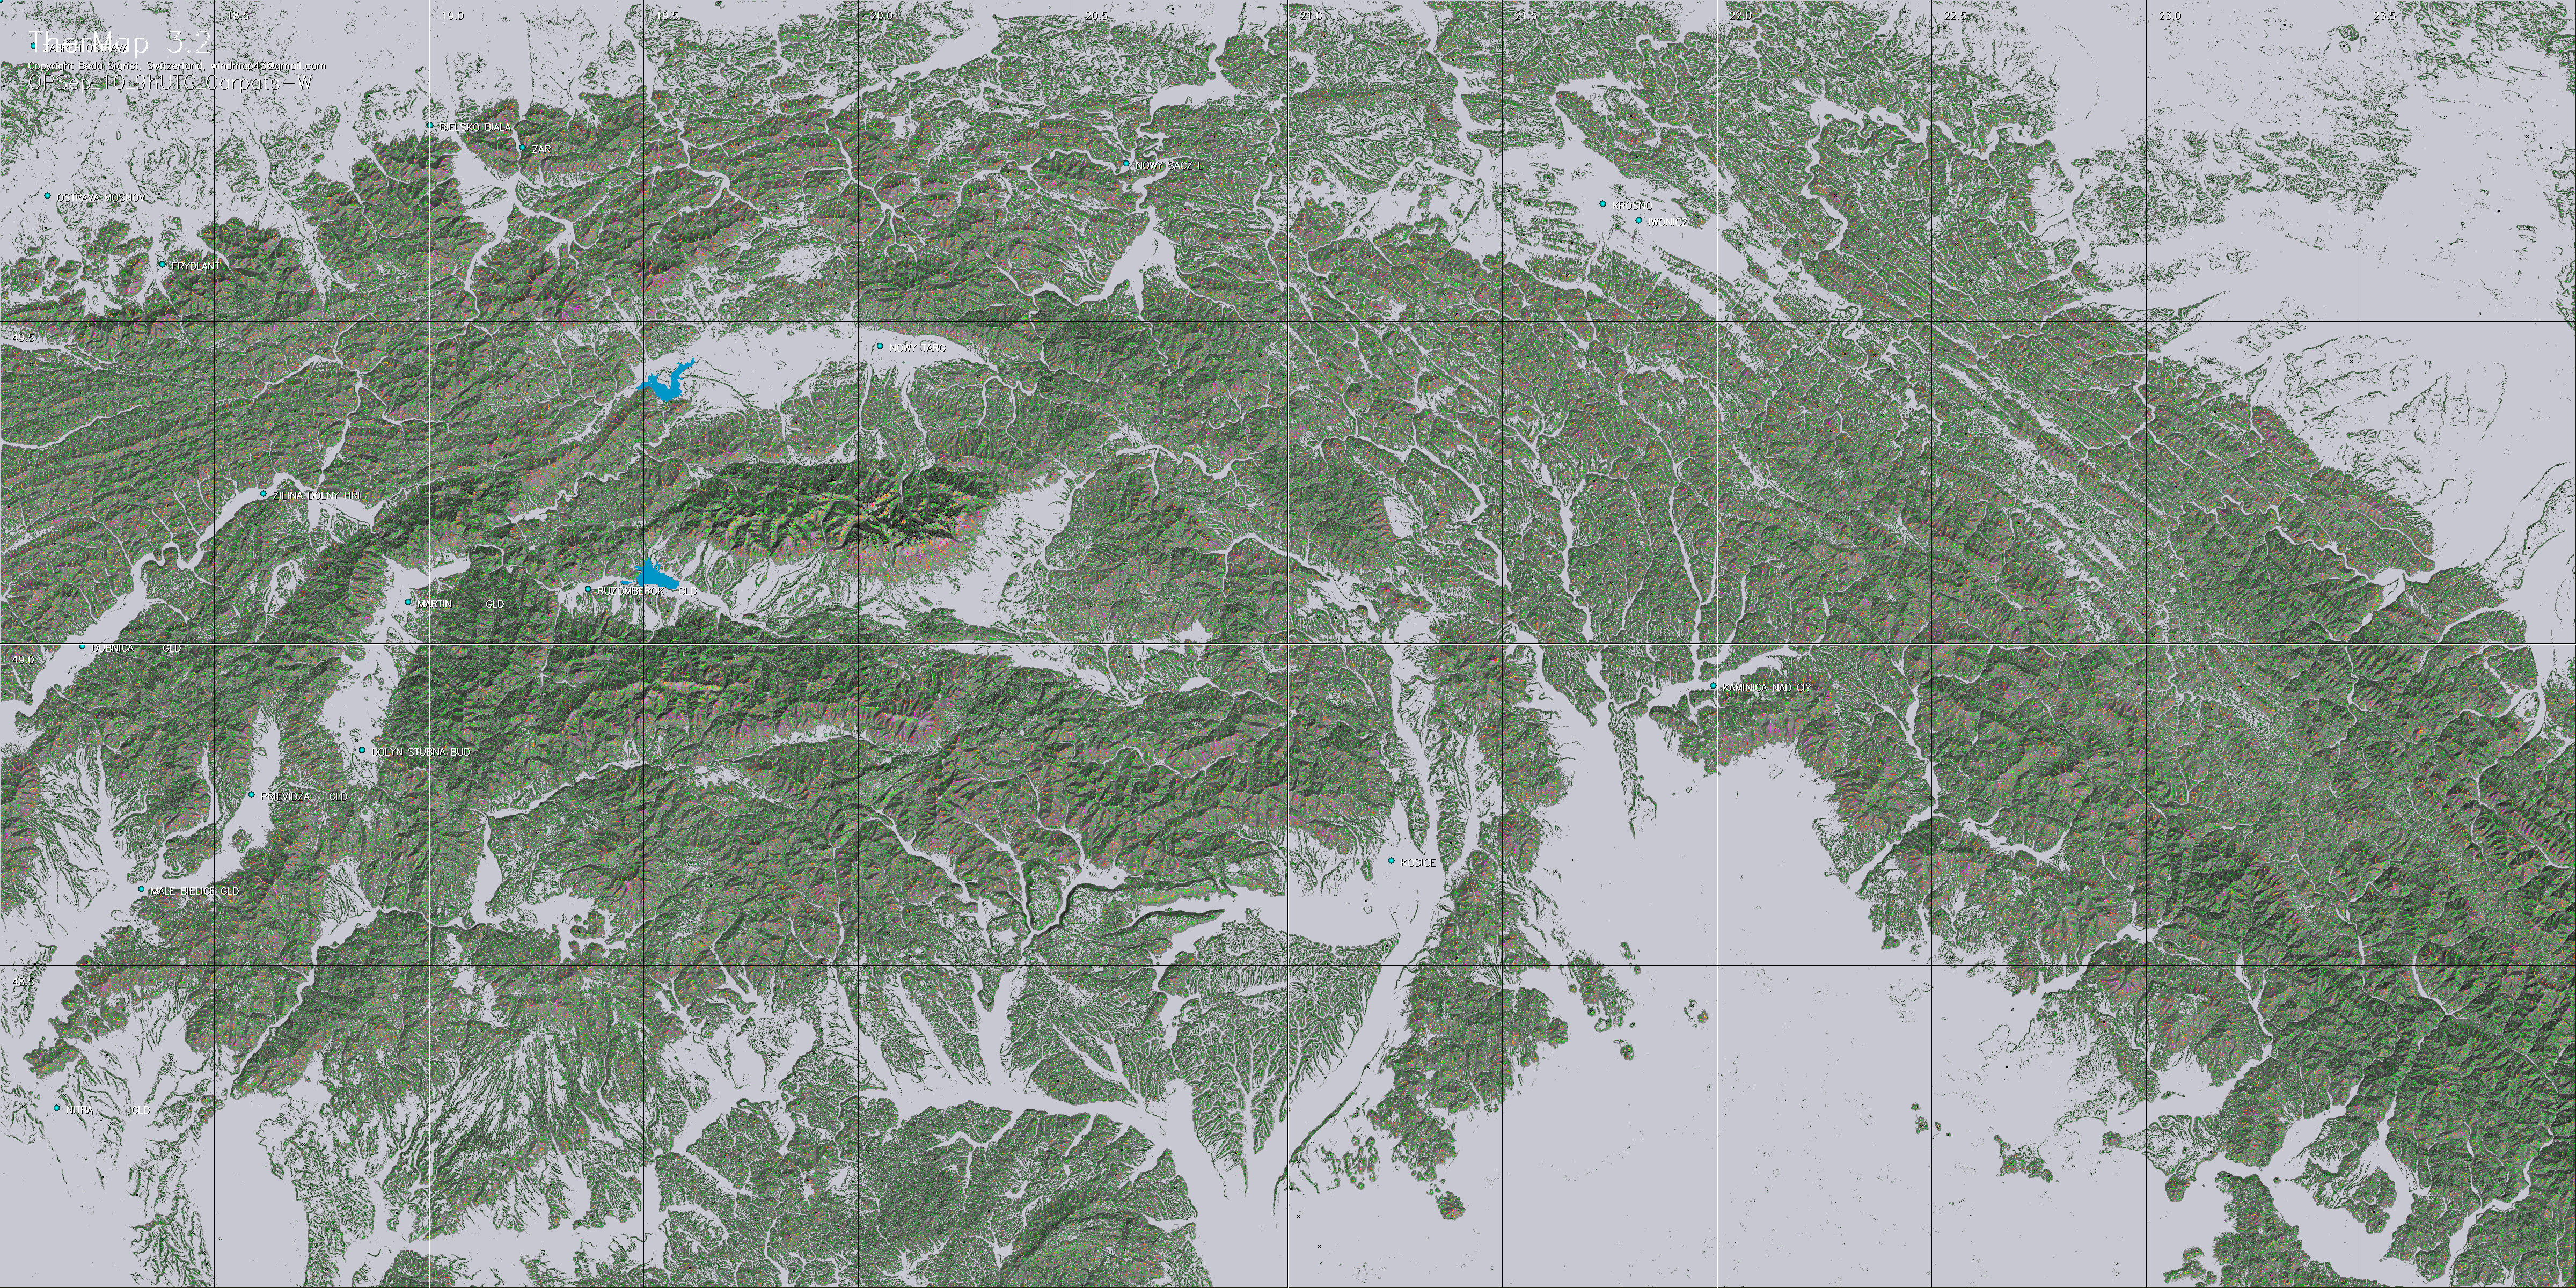
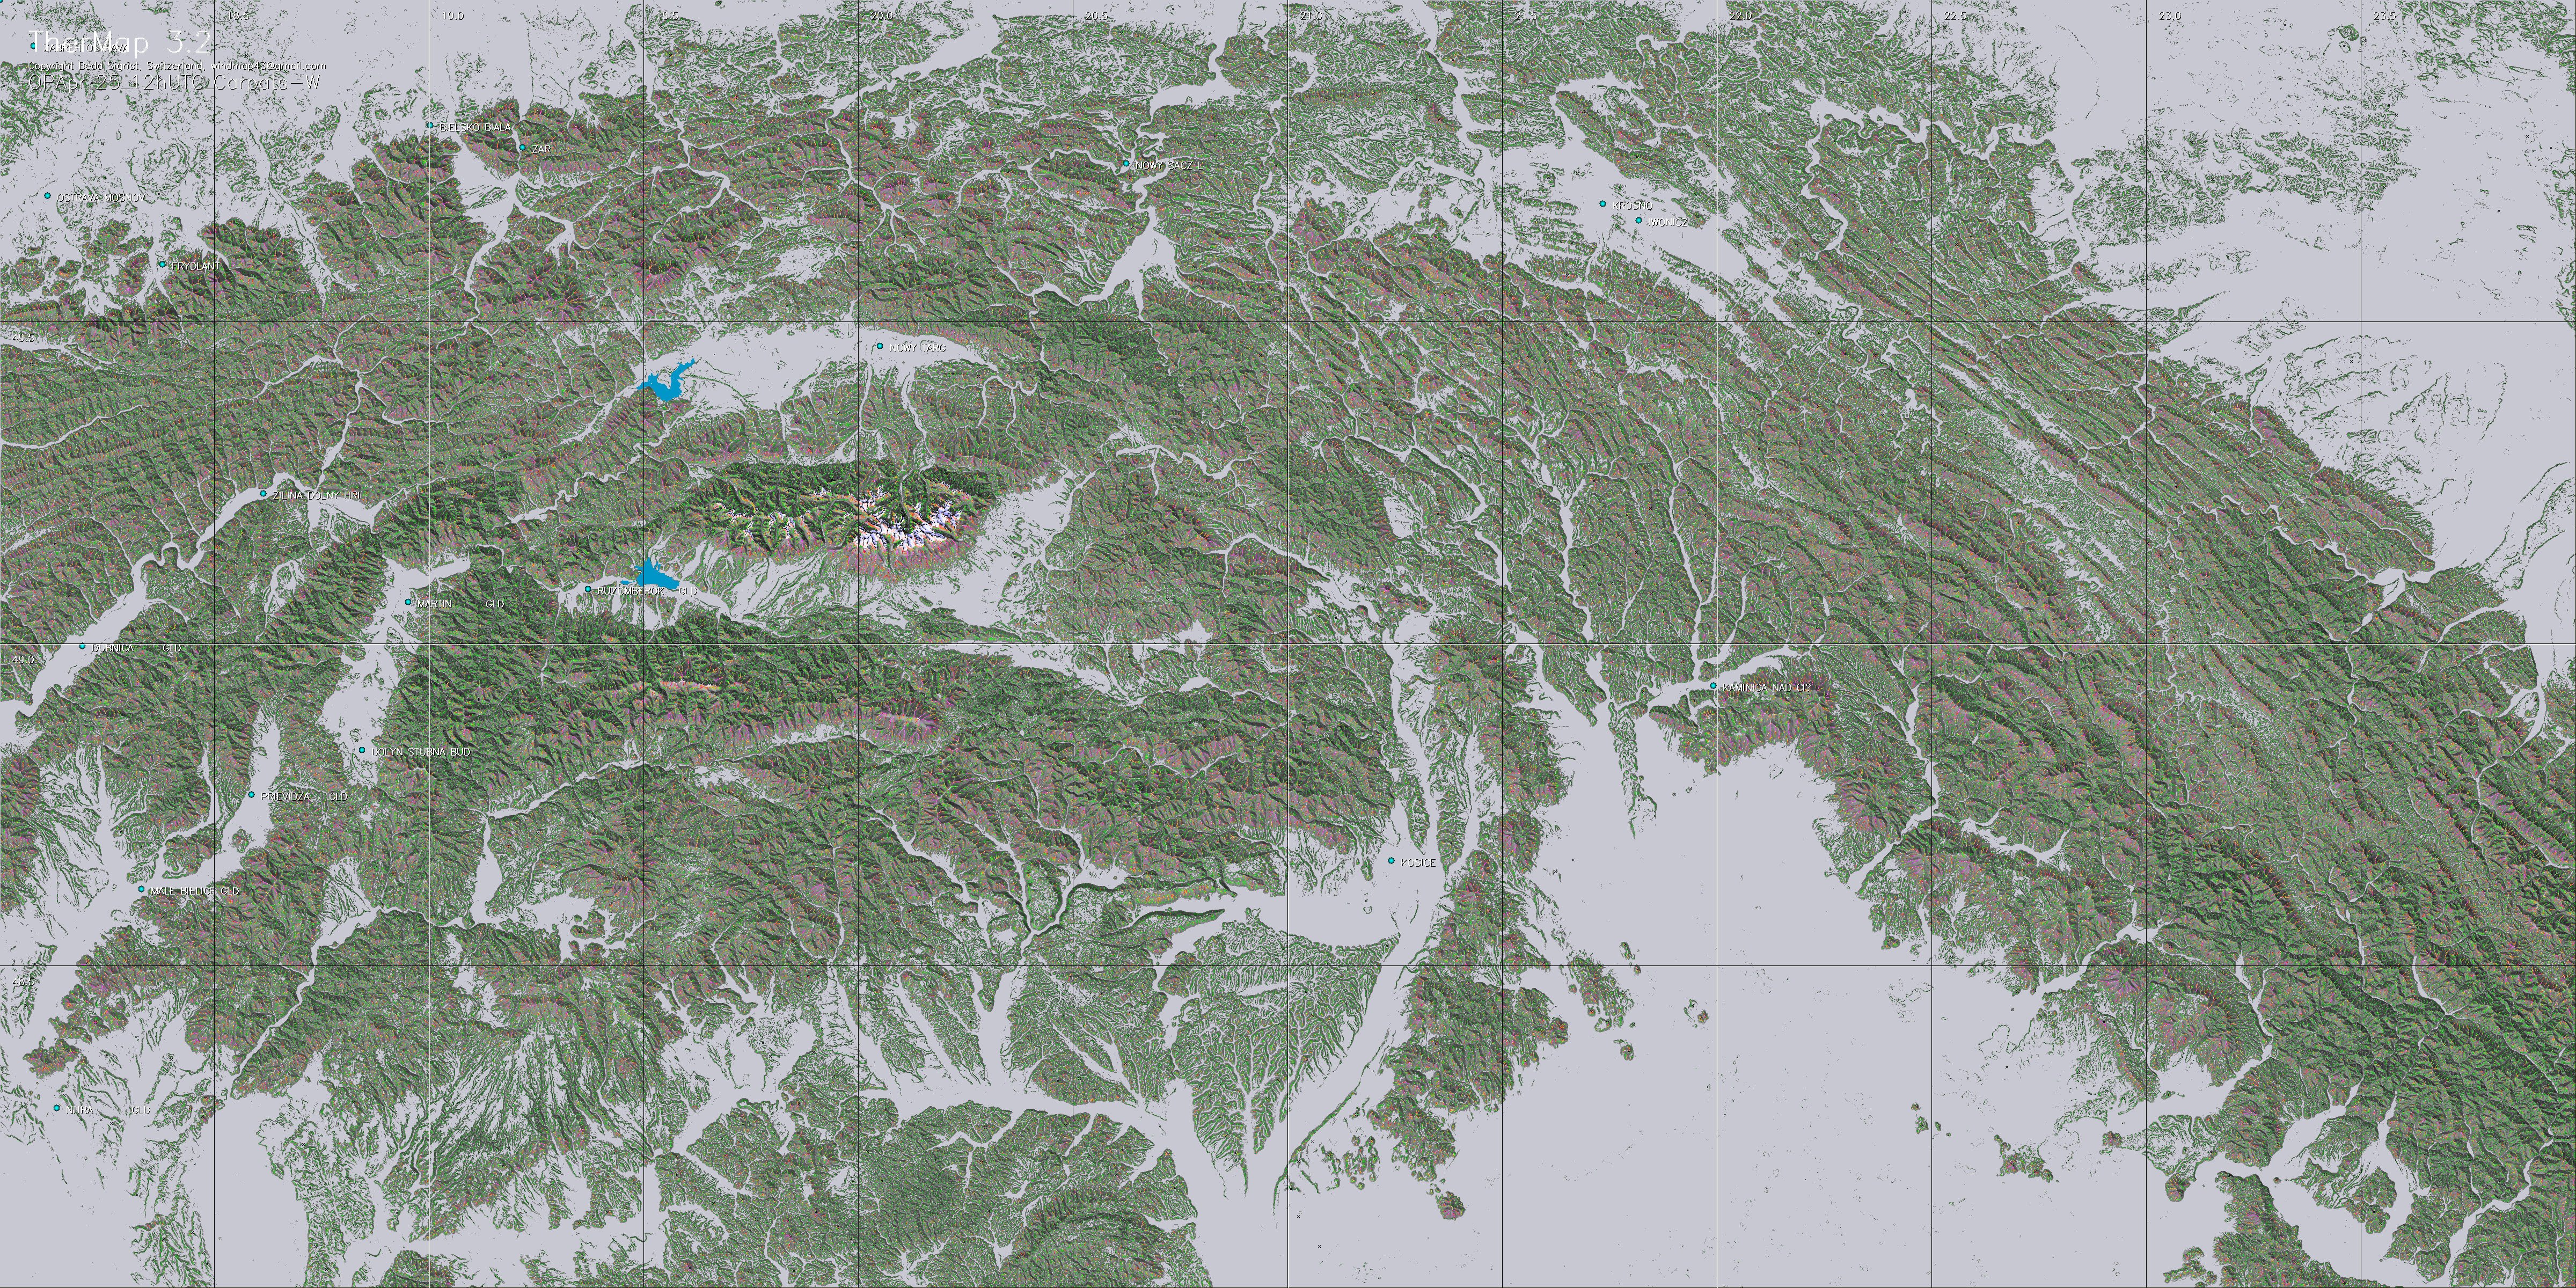
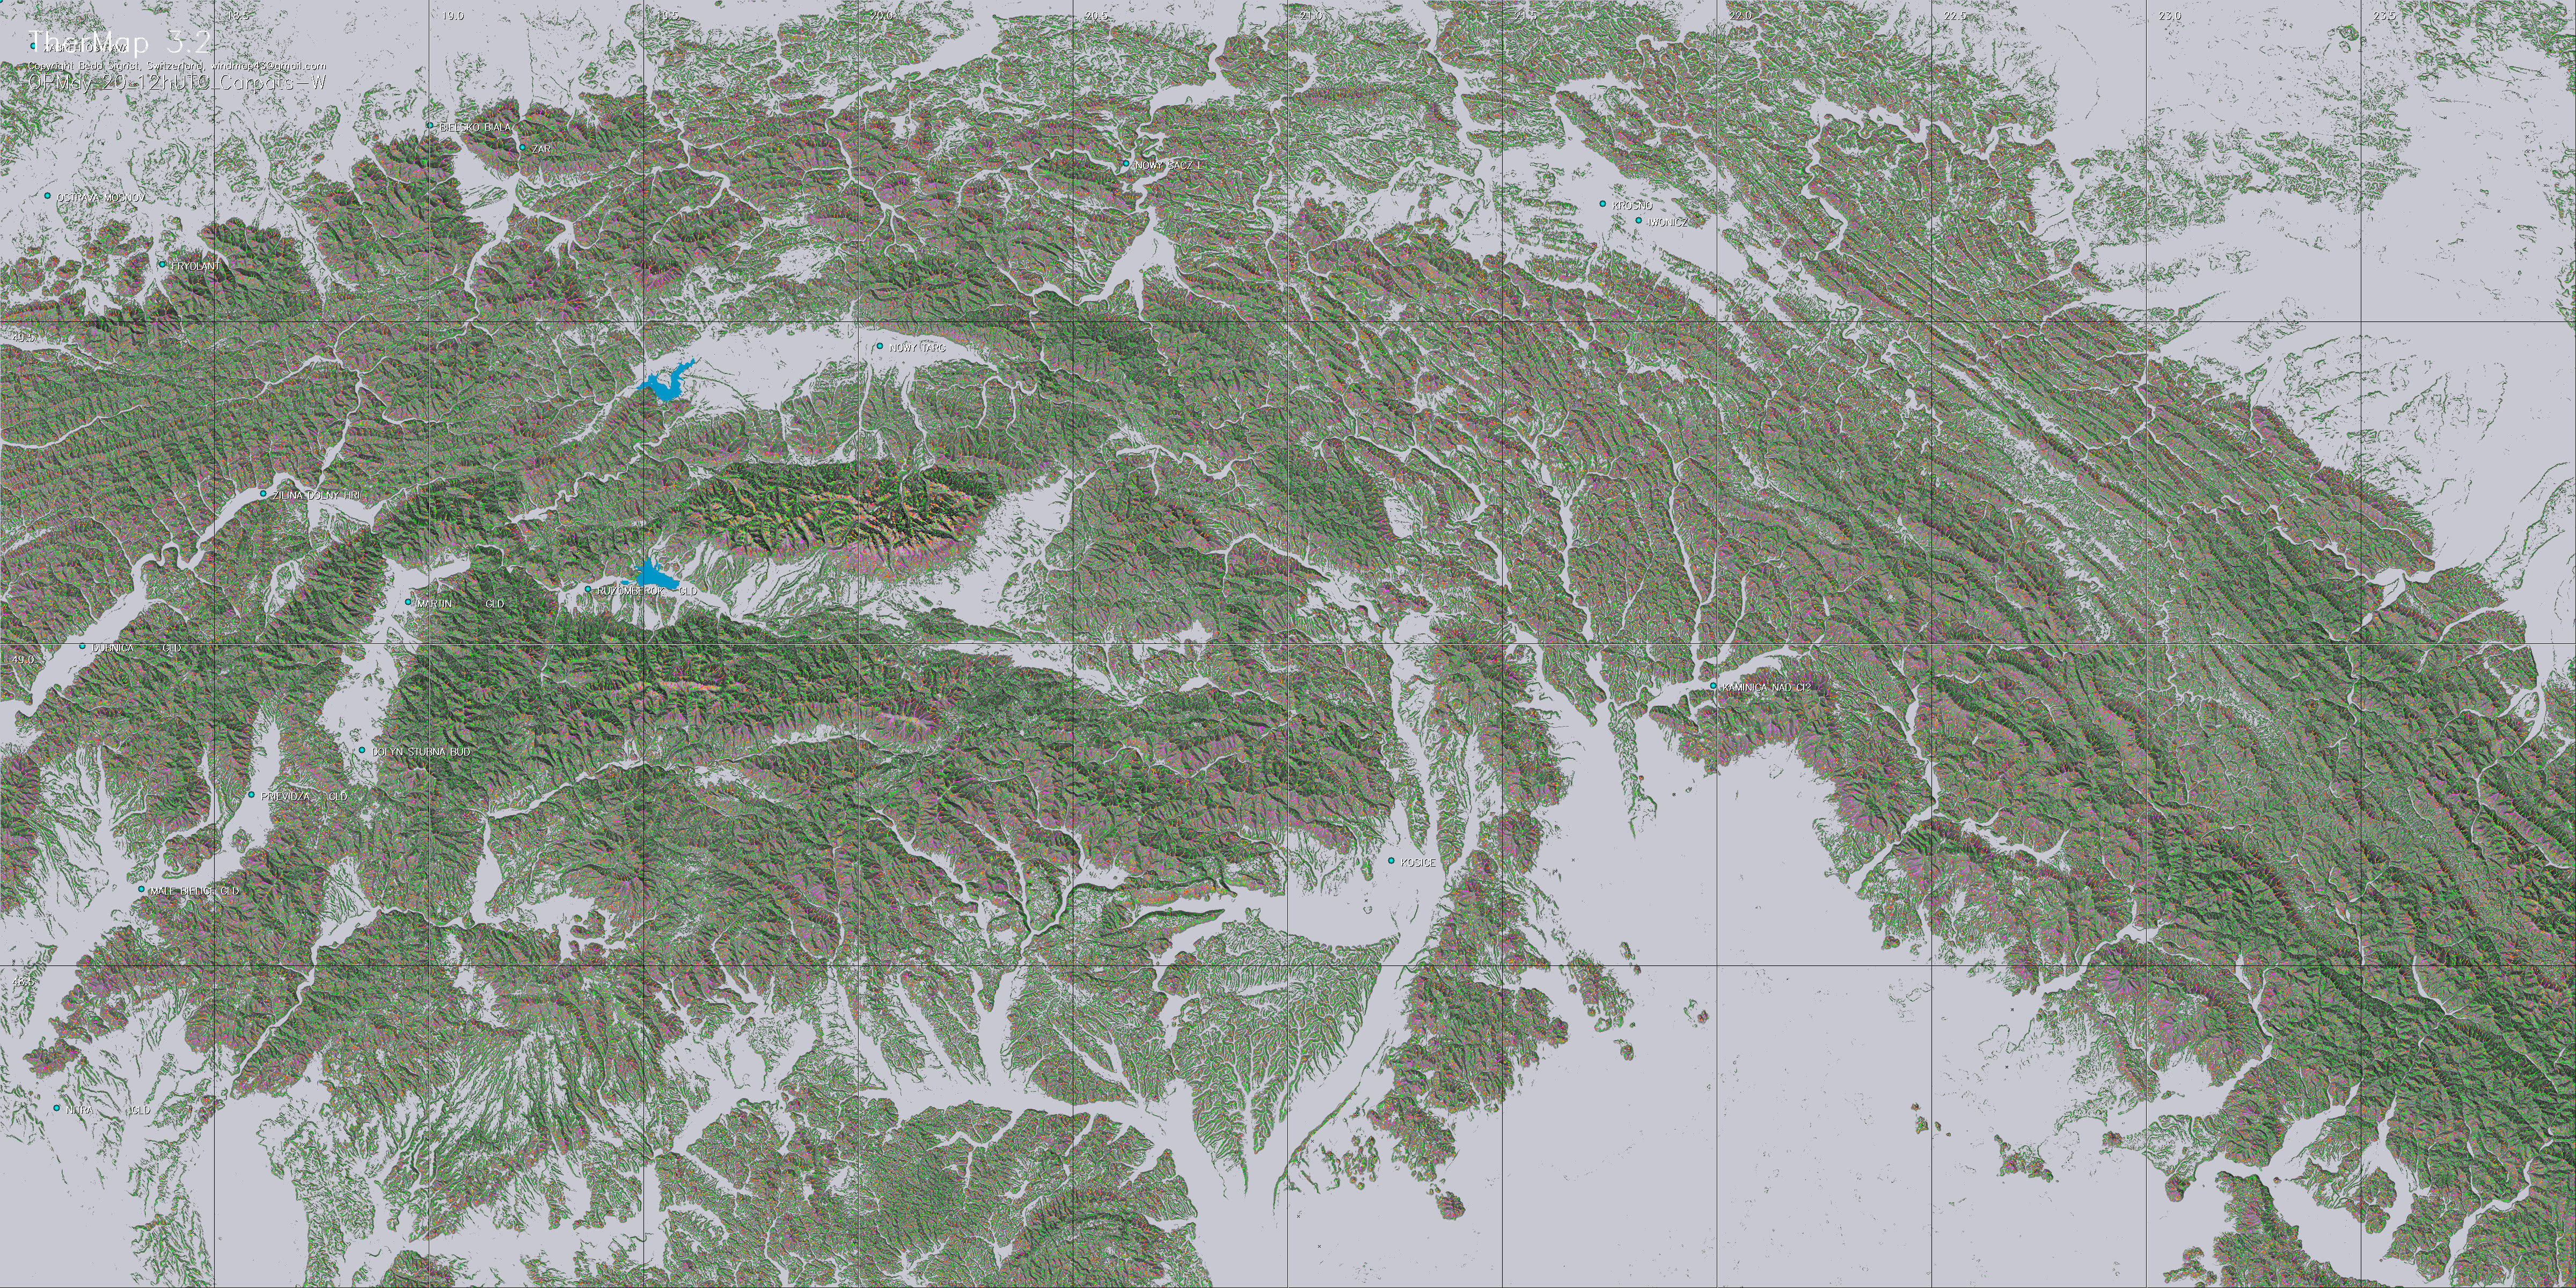
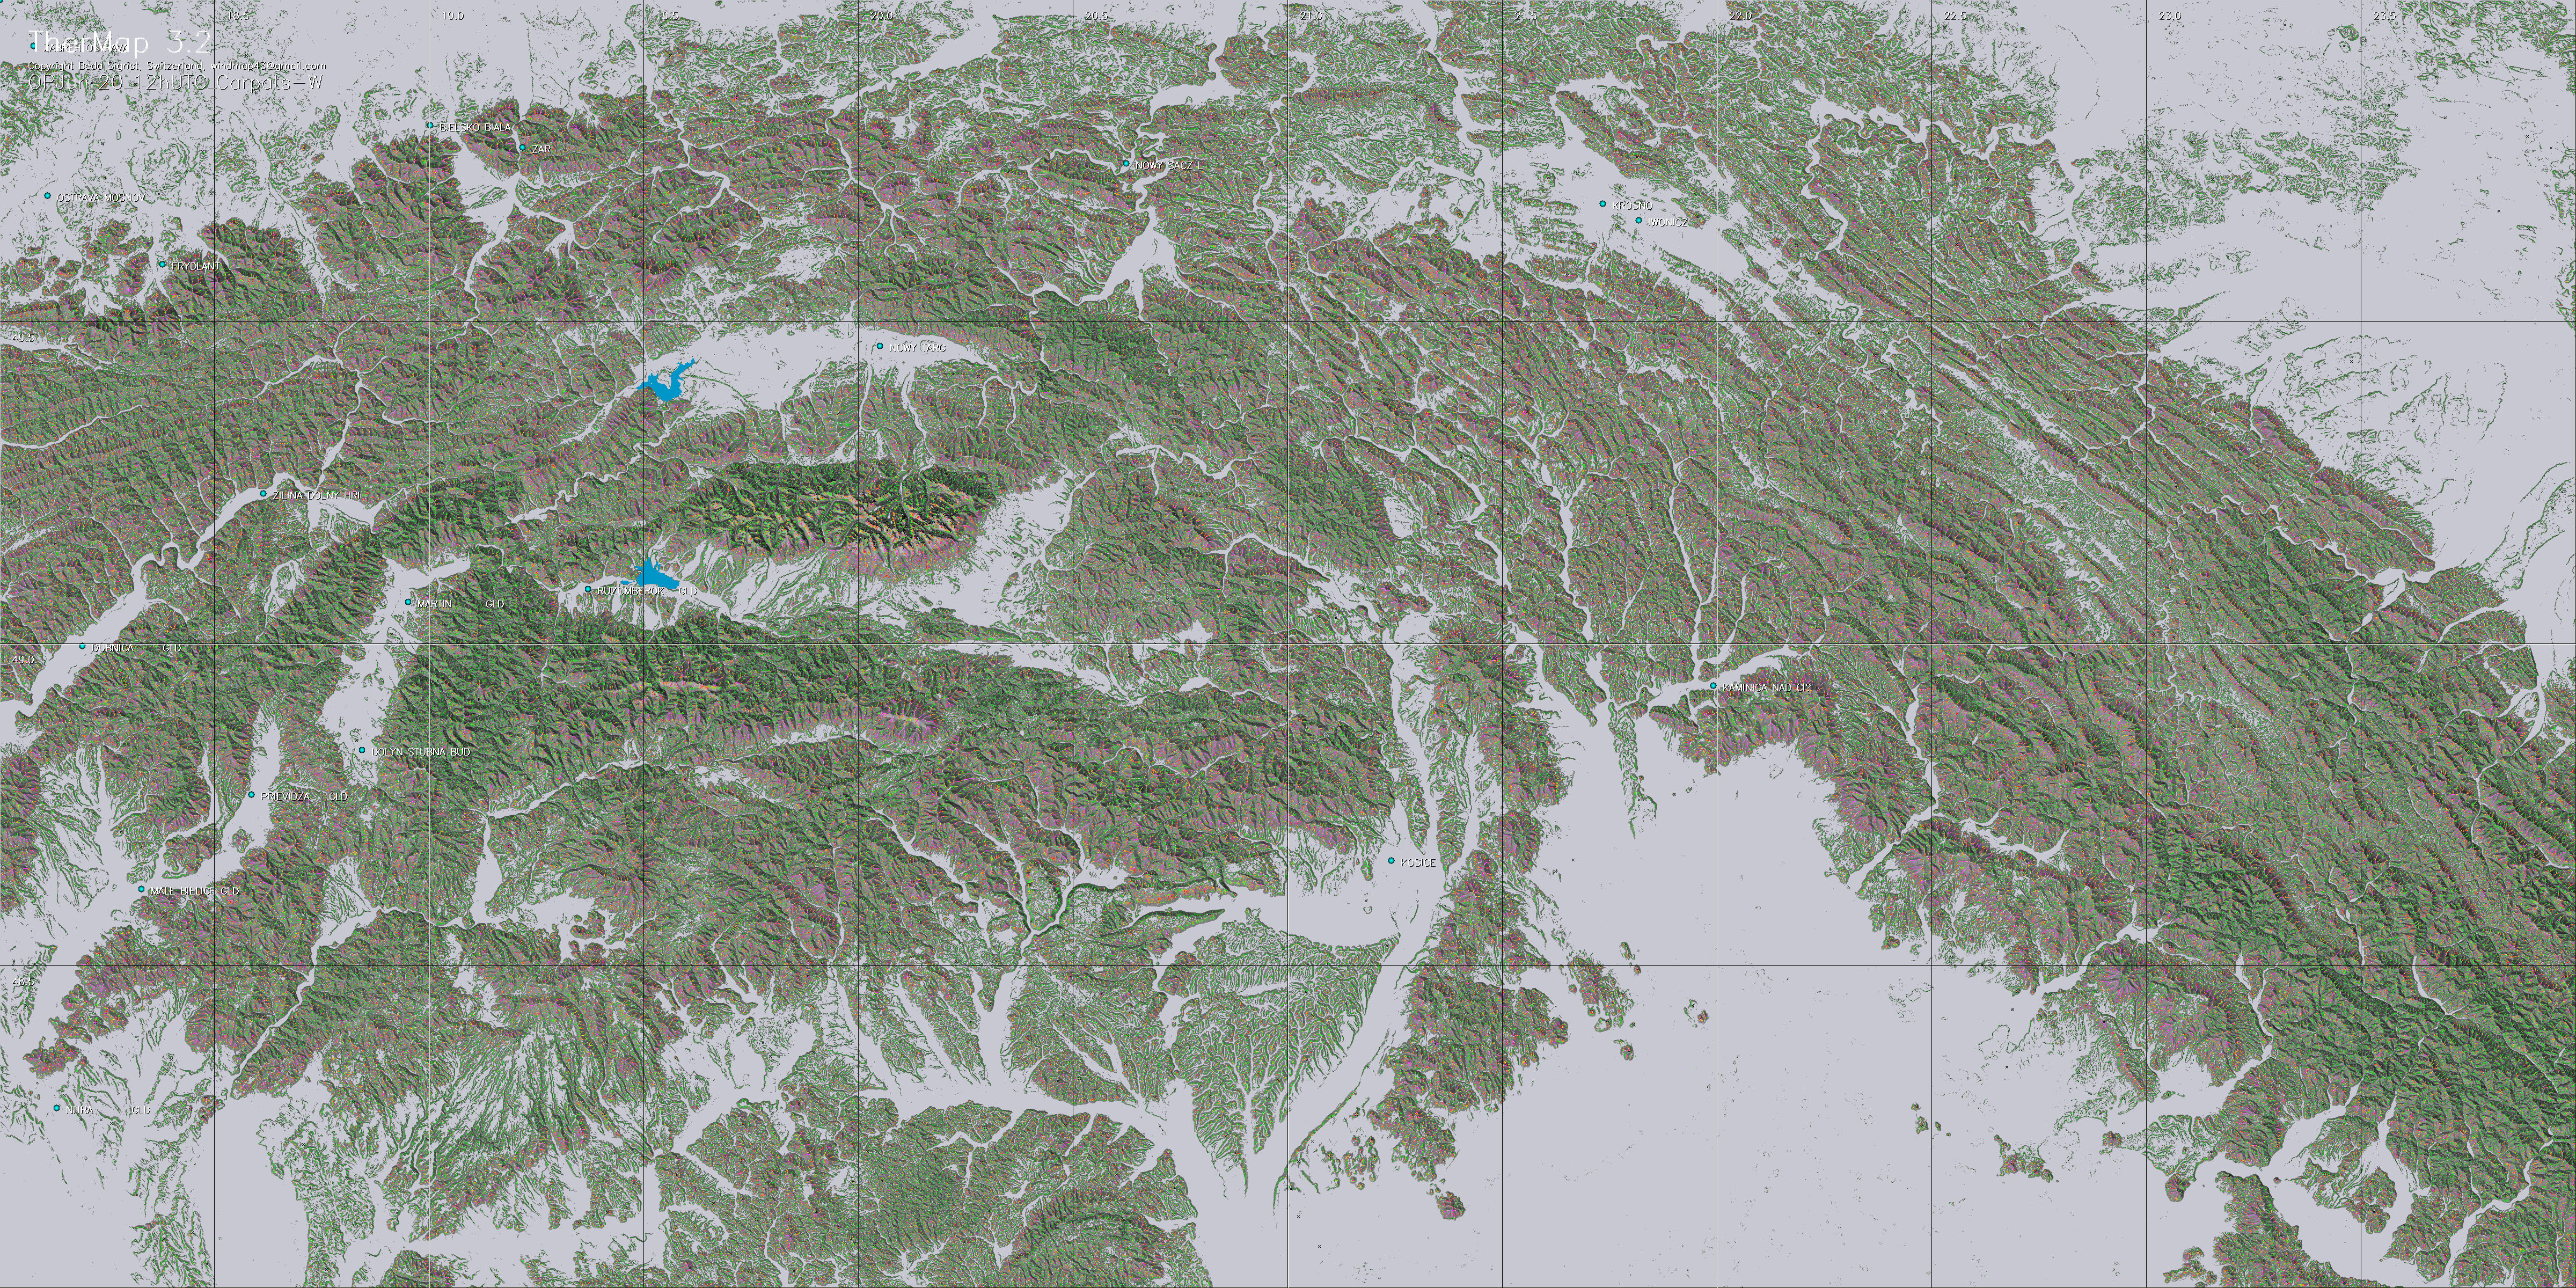
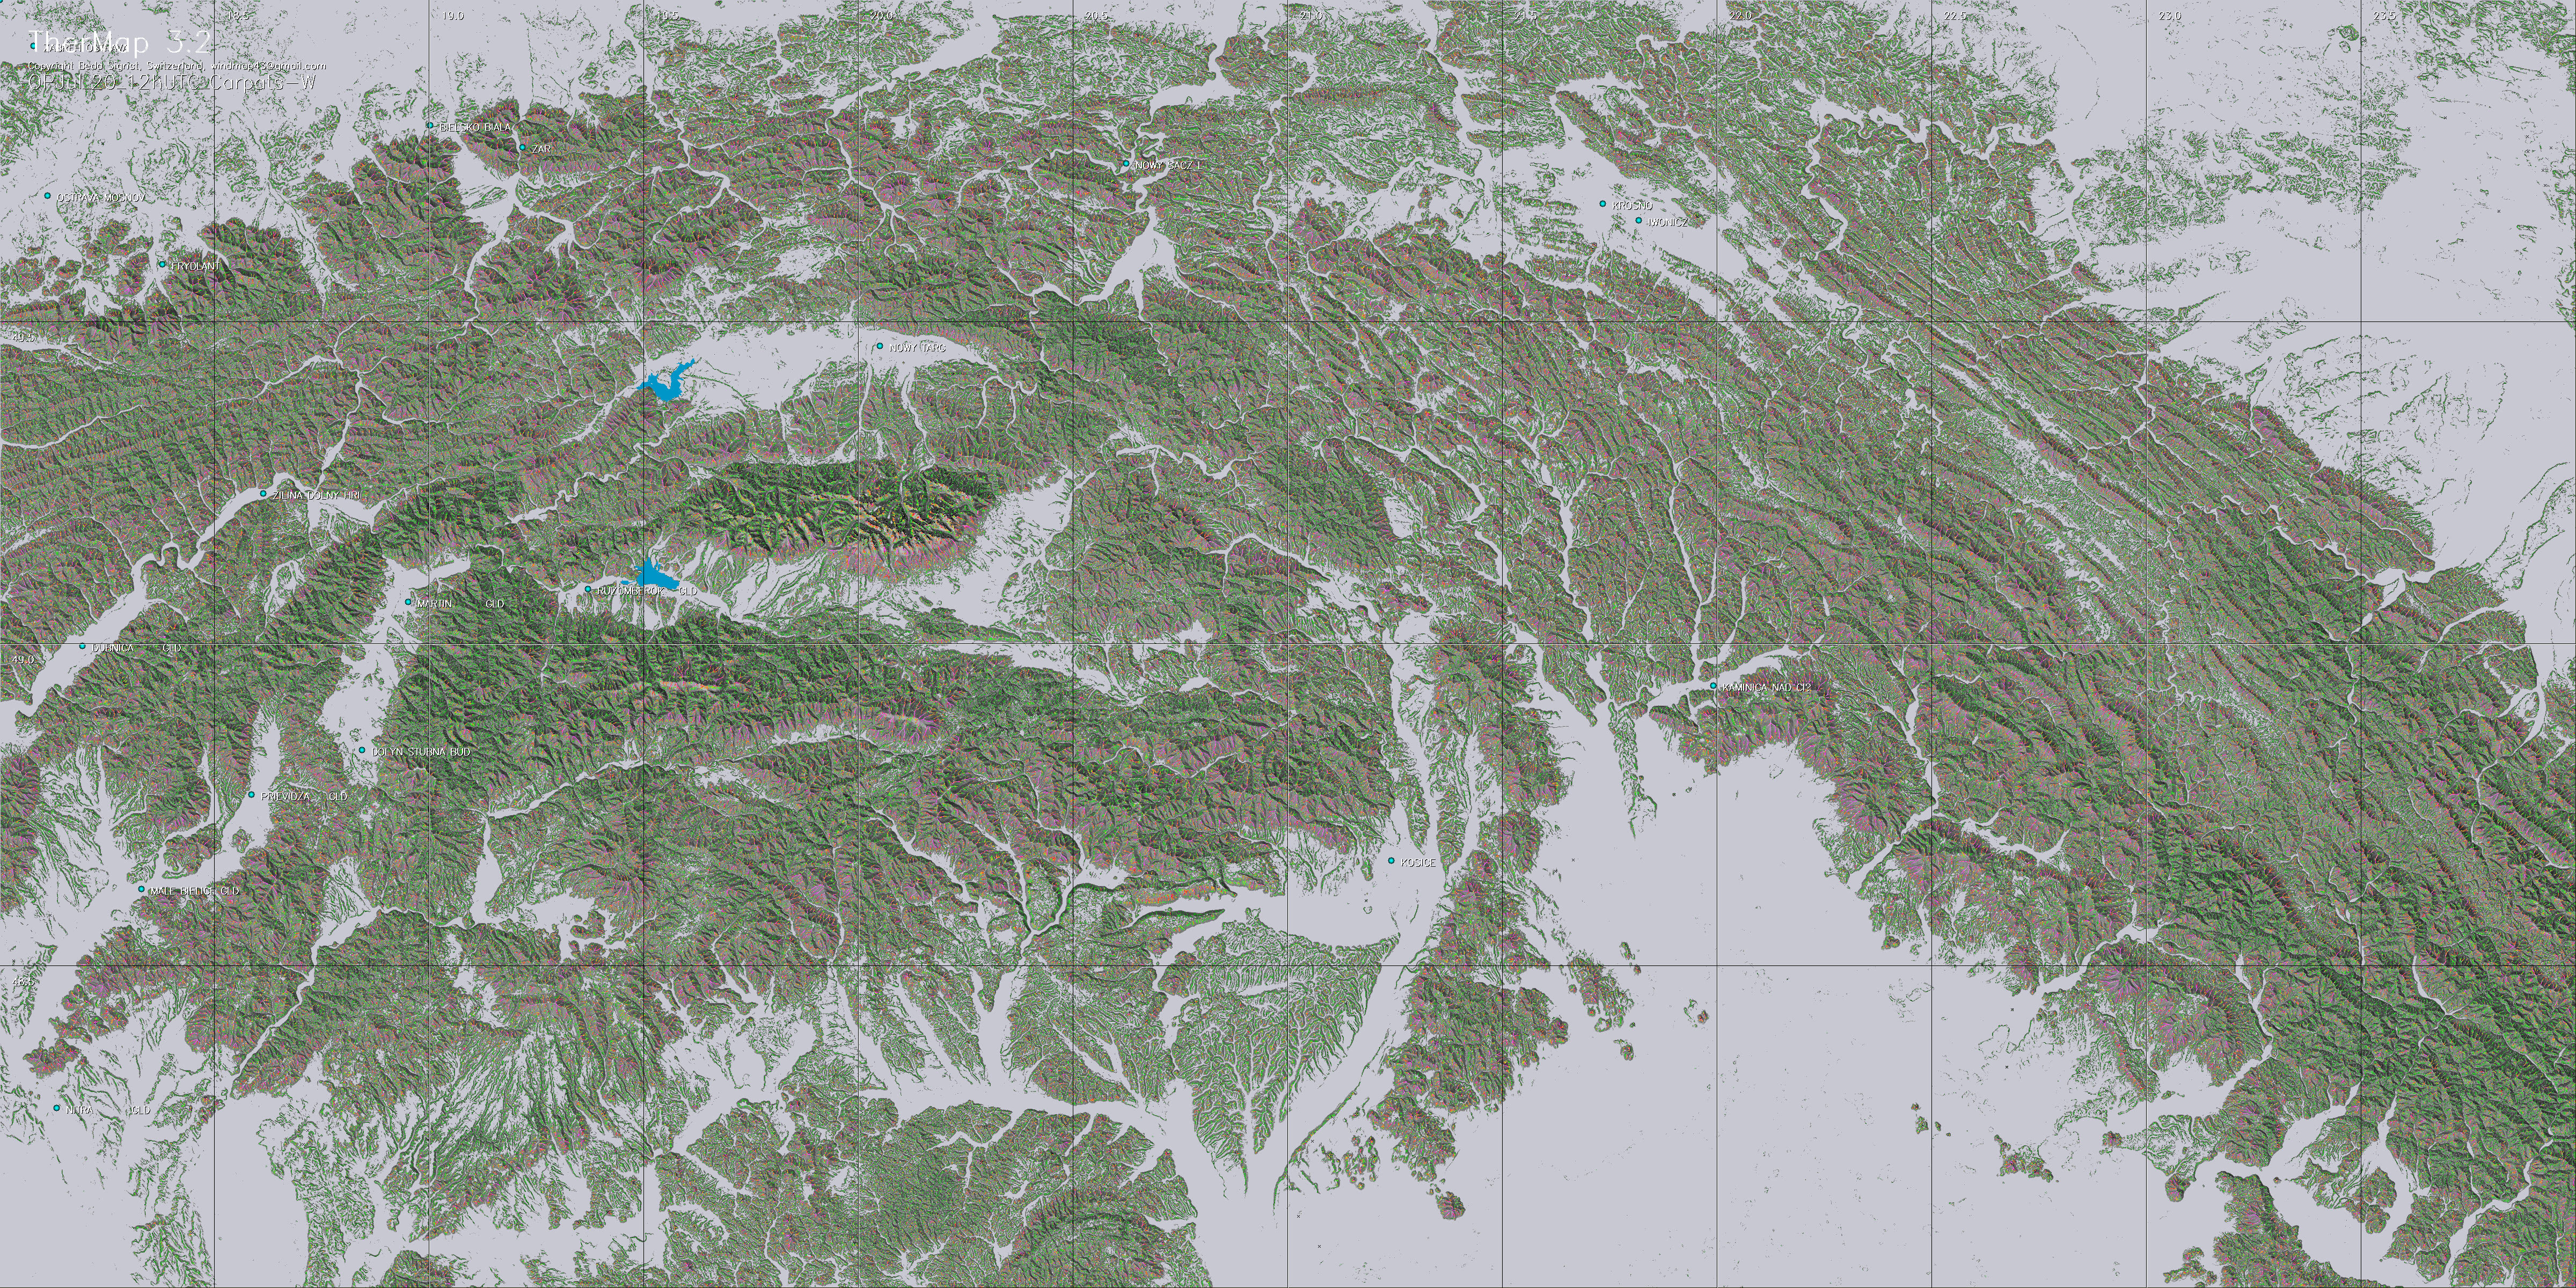
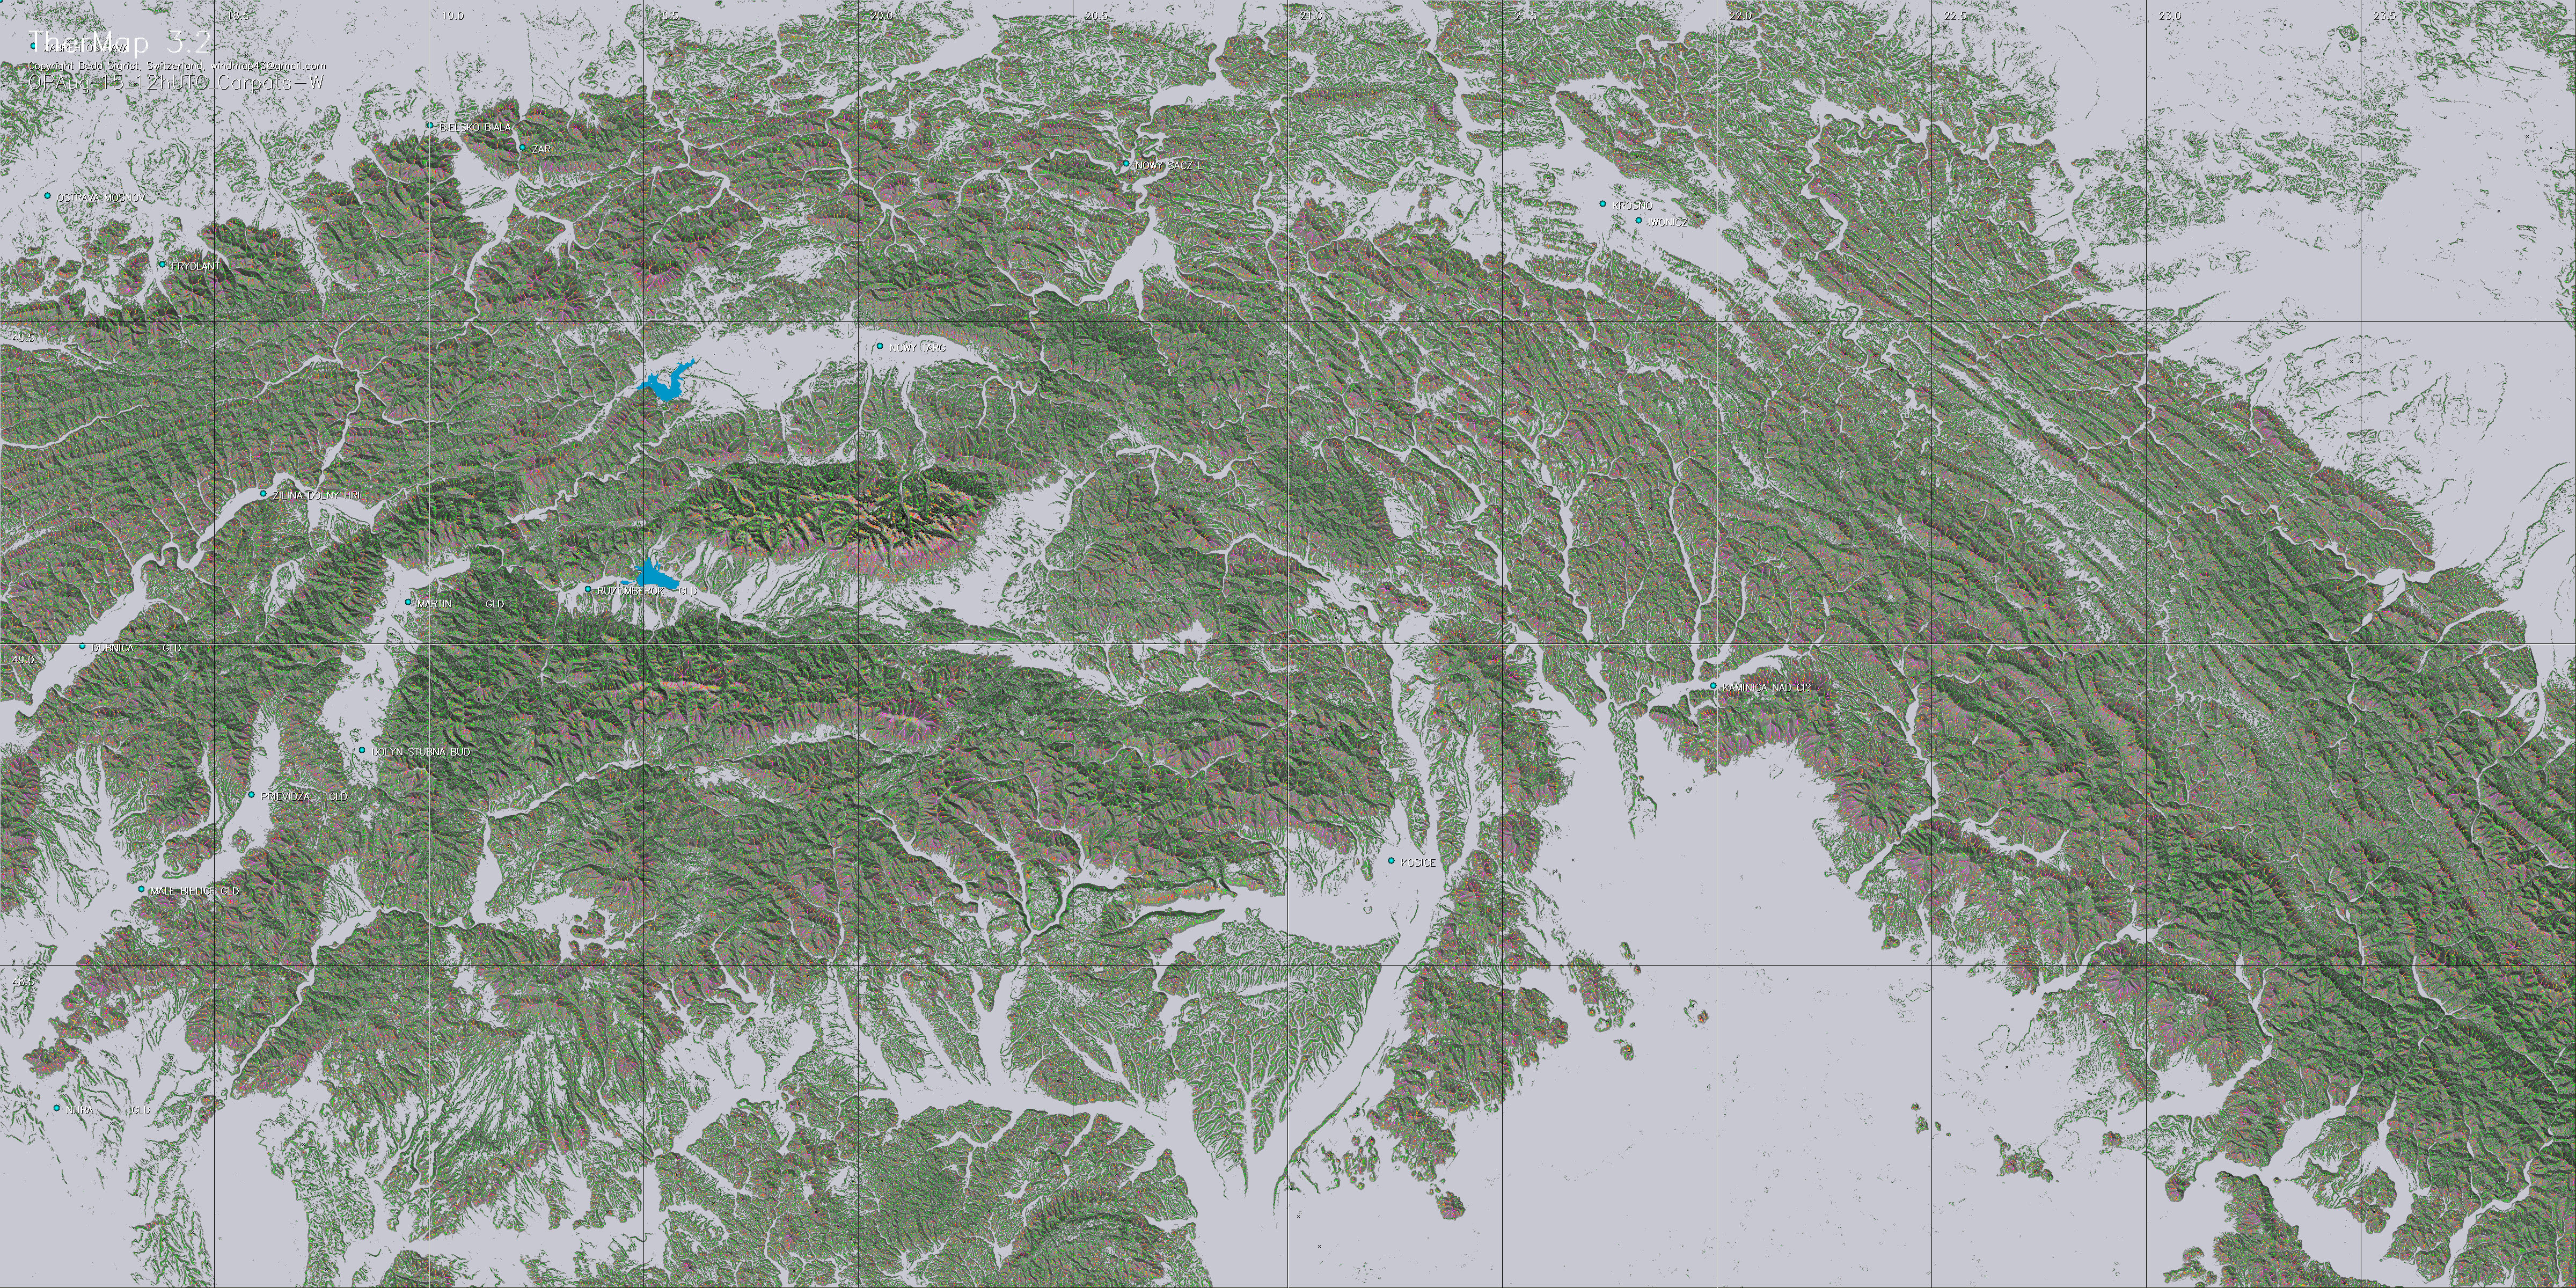
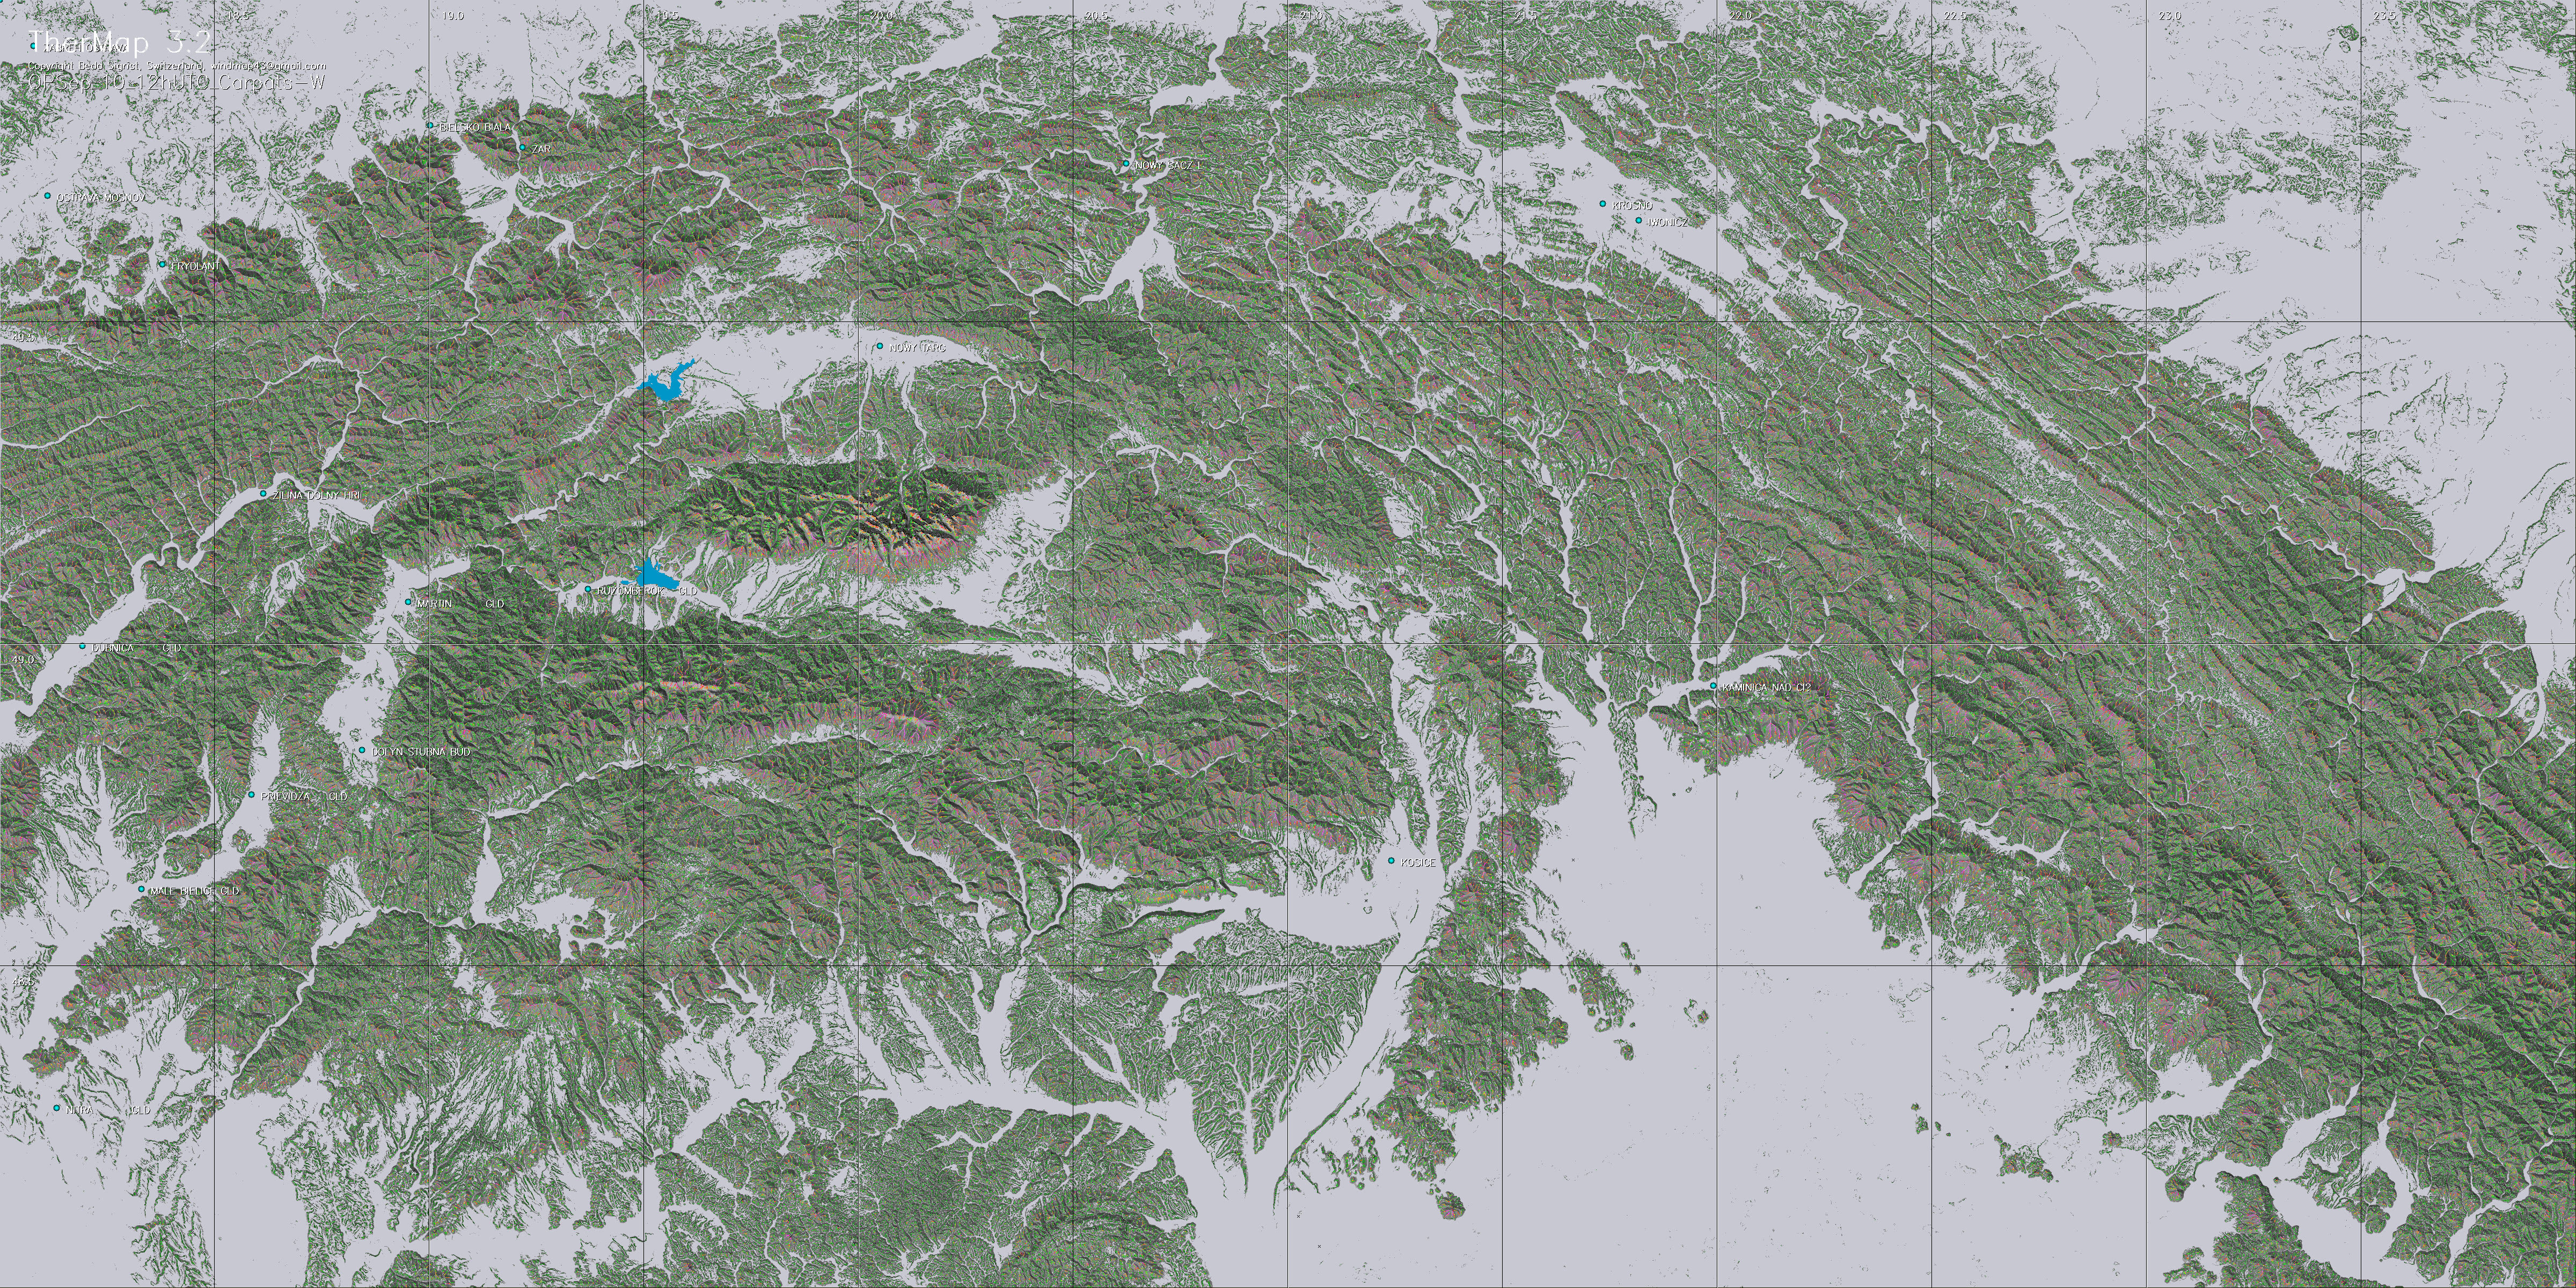
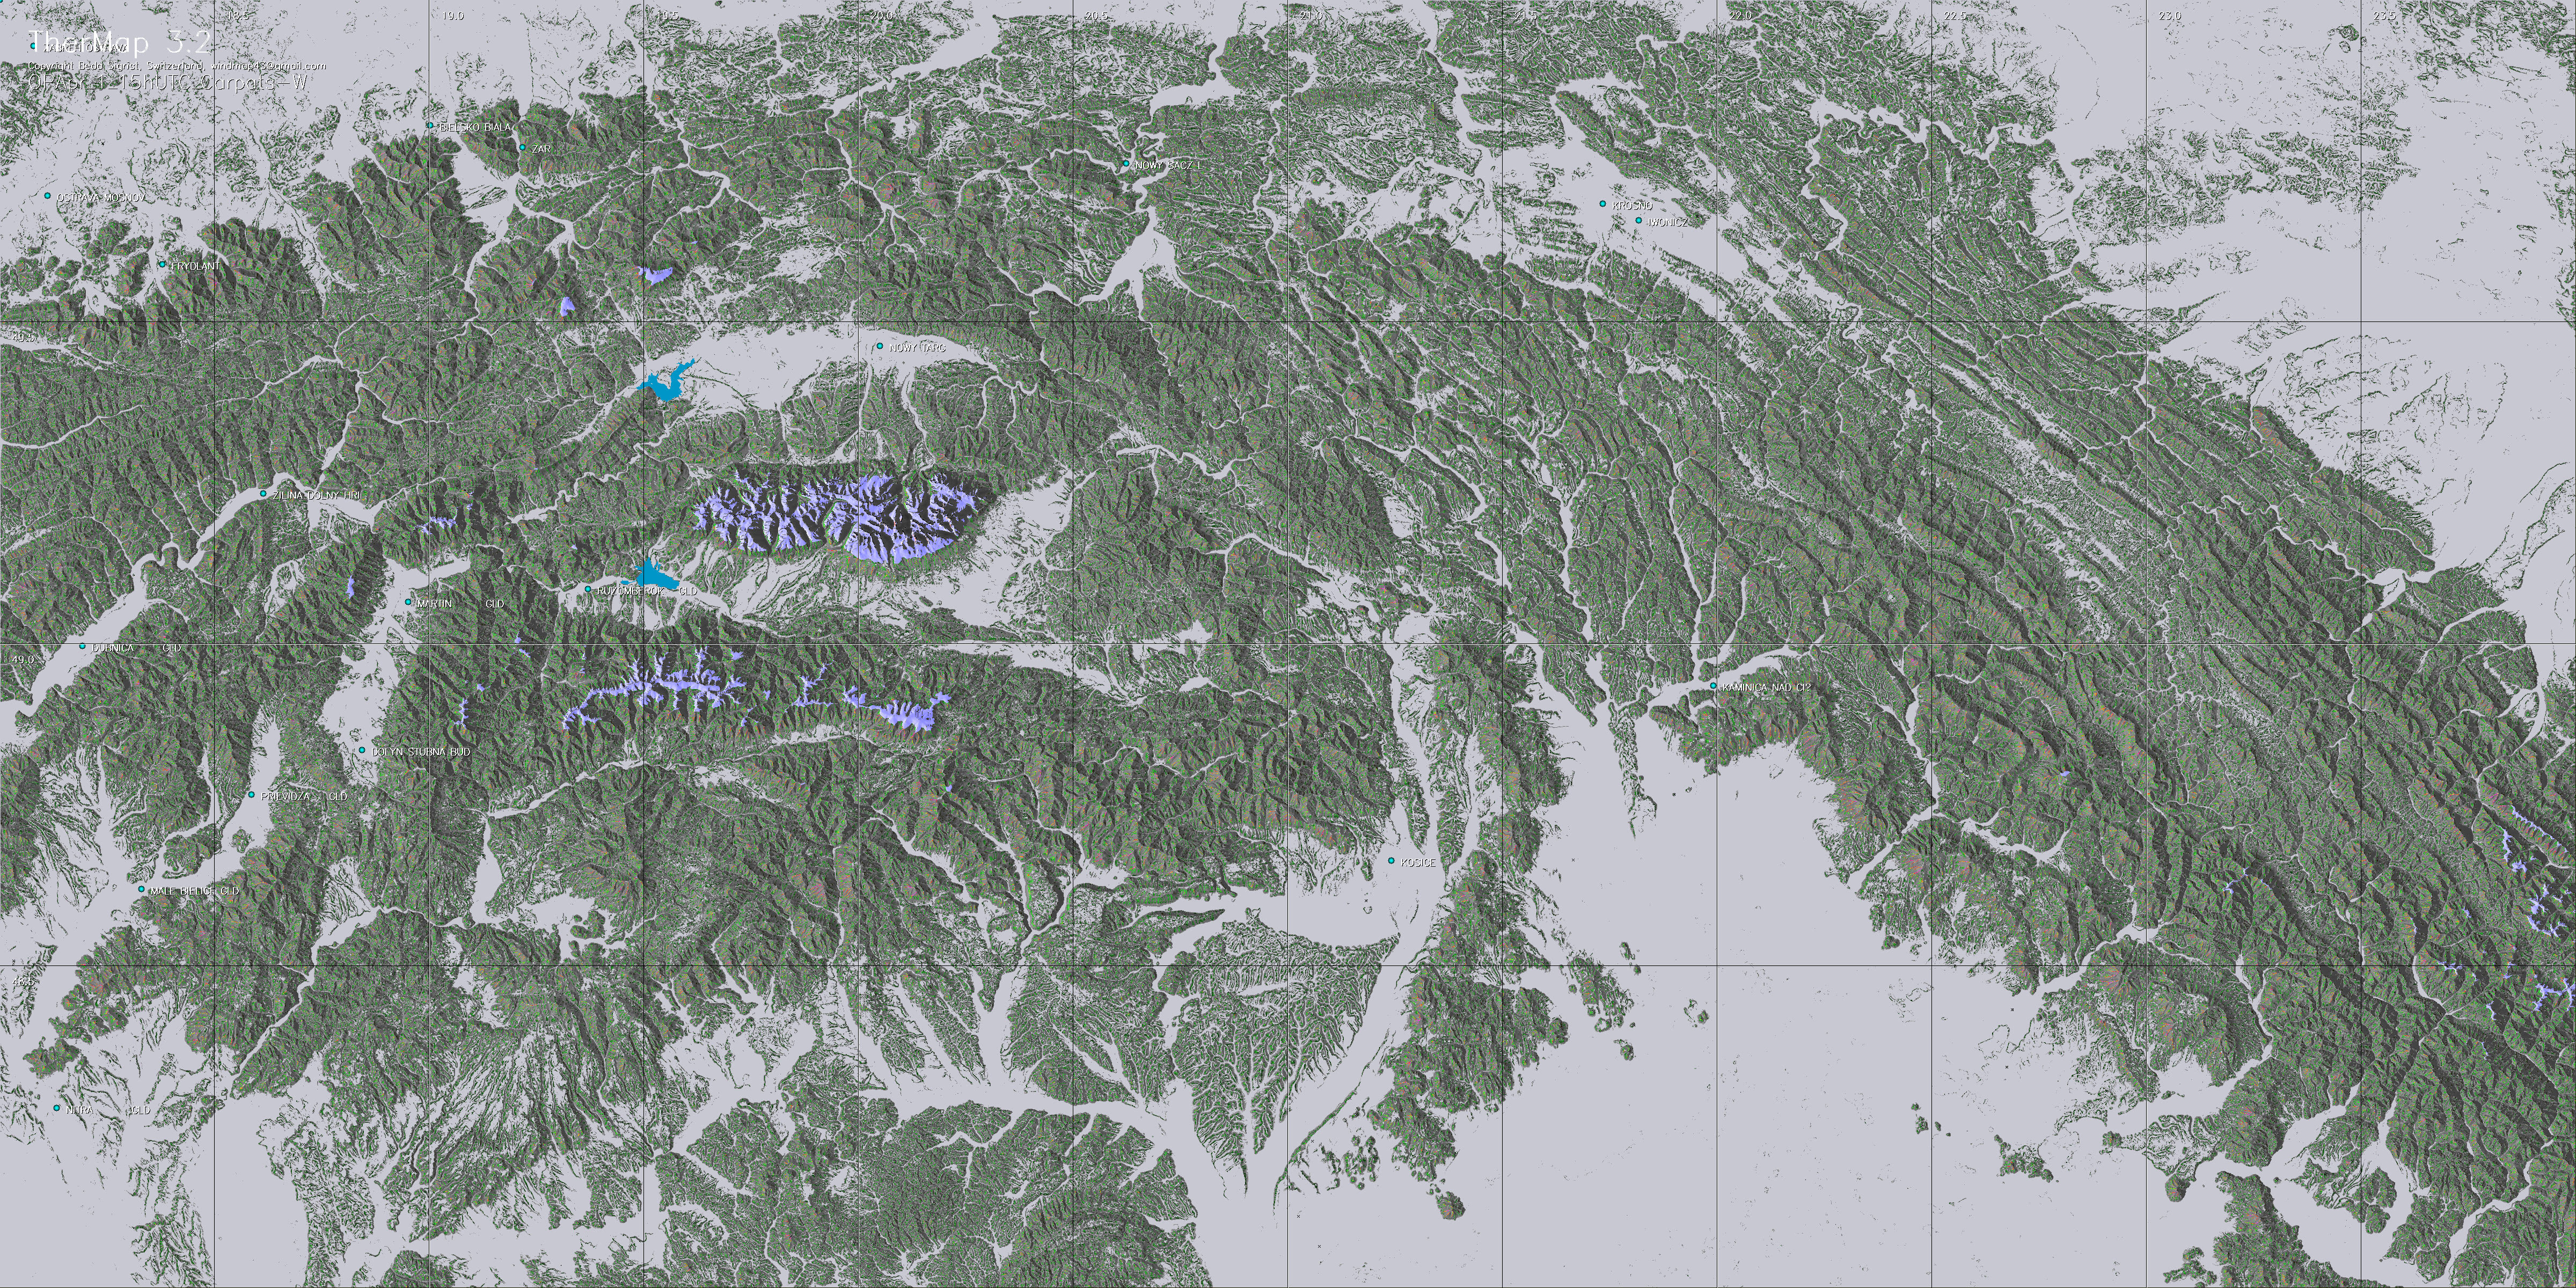
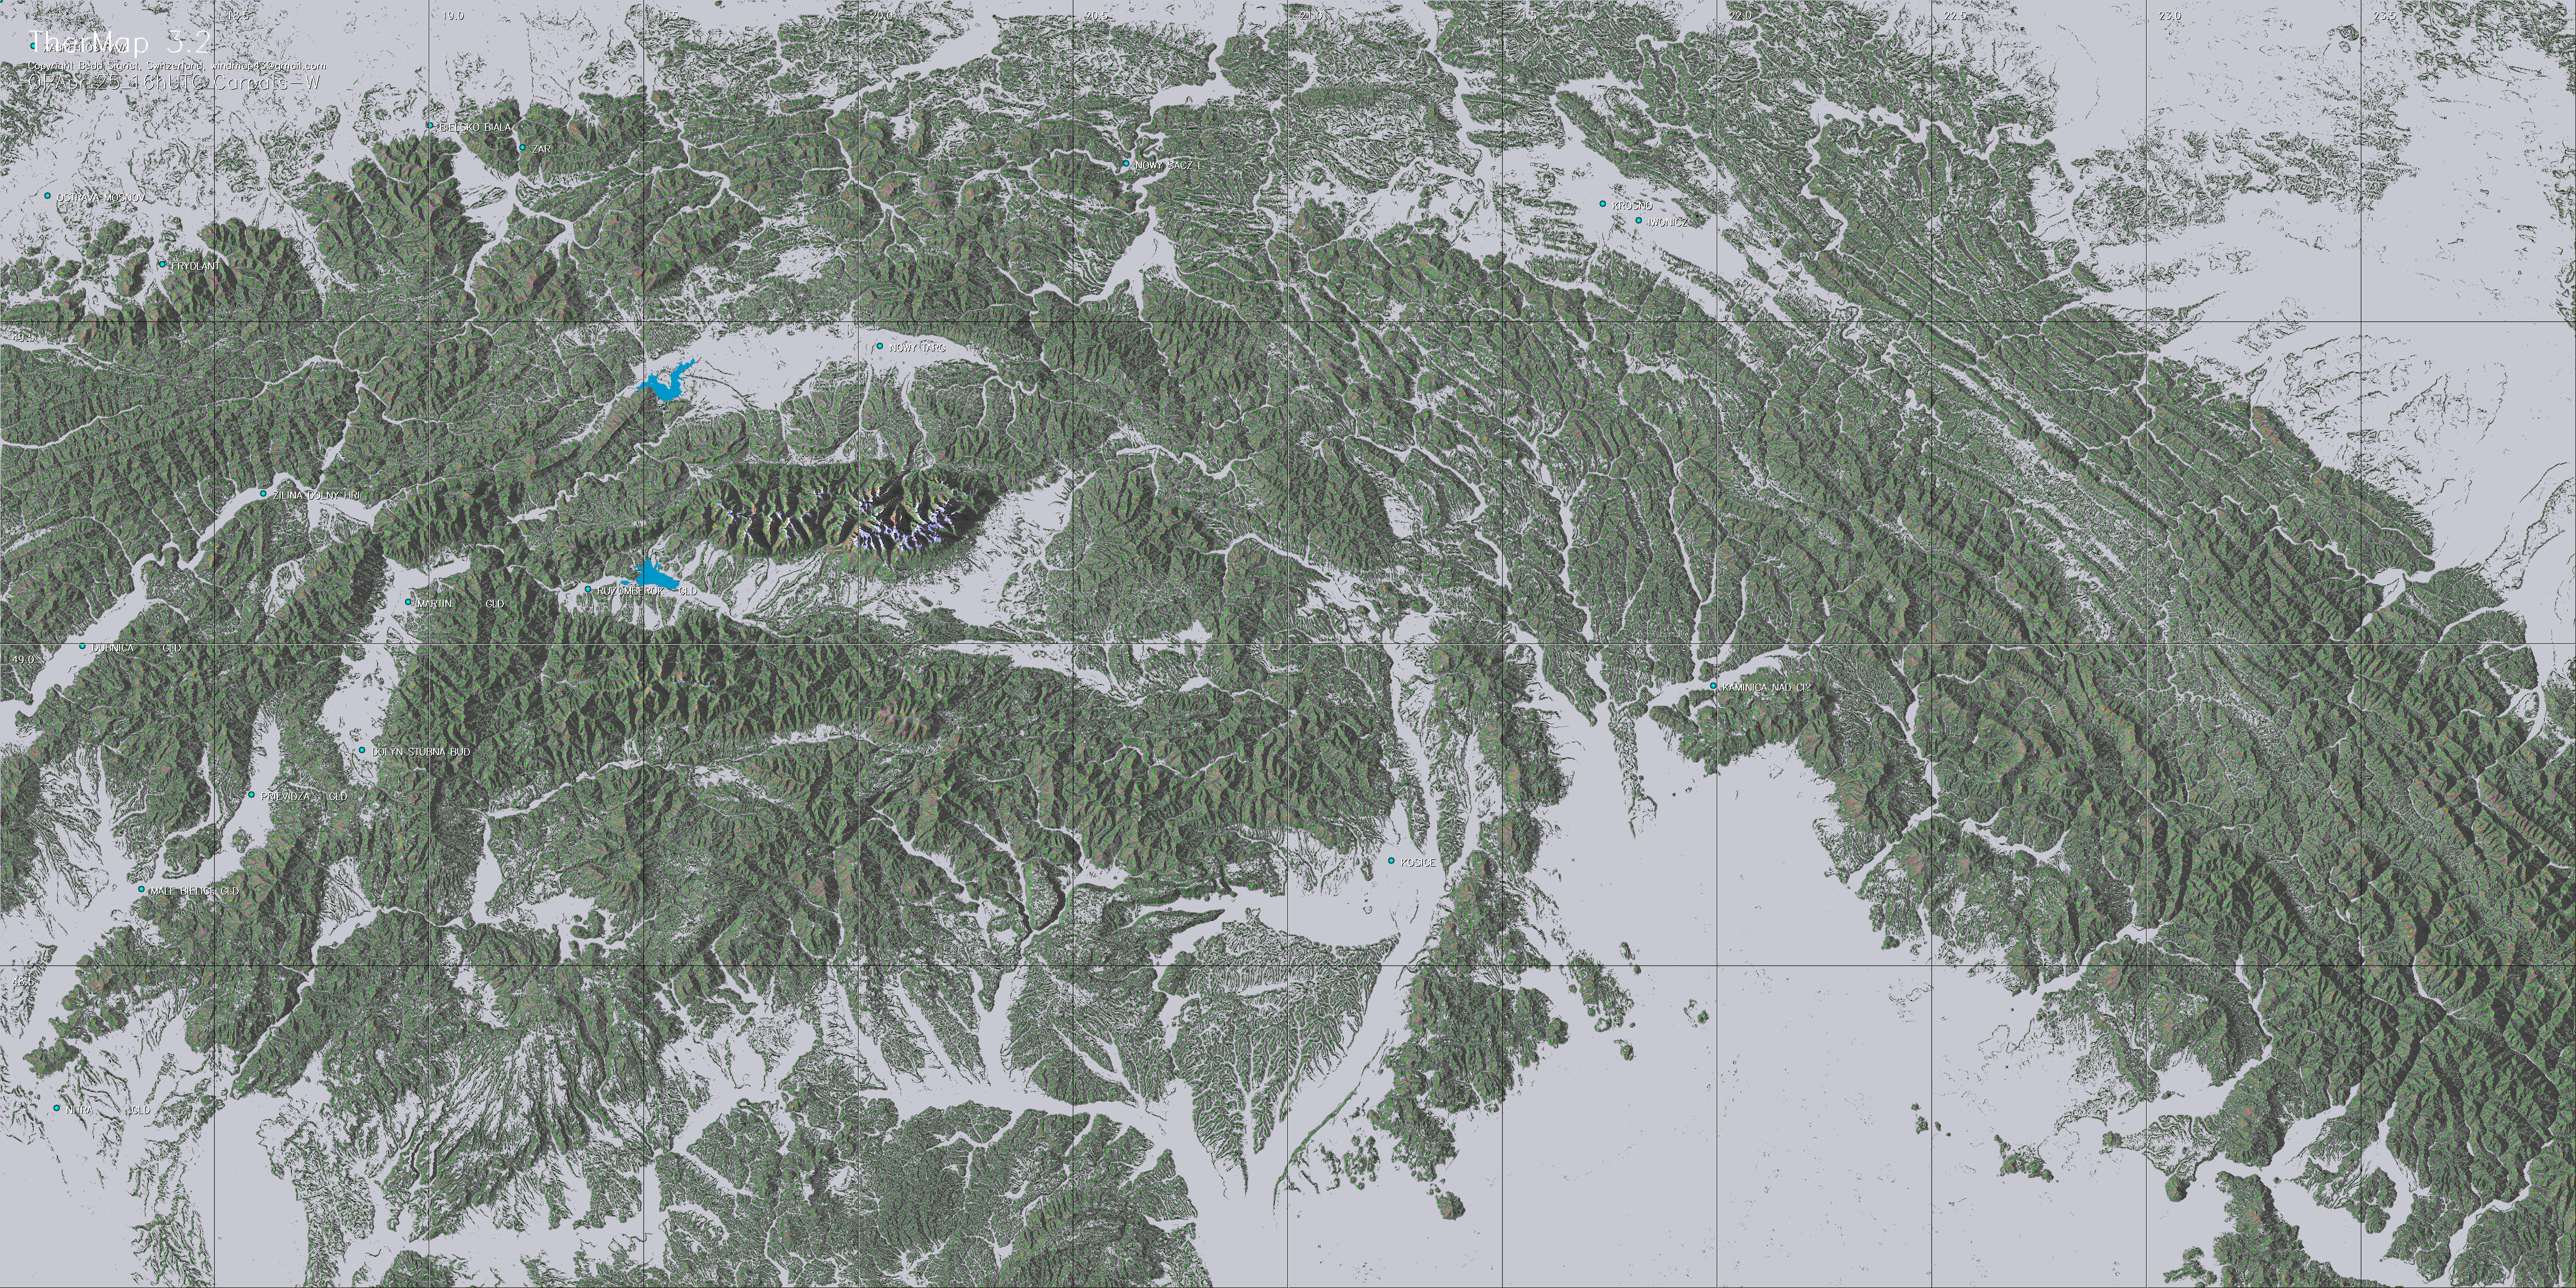
Color coding:
The colors of the temperature and the irradiance maps vary from
green to yellow and finally red. Assuming a glider with a minimum
sinking rate of 0.5 m/sec the colors represent approximately the
expected climbing rates shown on the following graph:
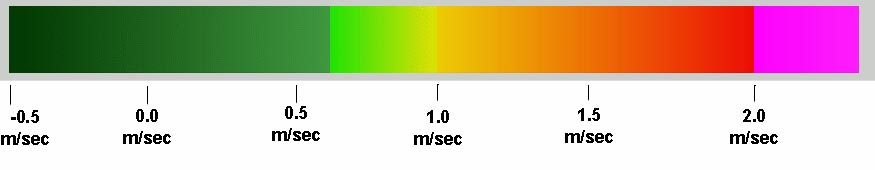 Green areas appear in relatively flat regions
or at the end of the day, and may indicate how to best stretch
a flight path,
Green areas appear in relatively flat regions
or at the end of the day, and may indicate how to best stretch
a flight path,
whereas red colors are typical for mountain hotspots during
the peak hours of the day
-
3D visualization:
Using the Google link below, linking TherMap with Google Earth®
takes only seconds, whereas importing them for instance in
SeeYou® (as raster maps) is more complicated and takes
several minutes. For flight reviews, which can facilitate
the identification of alternative flight paths, several free
conversion programs can be found on the Internet to convert
IGC flight record files into KML files. Upon clicking on the
converted files, these will open with Google Earth®.
-
Meteorology:
TherMap supposes a calculated solar irradiance and a non-stable
atmosphere responding to temperature increases. It is therefore
only usable on sunny days with good meteorological conditions,
i.e. an unstable temperature gradient and a sufficiently high
condensation base. In other words, TherMap is a complementary
tool to meteorological forecasts, but can in no way replace
these. It is up to each pilot to learn and determine, when
the conditions are suitable to make use of TherMap. In case
of predominant winds it may further be worthwhile to consult
WindMap.
-
Checking planned
flight paths: TherMap is best used before the flight
to check the local conditions at the expected time of overflight
(e.g. when to change to the other side of a valley) and to
note possible alternatives in case of unexpected changes.
-
In-flight use of TherMap:
Consulting a map during the flight must not interfere with
the necessary observation of the flight space. Tests with
mobile navigation devices, into which TherMap hotspots
had been imported, have shown that this represents a risky
distraction from flight observation, further aggravated
by the poor readability of most displays. However even with
better displays, the mobile tools should be designed to
automatically show the hotspots valid at the actual time,
to avoid manual file manipulations distracting the pilot.
-
This requires the flight
tracks to be traced on the maps closest to the date and time
of the flight. Besides identifying possible alternative flight
paths, such analyses also help to better interpret TherMap.
Due to the ease of activating the maps on Google Earth, the
latter tool is preferable for such analyses, because it does
not require importing (raster) maps into flight planning application.
On the other hand, the latter tools offer the known additional
features of these specialized tools.
If needed, the following links open guidelines for making
such analyses either with SeeYou
or Google Earth
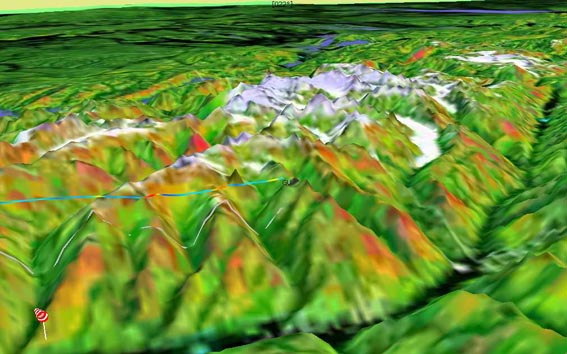
Color coded thermal pressure map in 3D-view
with vario-flighttrack
(reproduced using SeeYou© on the basis of an imported thermal
pressure map)
d. Limitations of TherMap
approach
-
Limitations of
radar maps: Radar reflection signals are not perfectly
precise when scanning altitudes (precision is about 5 meters).
They are particularly unreliable when reflected by water
or ice. This it why it is difficult to automatically identify
lakes on the basis of radar scan data. In TherMap many lake
outlines have therefore been imported separately, but these
imports had to be limited, due to the manual effort involved,
and hence not all lakes are displayed. Some ice covered
surfaces appear blurred. Fortunately neither of these limitations
seems to limit the use of the maps.
-
Wind drift:
The further away the glider is from the ground , the more
its flight path may be shifted by the wind drift. Such shifts
can be visible on TherMap flight tracks on a windy day.
-
Borders of plains:
Air heated over plains can be shifted by slight wind until
hitting a small edge or elevation, thereby triggering a
thermal. At present TherMap does not well map such locations.
-
Other effects:
TherMap only shows the solar heating effect causing thermals
on slopes. At certain locations other effects can however
be stronger than the thermals, e.g. due to cloud covers,
or wind, particularly at narrow valley entrances, but also
where the air is cooled or moistened by lakes or ice covered
surfaces.

|
Country/Region
|
Northwest
Corner
|
Southeast
Corner
|
|
Switzerland
|
48° 00'’
N / 05° 30’ E
|
45° 30'’
N / 11° 00’ E
|
|
Austria
|
48° 00'’
N / 09° 30’ E
|
46° 00'’
N / 16° 20’ E
|
|
French Alps
|
47° 30'’
N / 05° 00’ E
|
43° 00'’
N / 07° 30’ E
|
|
Pyrenees
|
43° 20'’
N / 03° 00’ W
|
42° 00'’
N / 02° 30’ E
|
|
Northern Apennine
|
45° 00'’
N / 07° 30’ E
|
43° 30'’
N / 12° 30’ E
|
|
Central Apennine
|
43° 30'’
N / 11° 30’ E
|
41° 00'’
N / 15° 00’ E
|
|
Slovakia
|
48° 00'’
N / 18° 00’ E
|
50° 00'’
N / 24° 00’ E
|
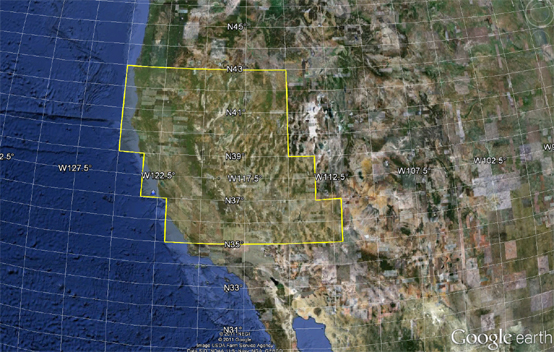
United States
|
Country/Region
|
Northwest
Corner
|
Southeast
Corner
|
|
US Sierra Nevada Very
North
|
43° 00'’
N / 125° 00’ W
|
41° 00'’
N / 115° 00'’ W
|
|
US Sierra Nevada North
|
41° 00'’
N / 125° 00’ W
|
39° 00'’
N / 115° 00'’ W
|
|
US Sierra Nevada Center
|
39° 00'’
N / 123°30’ W
|
37° 00'’
N / 113°30'’ W
|
|
US Sierra Nevada South
|
37° 00'’
N / 122° 00’ W
|
35° 00'’
N / 112° 00'’ W
|
| Country
: |
Depending on the flight you may have
to select one or more of the countries or regions
|
| Date
: |
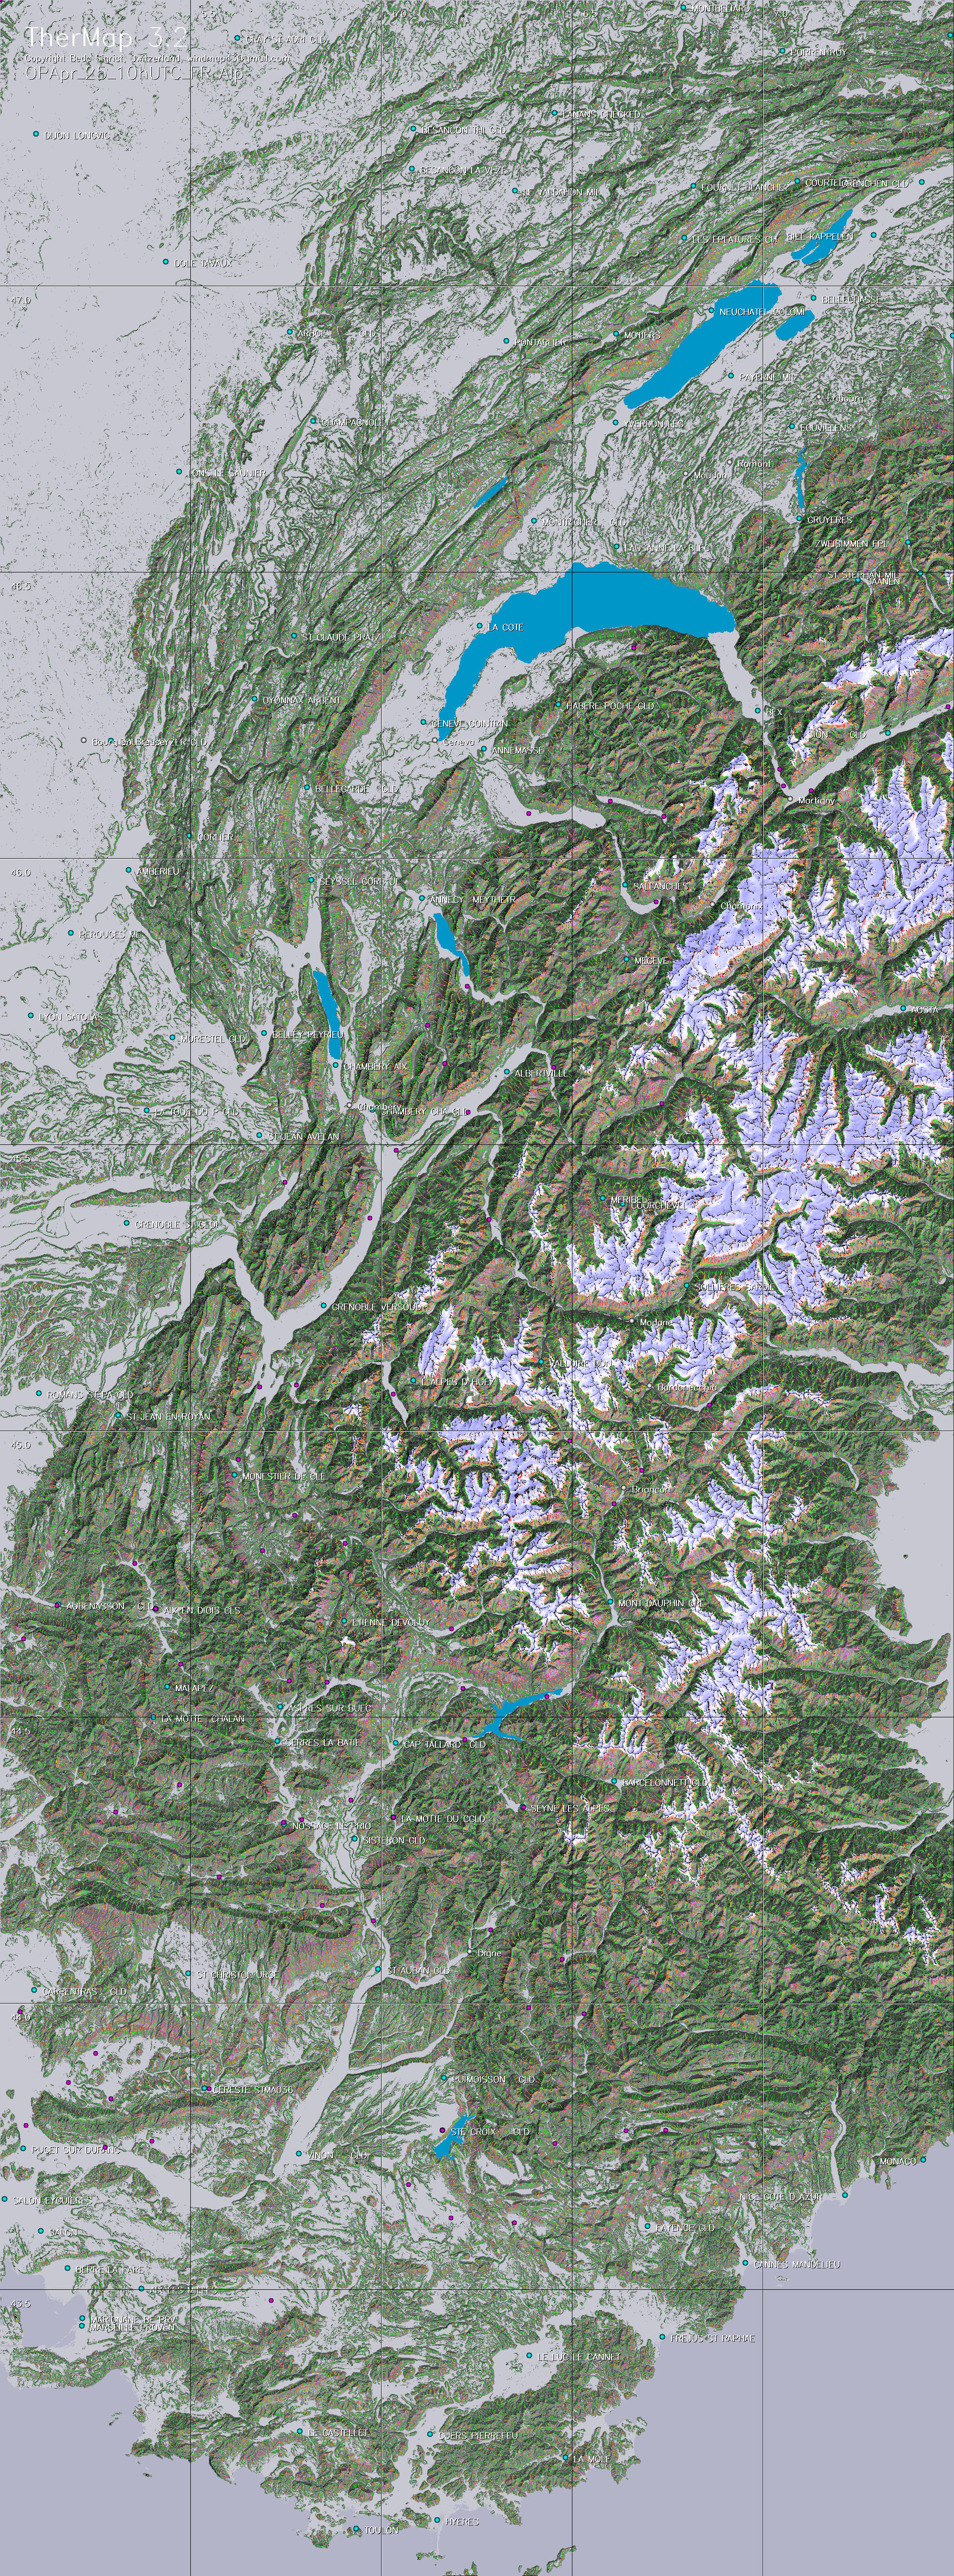
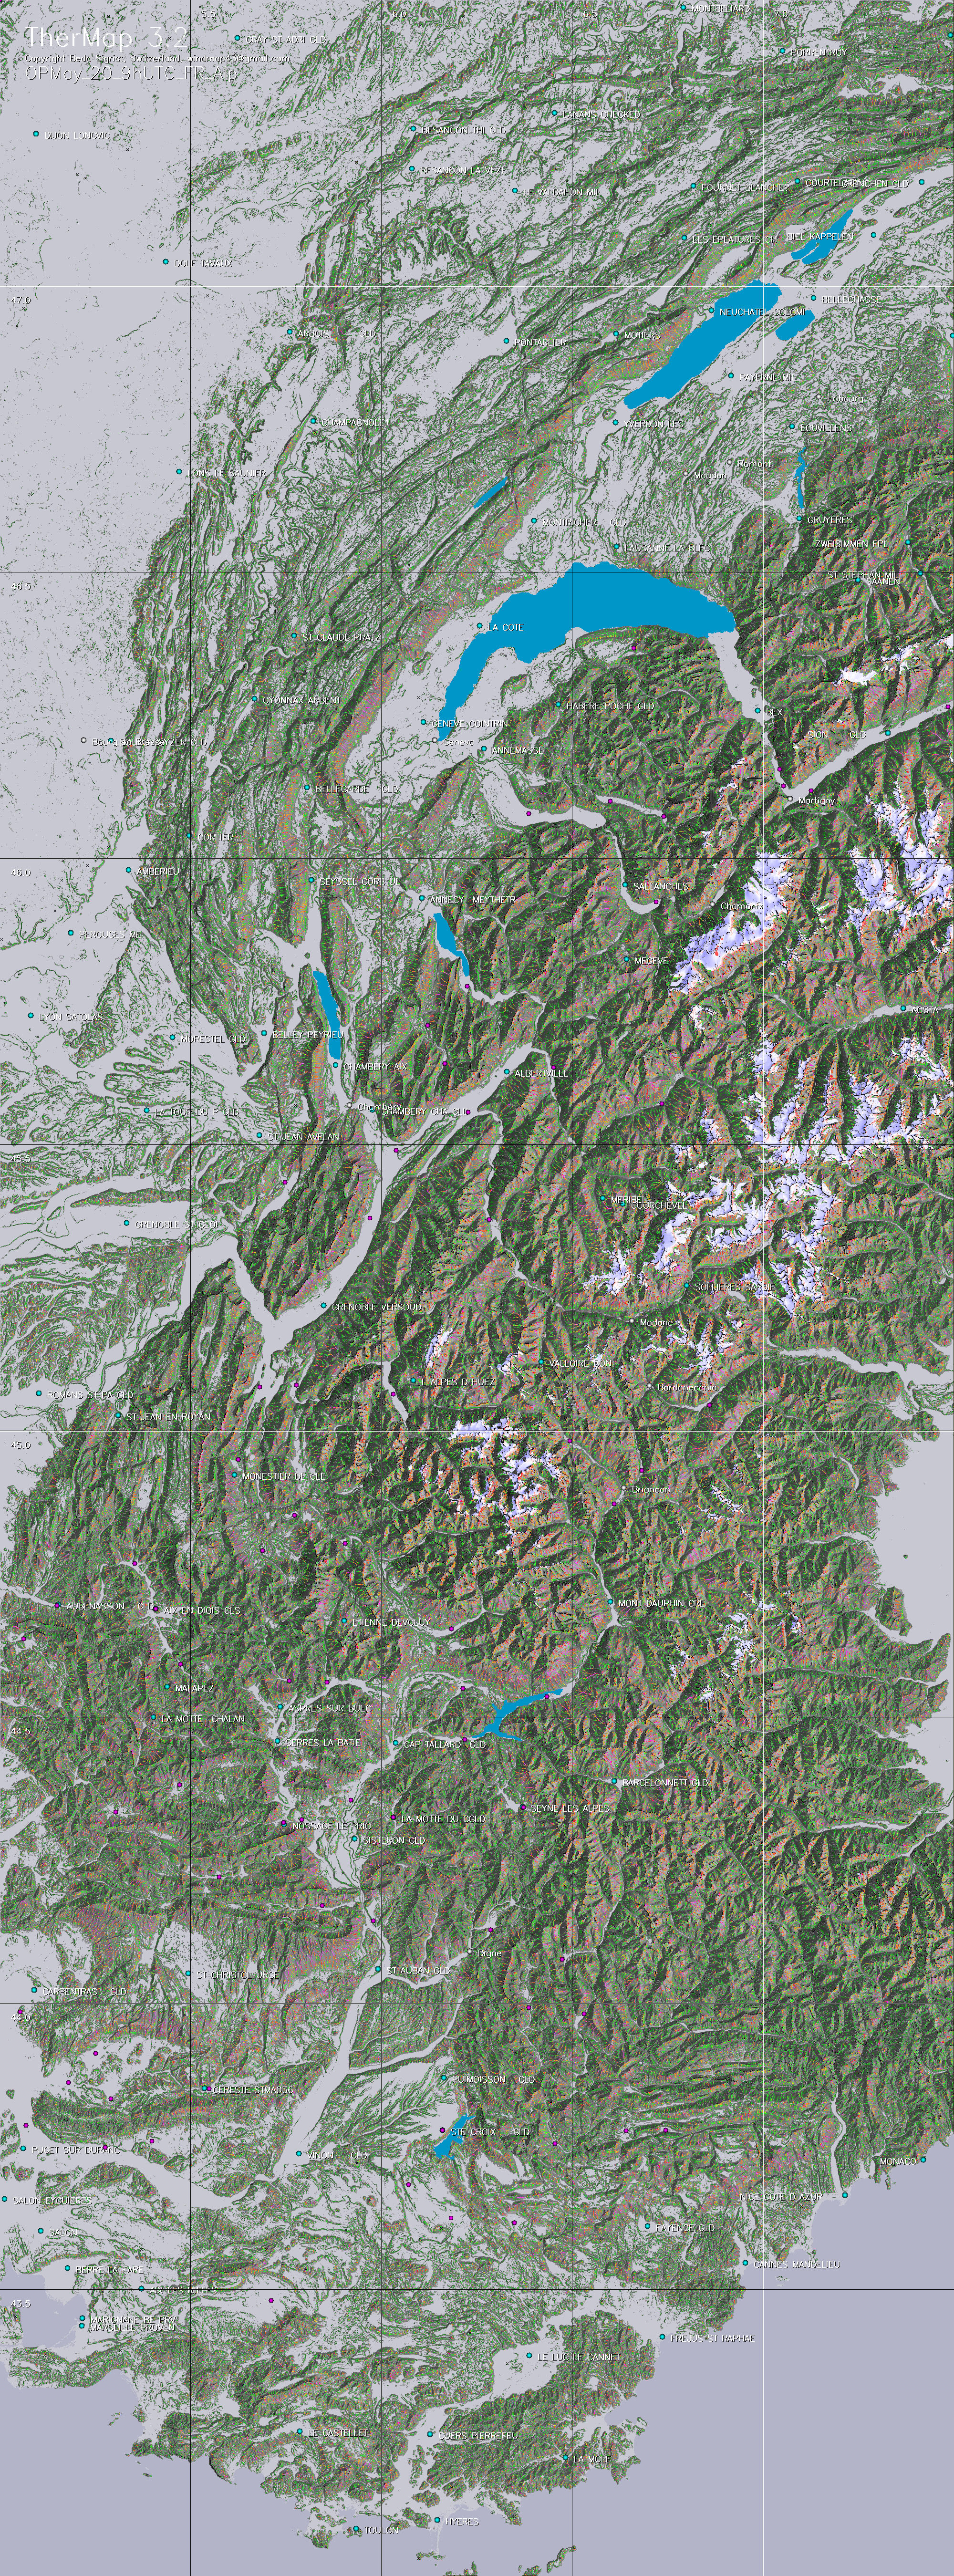
TherMap
provides maps of selected dates from the beginning of
April to the middle of September (Months 4 to 9). Select
the maps showing the date closest to the flight date.
The map date/time is included in its file name (month-day-hrZ) |
| Time: |
UTC is now generally
used, whereby 3 map times per day have been included
in the map collection, namely one for the latest full
hour before the highest elevation of the sun, and two
others for the beginning and the closing of the thermal
day. It would of course be possible to add more maps
for the timnes between these reference hours.
UTC is normally also used in the flight
records. Select the map closest to the time of overflight.
A longer flight will therefore require several maps.
This also applies to flight analyses, for which we
recommend however to make use of the Google Earth
overlays of TherMap.
|
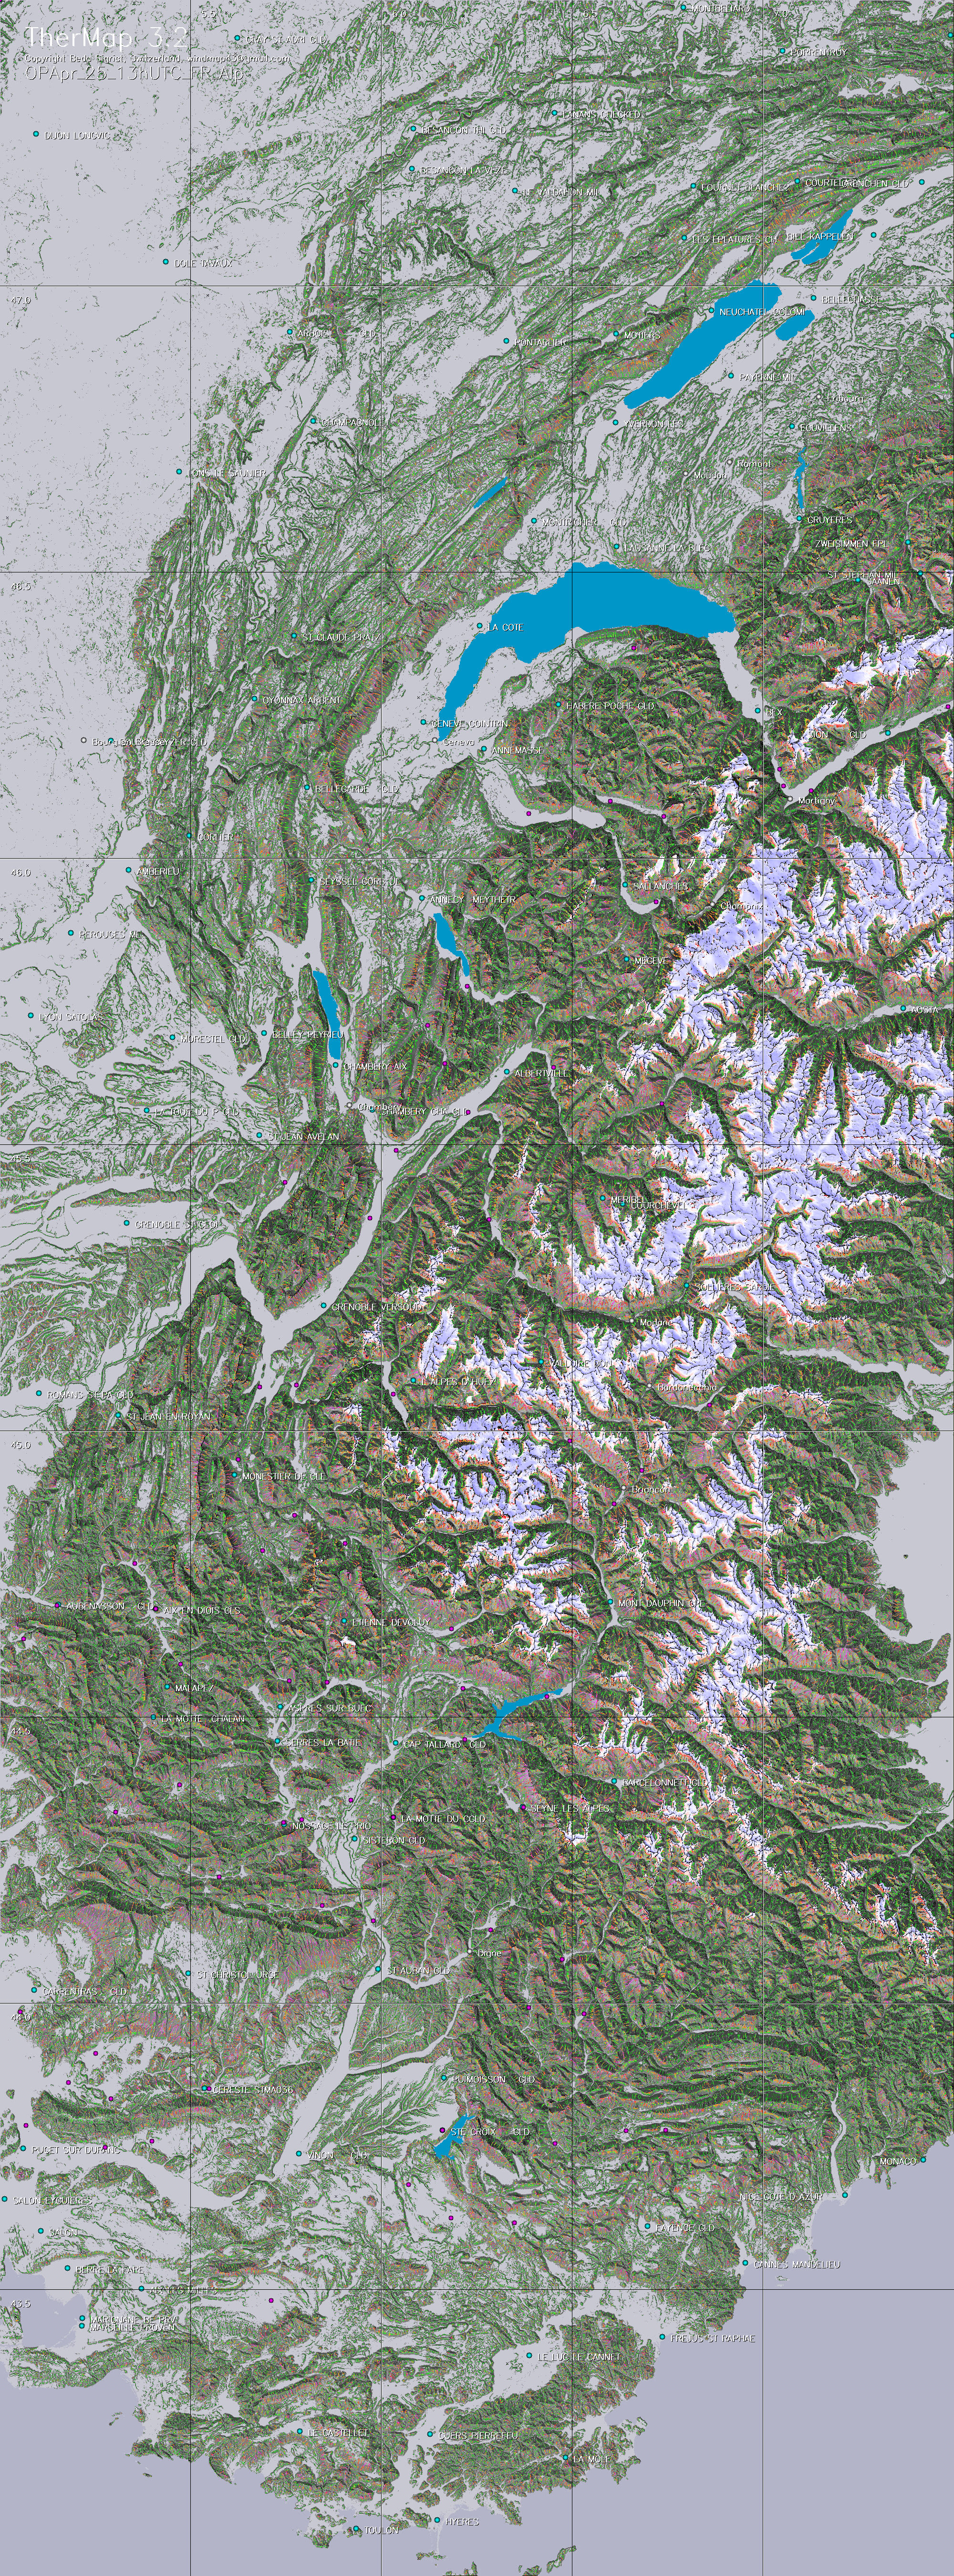
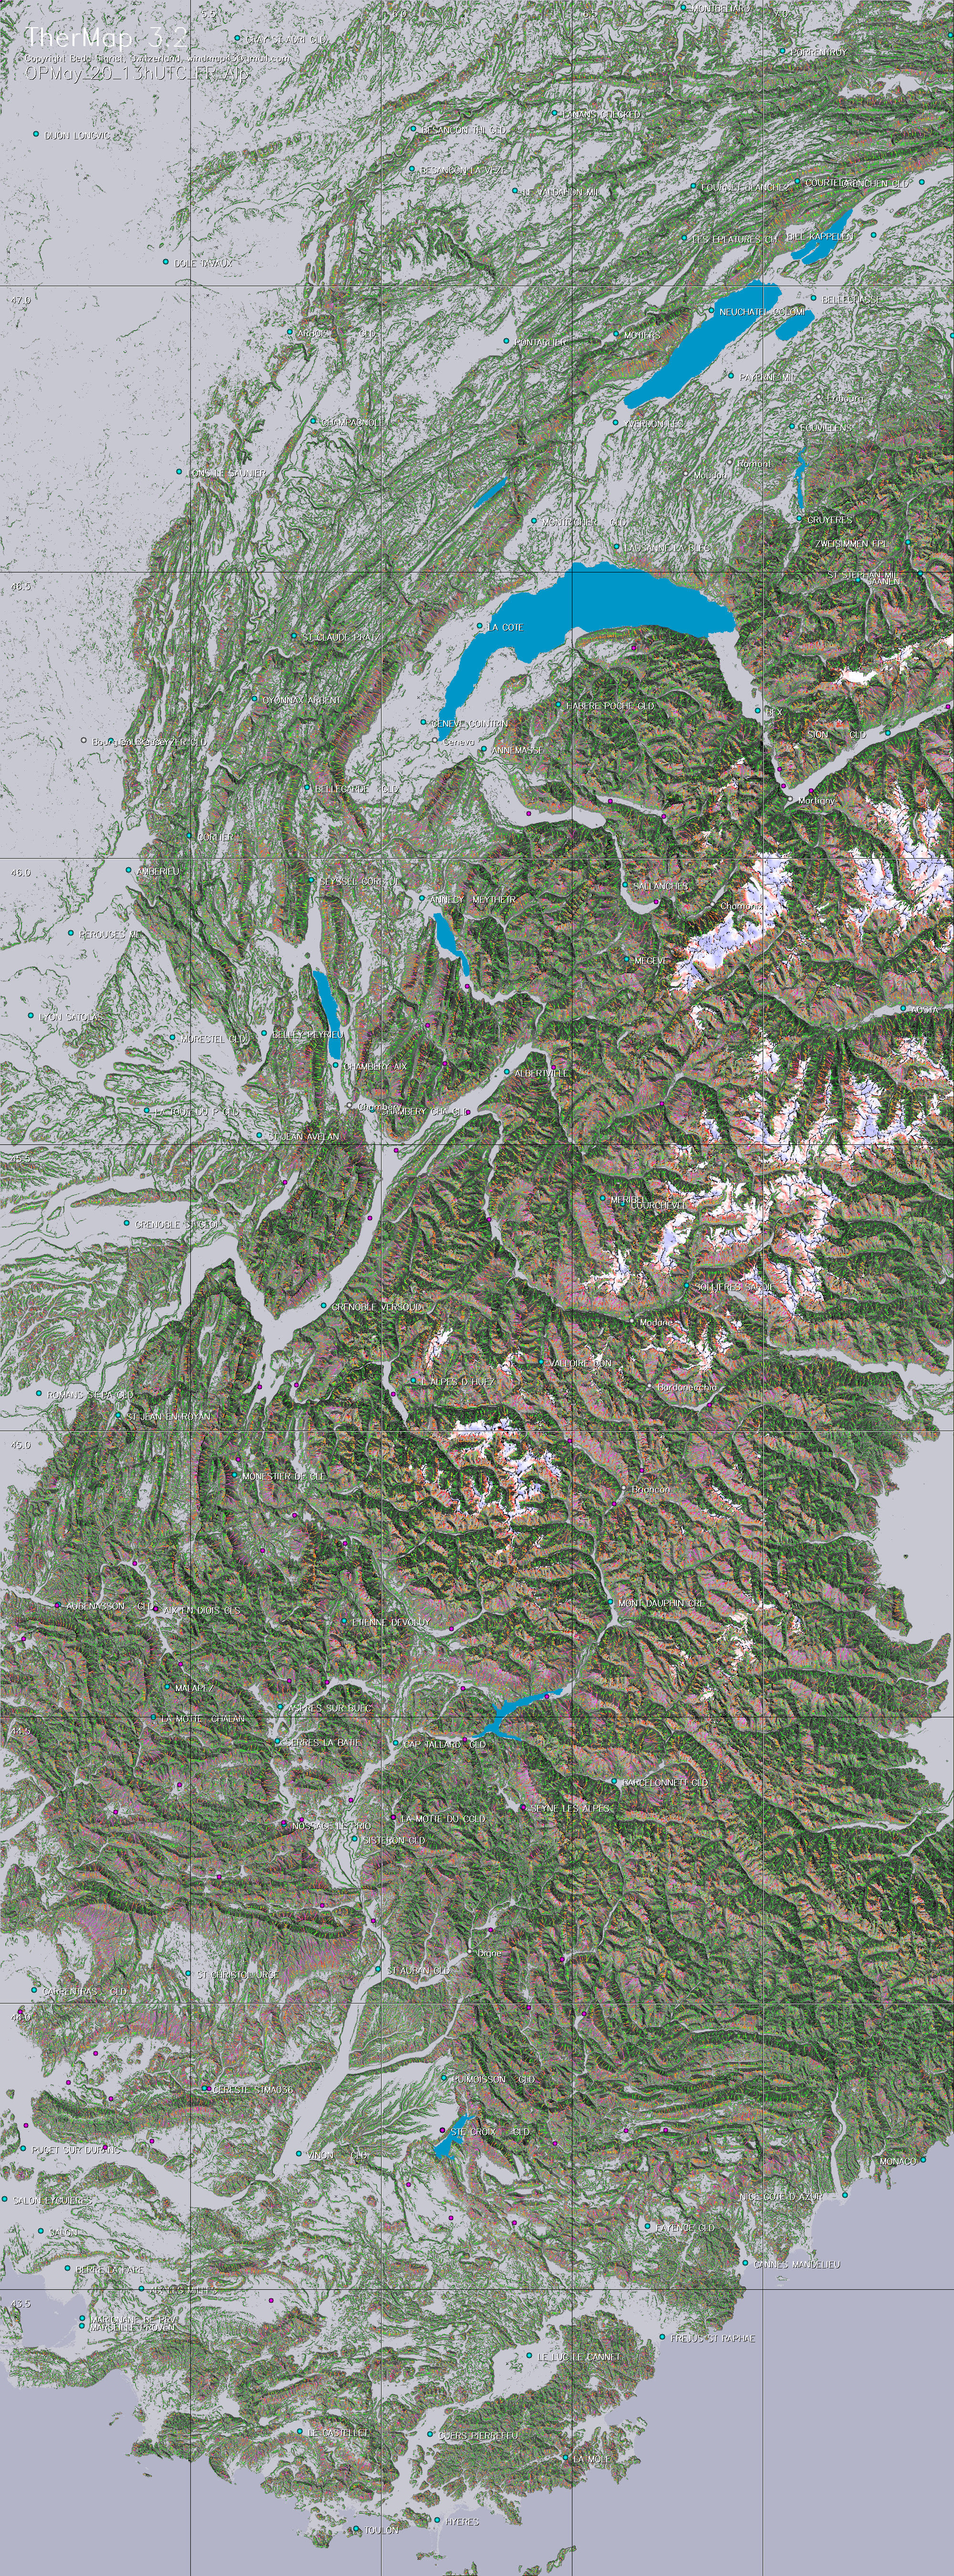
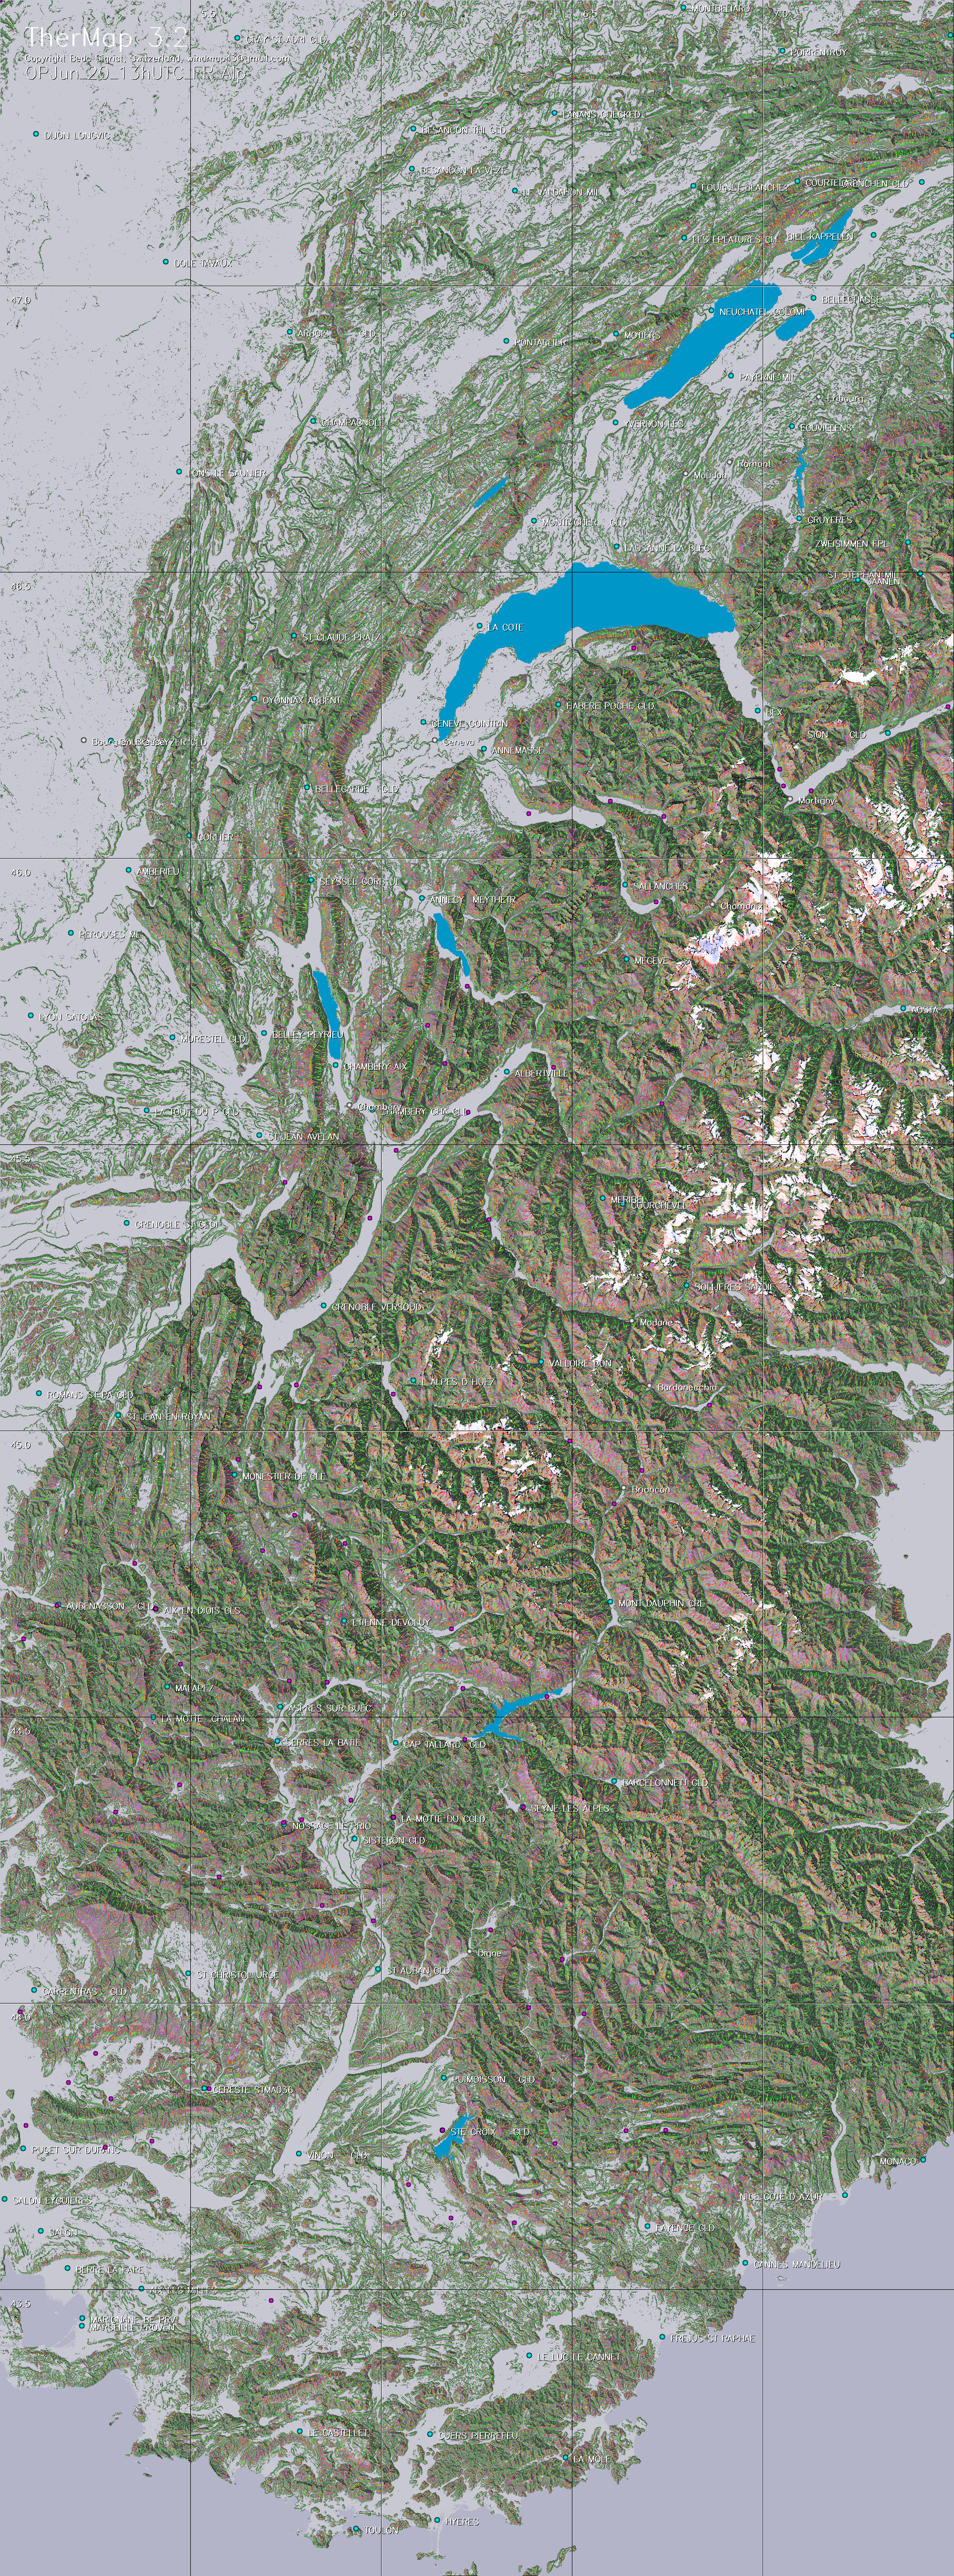
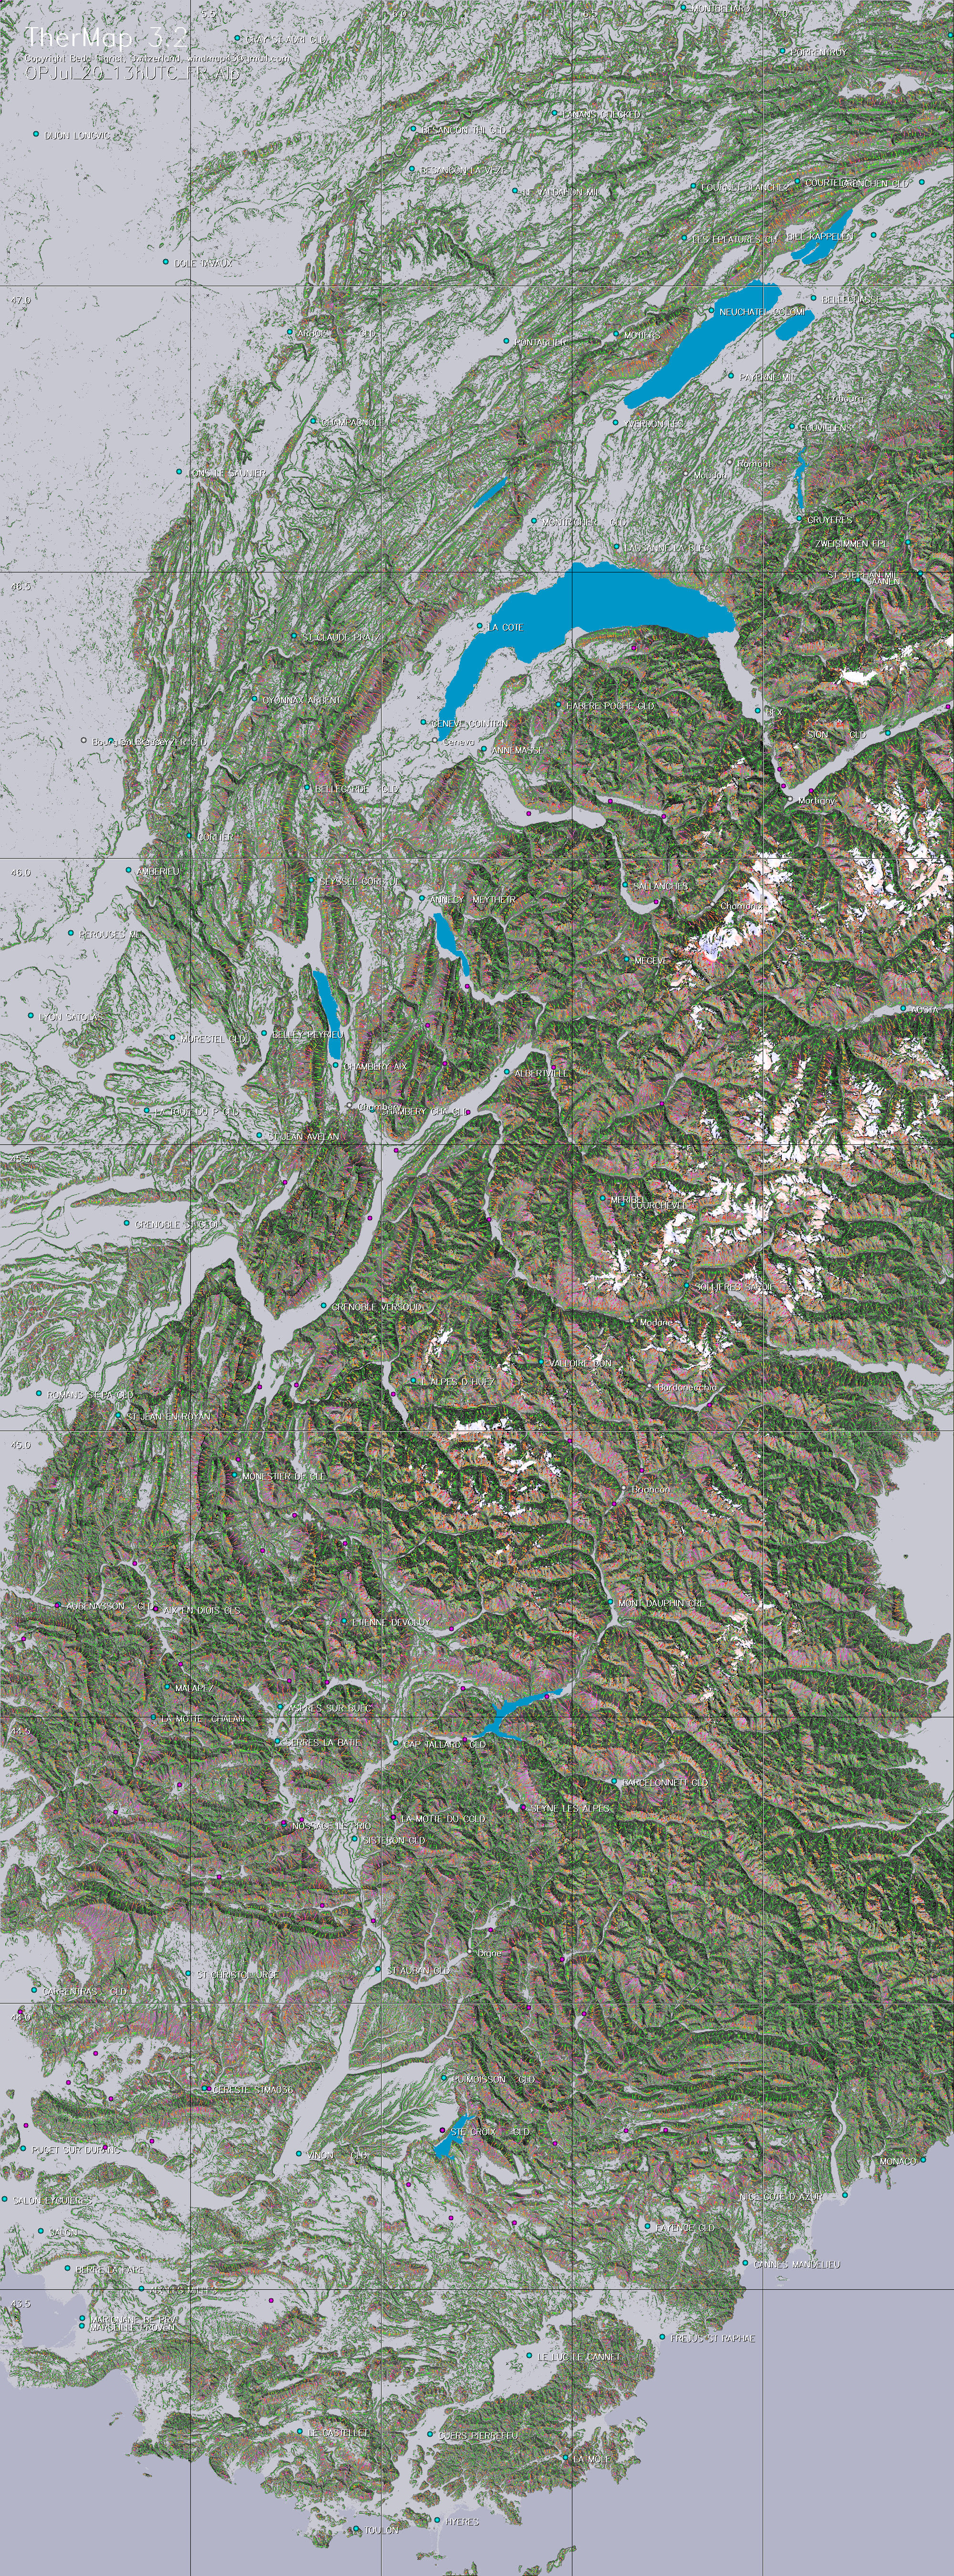
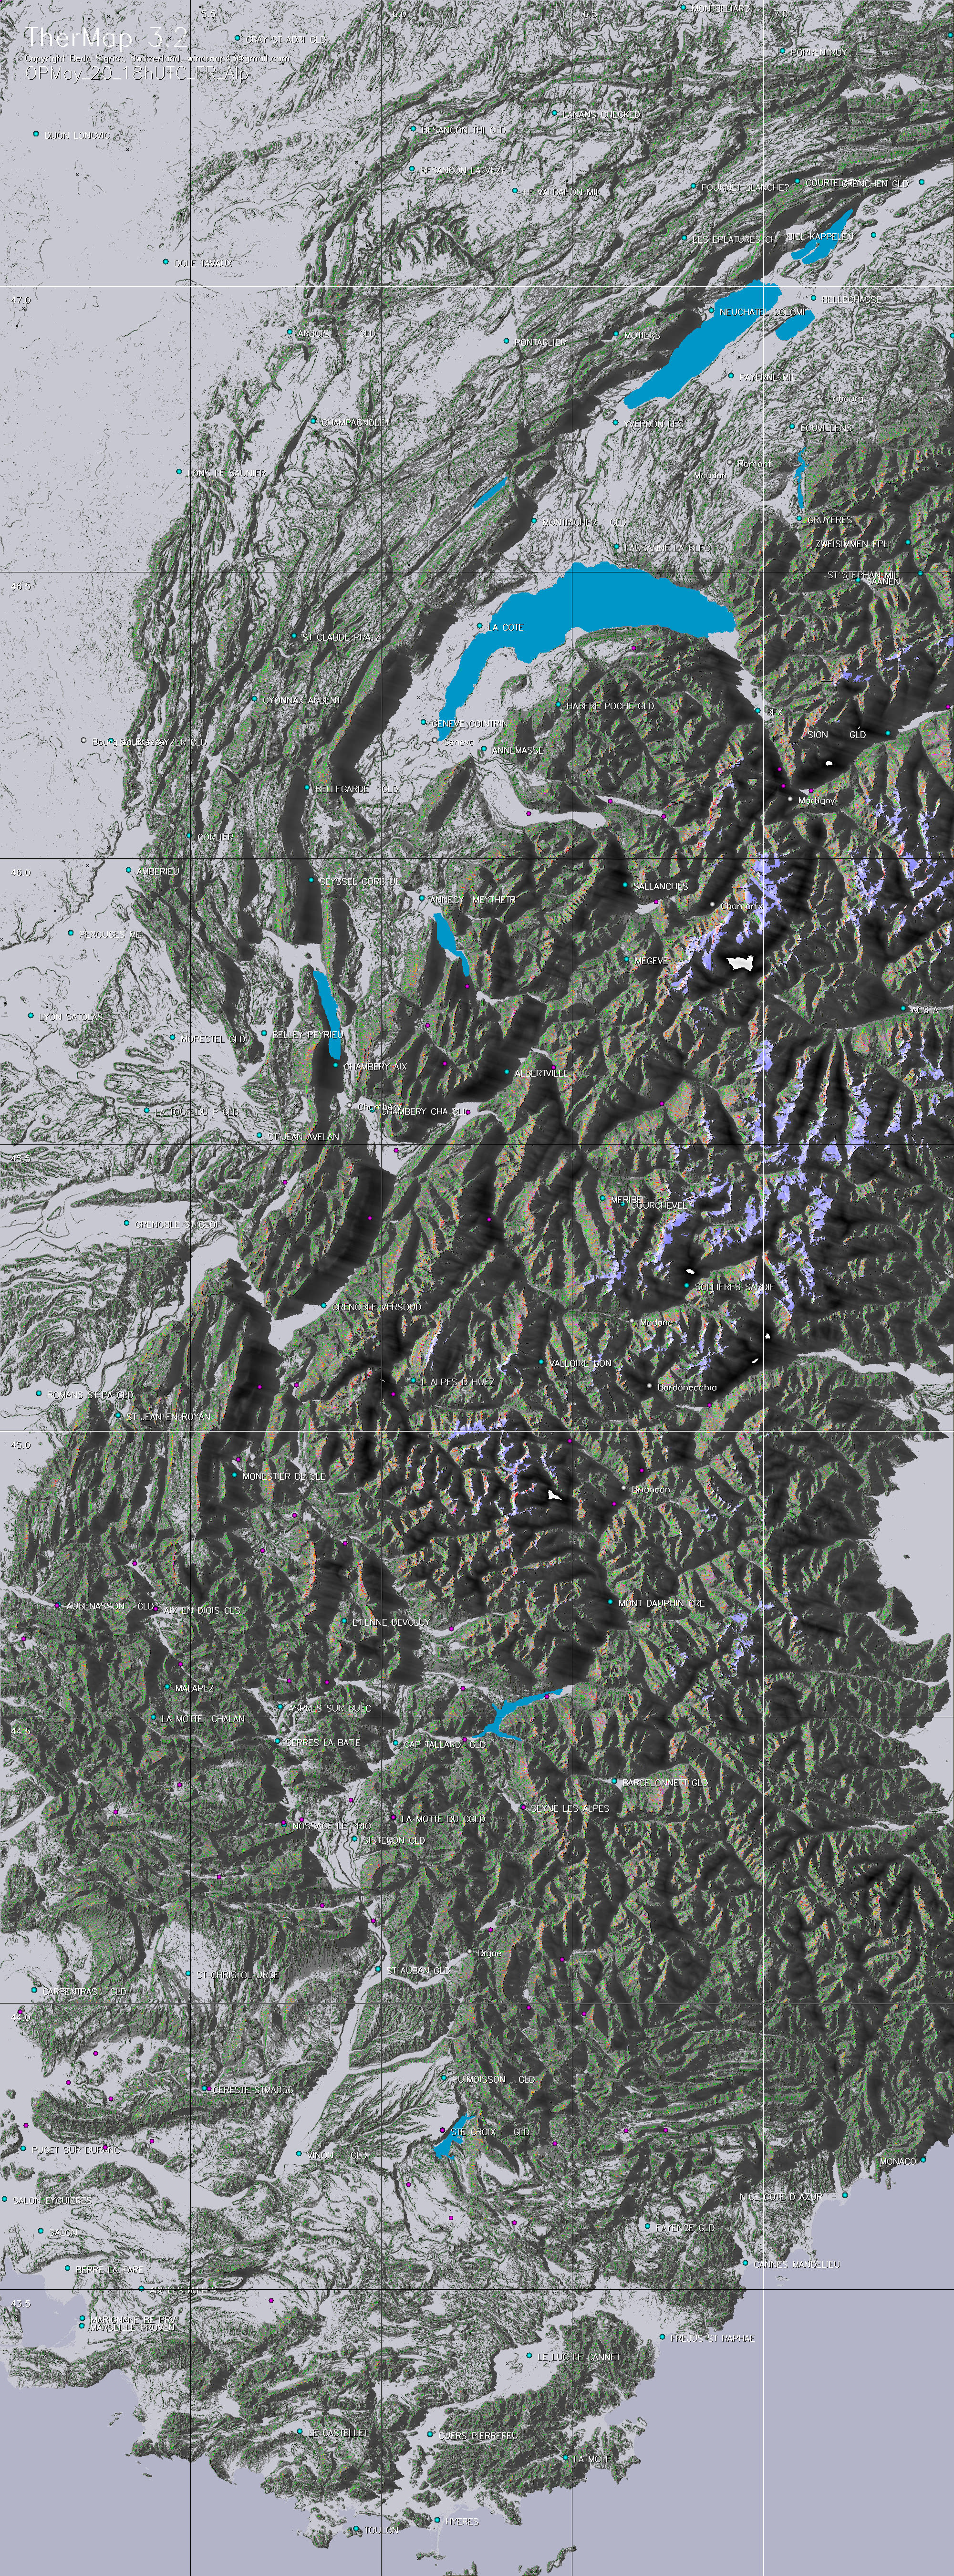
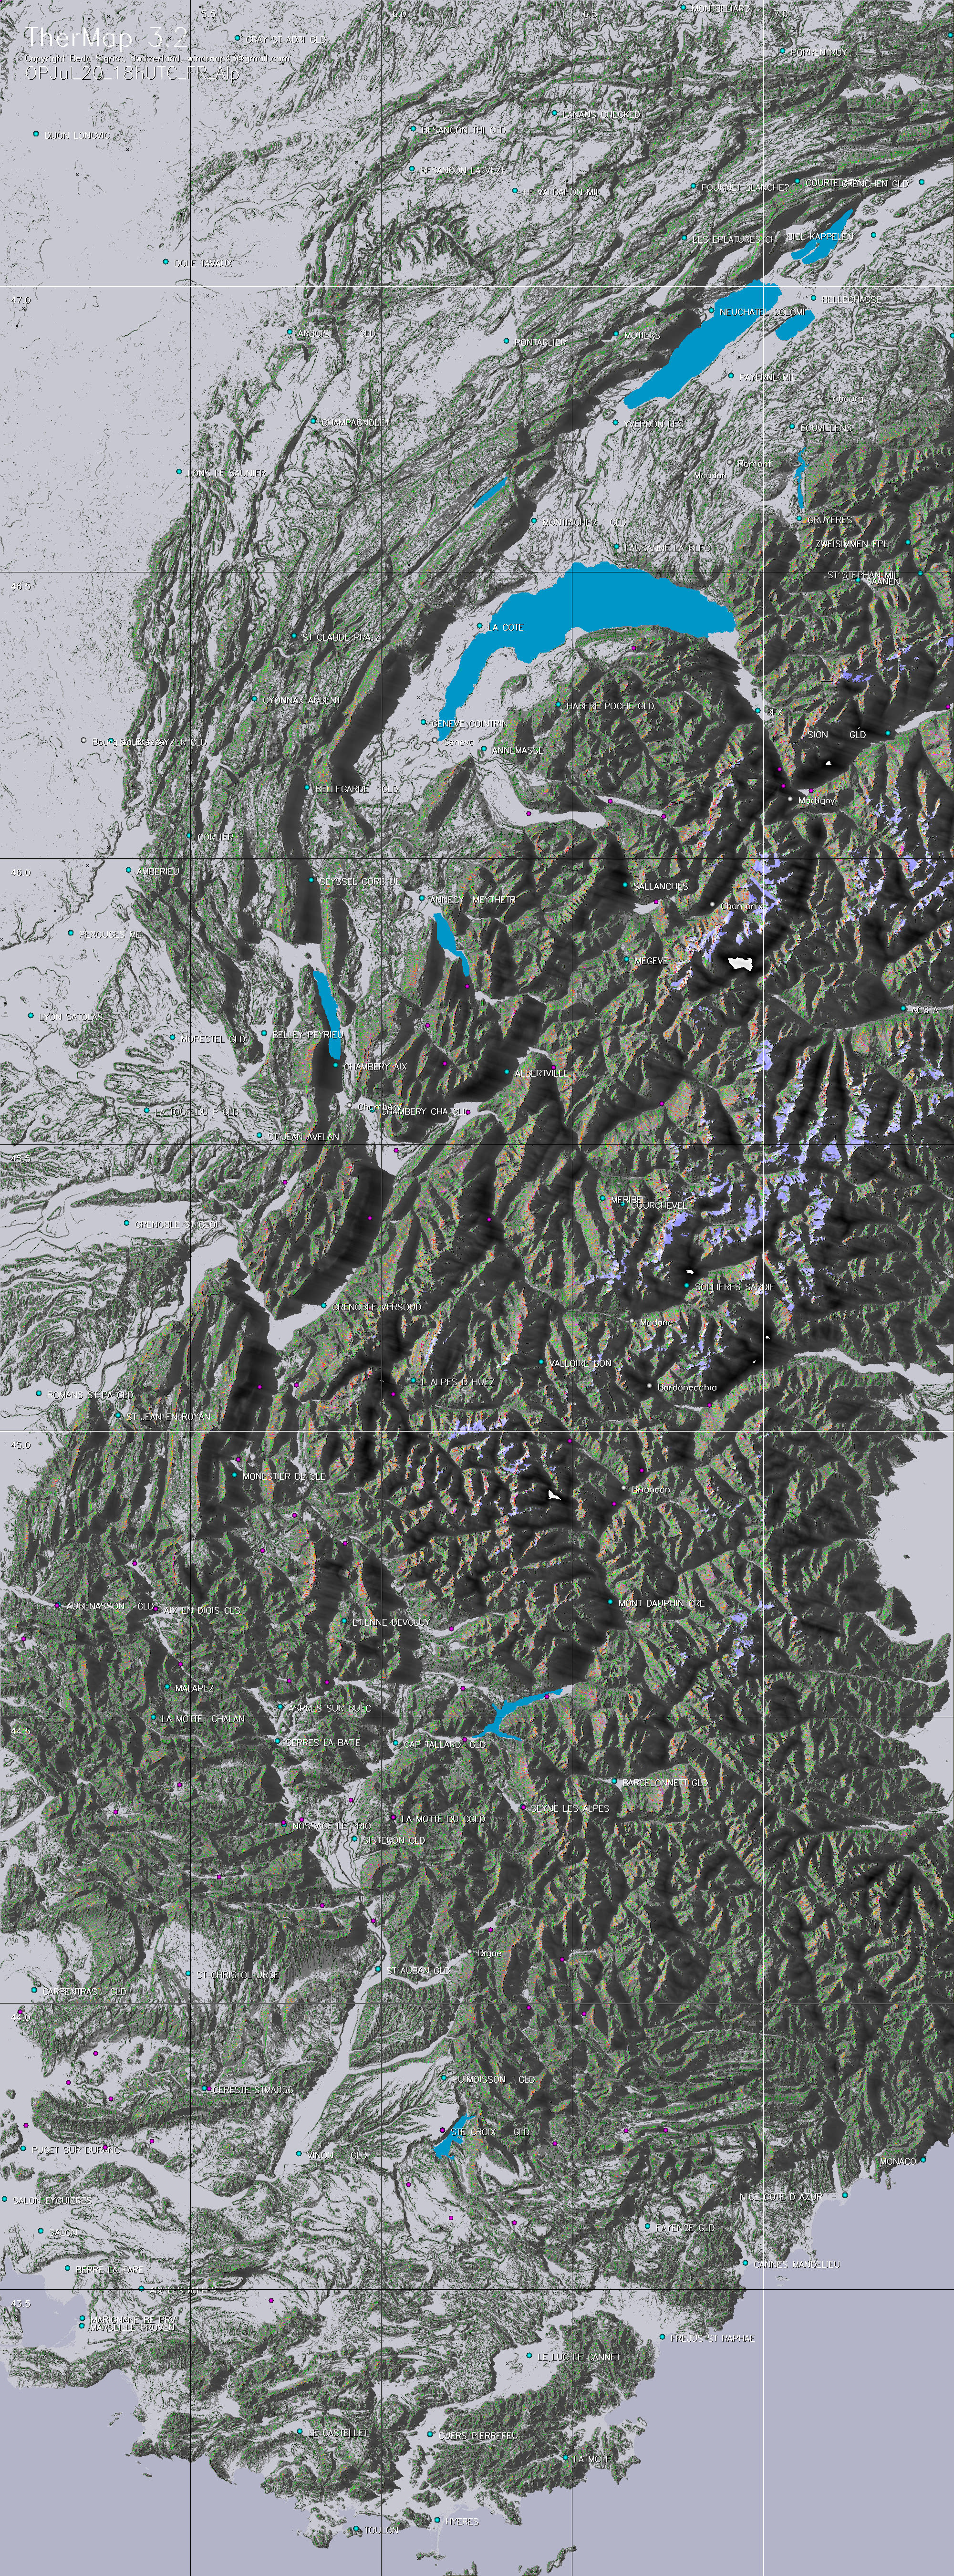
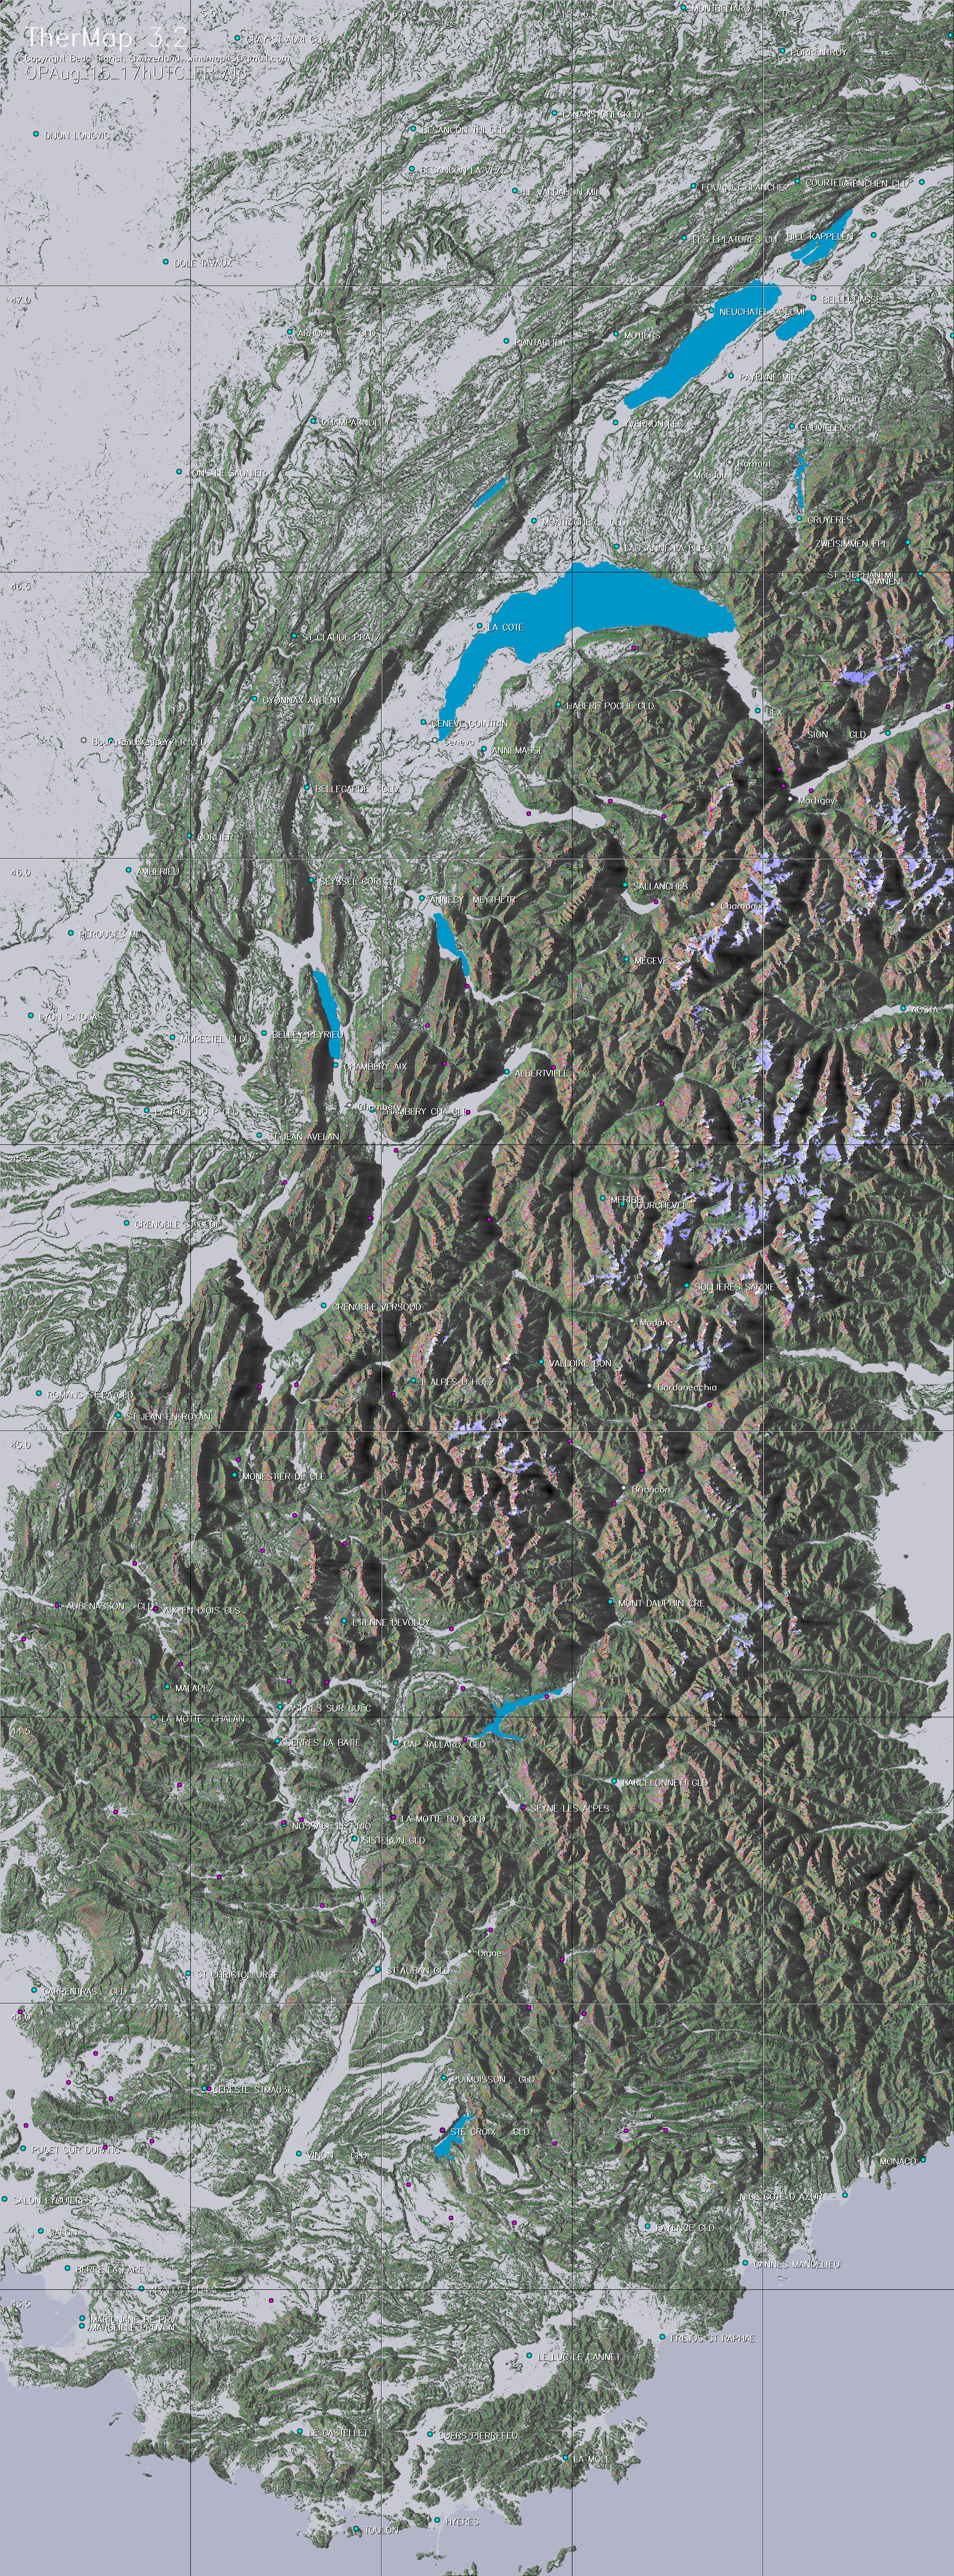
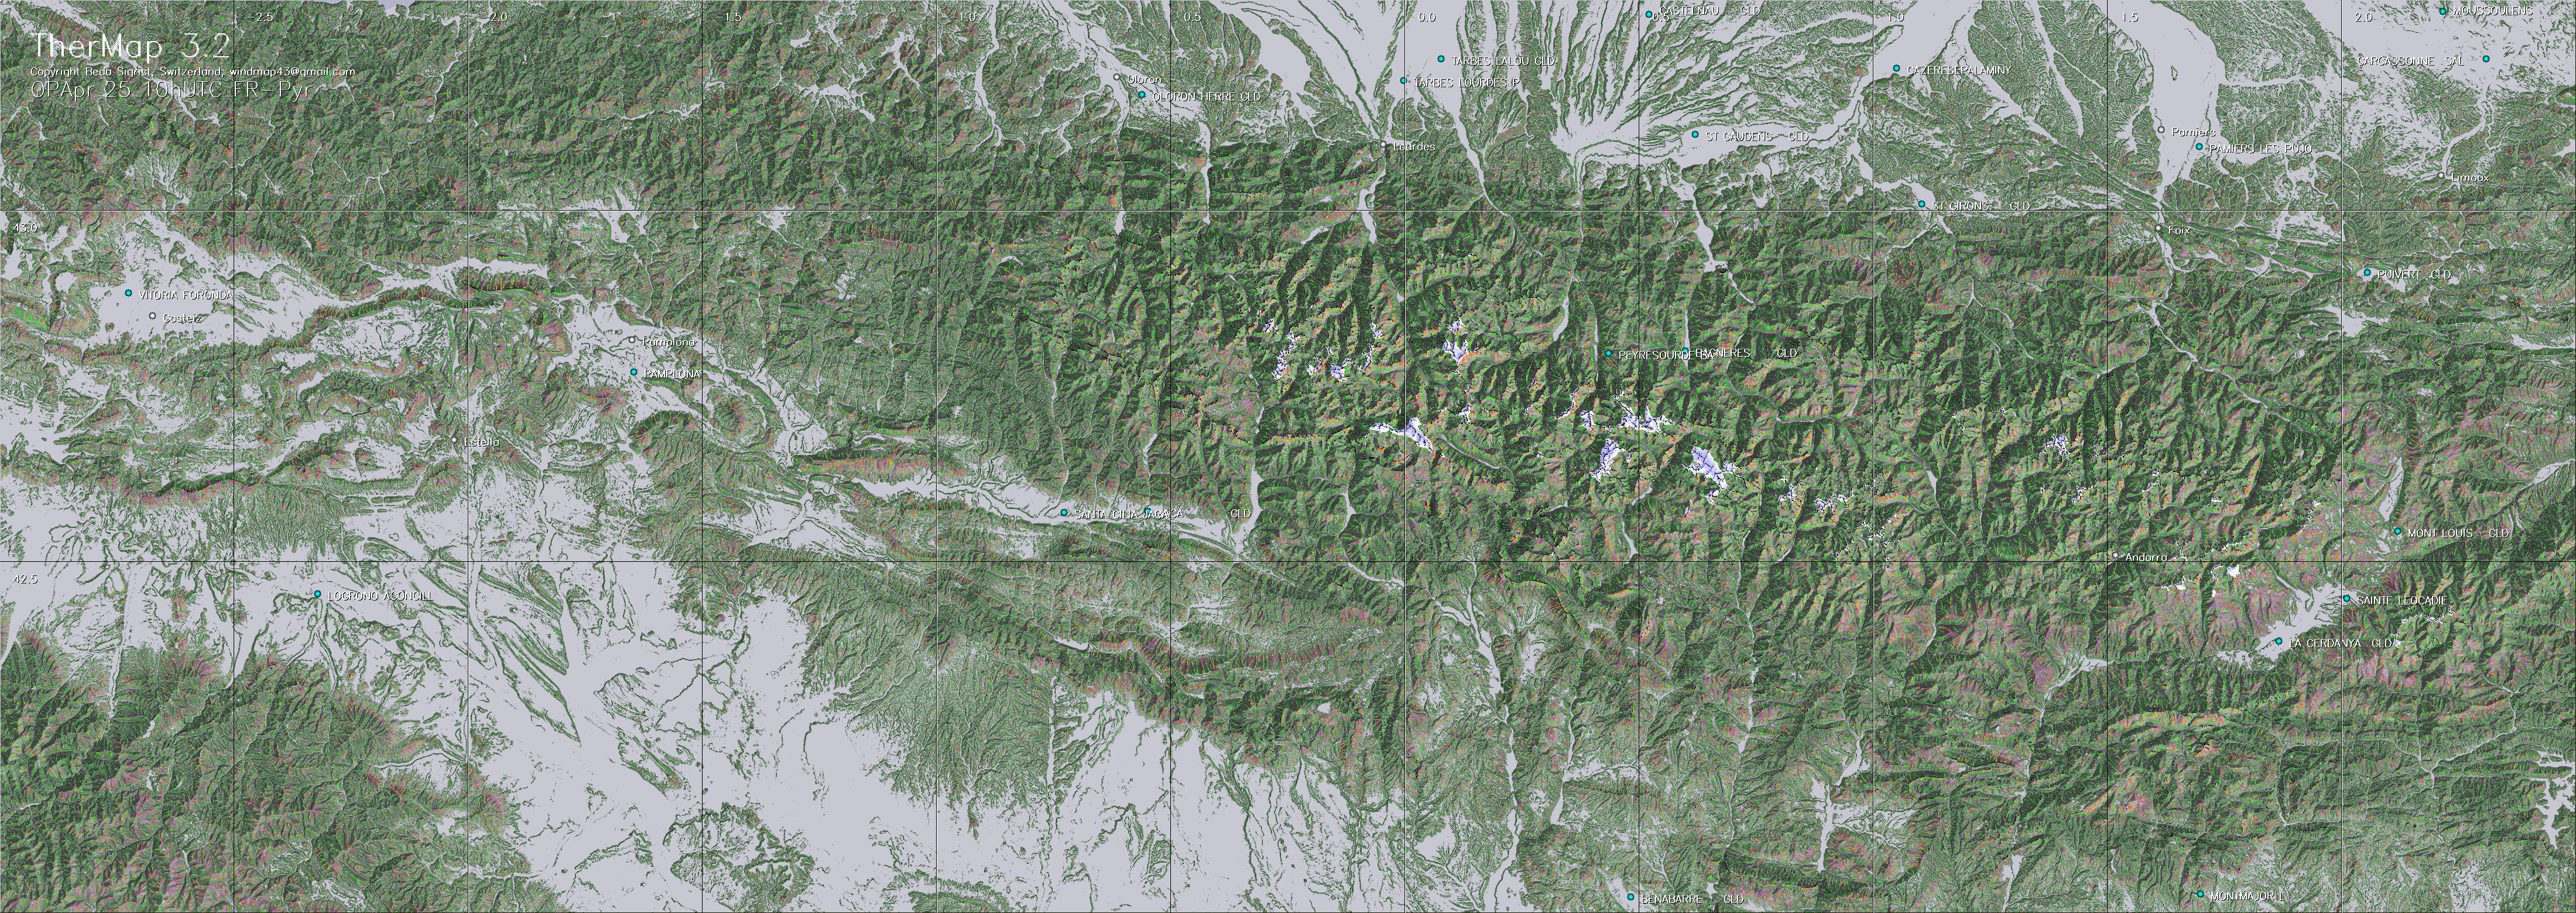
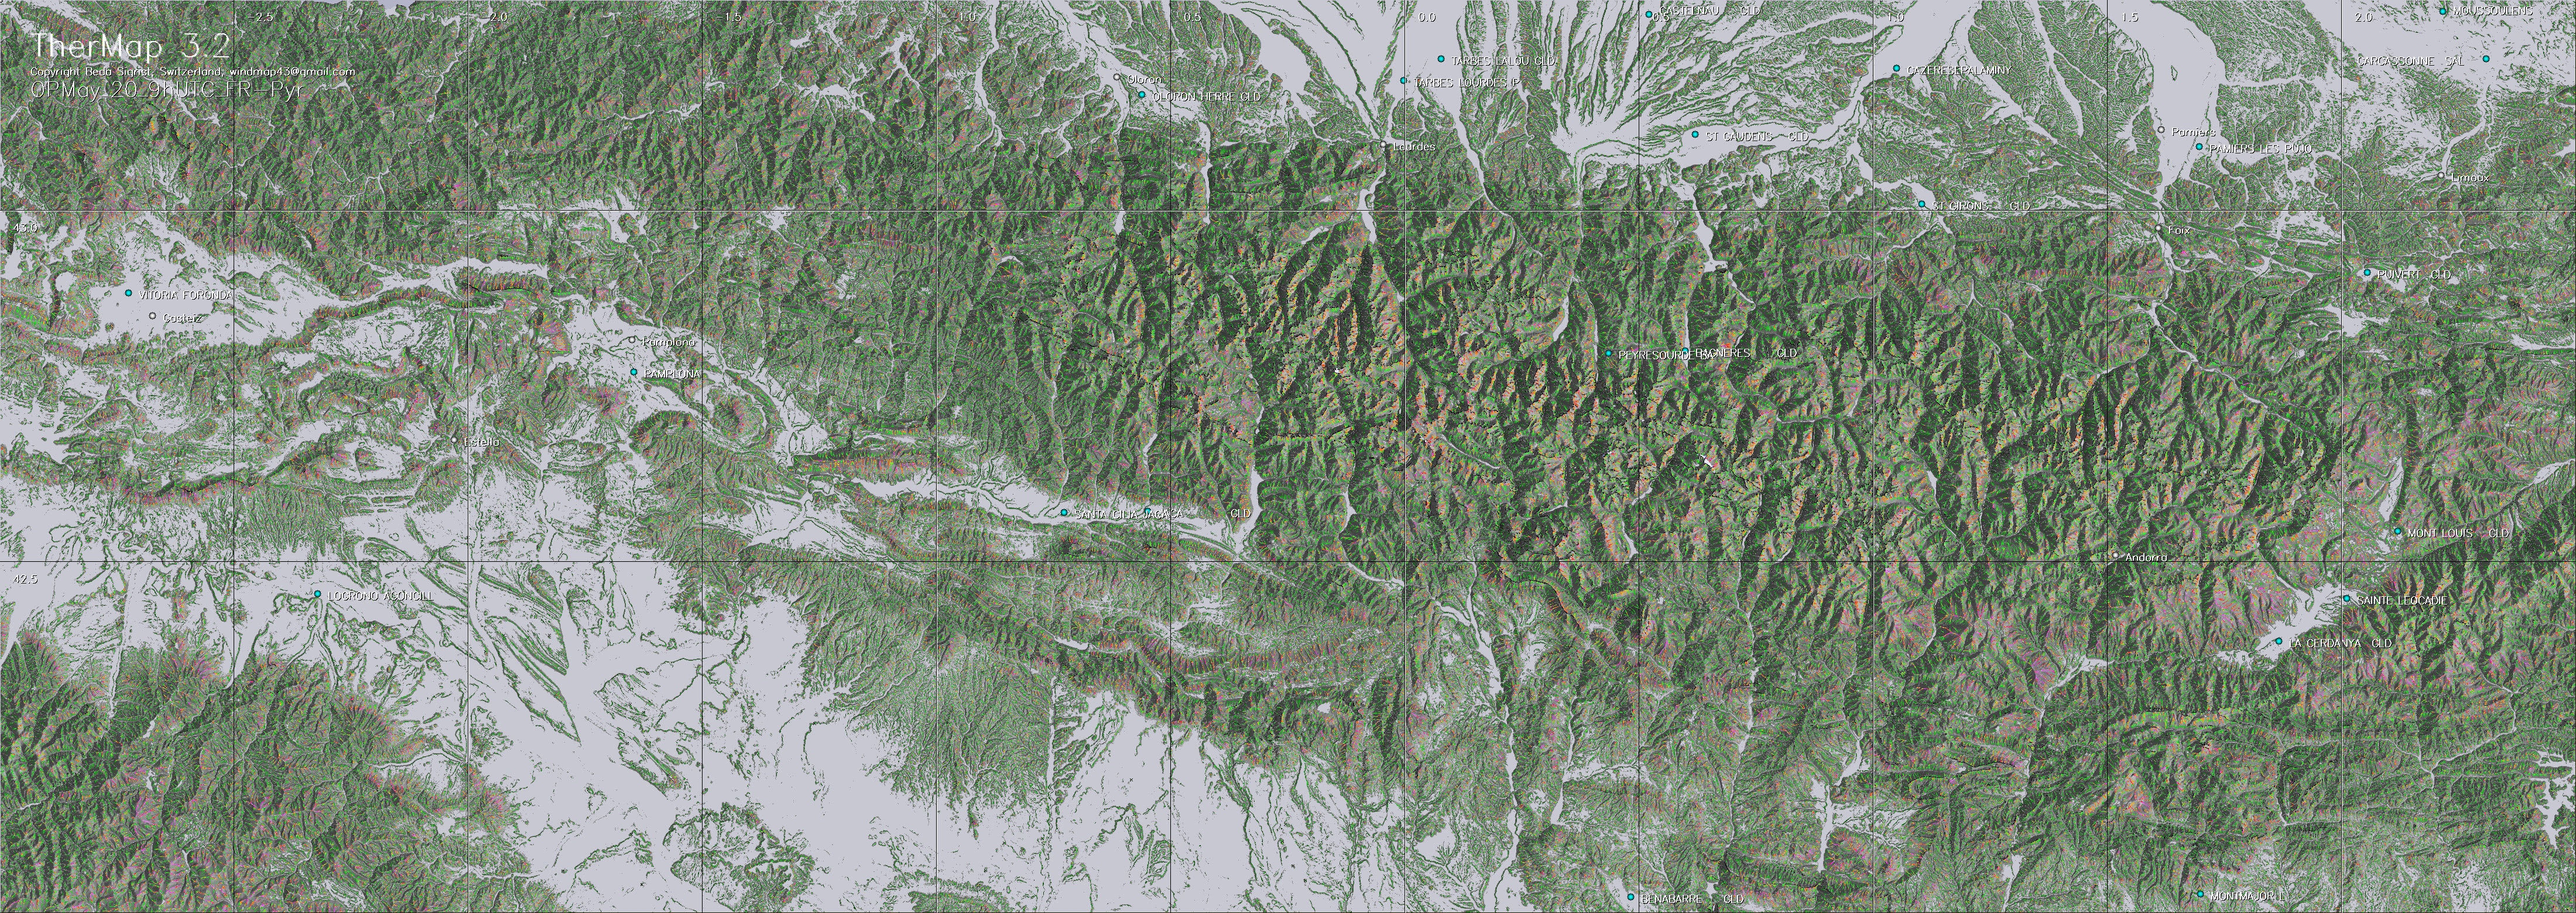
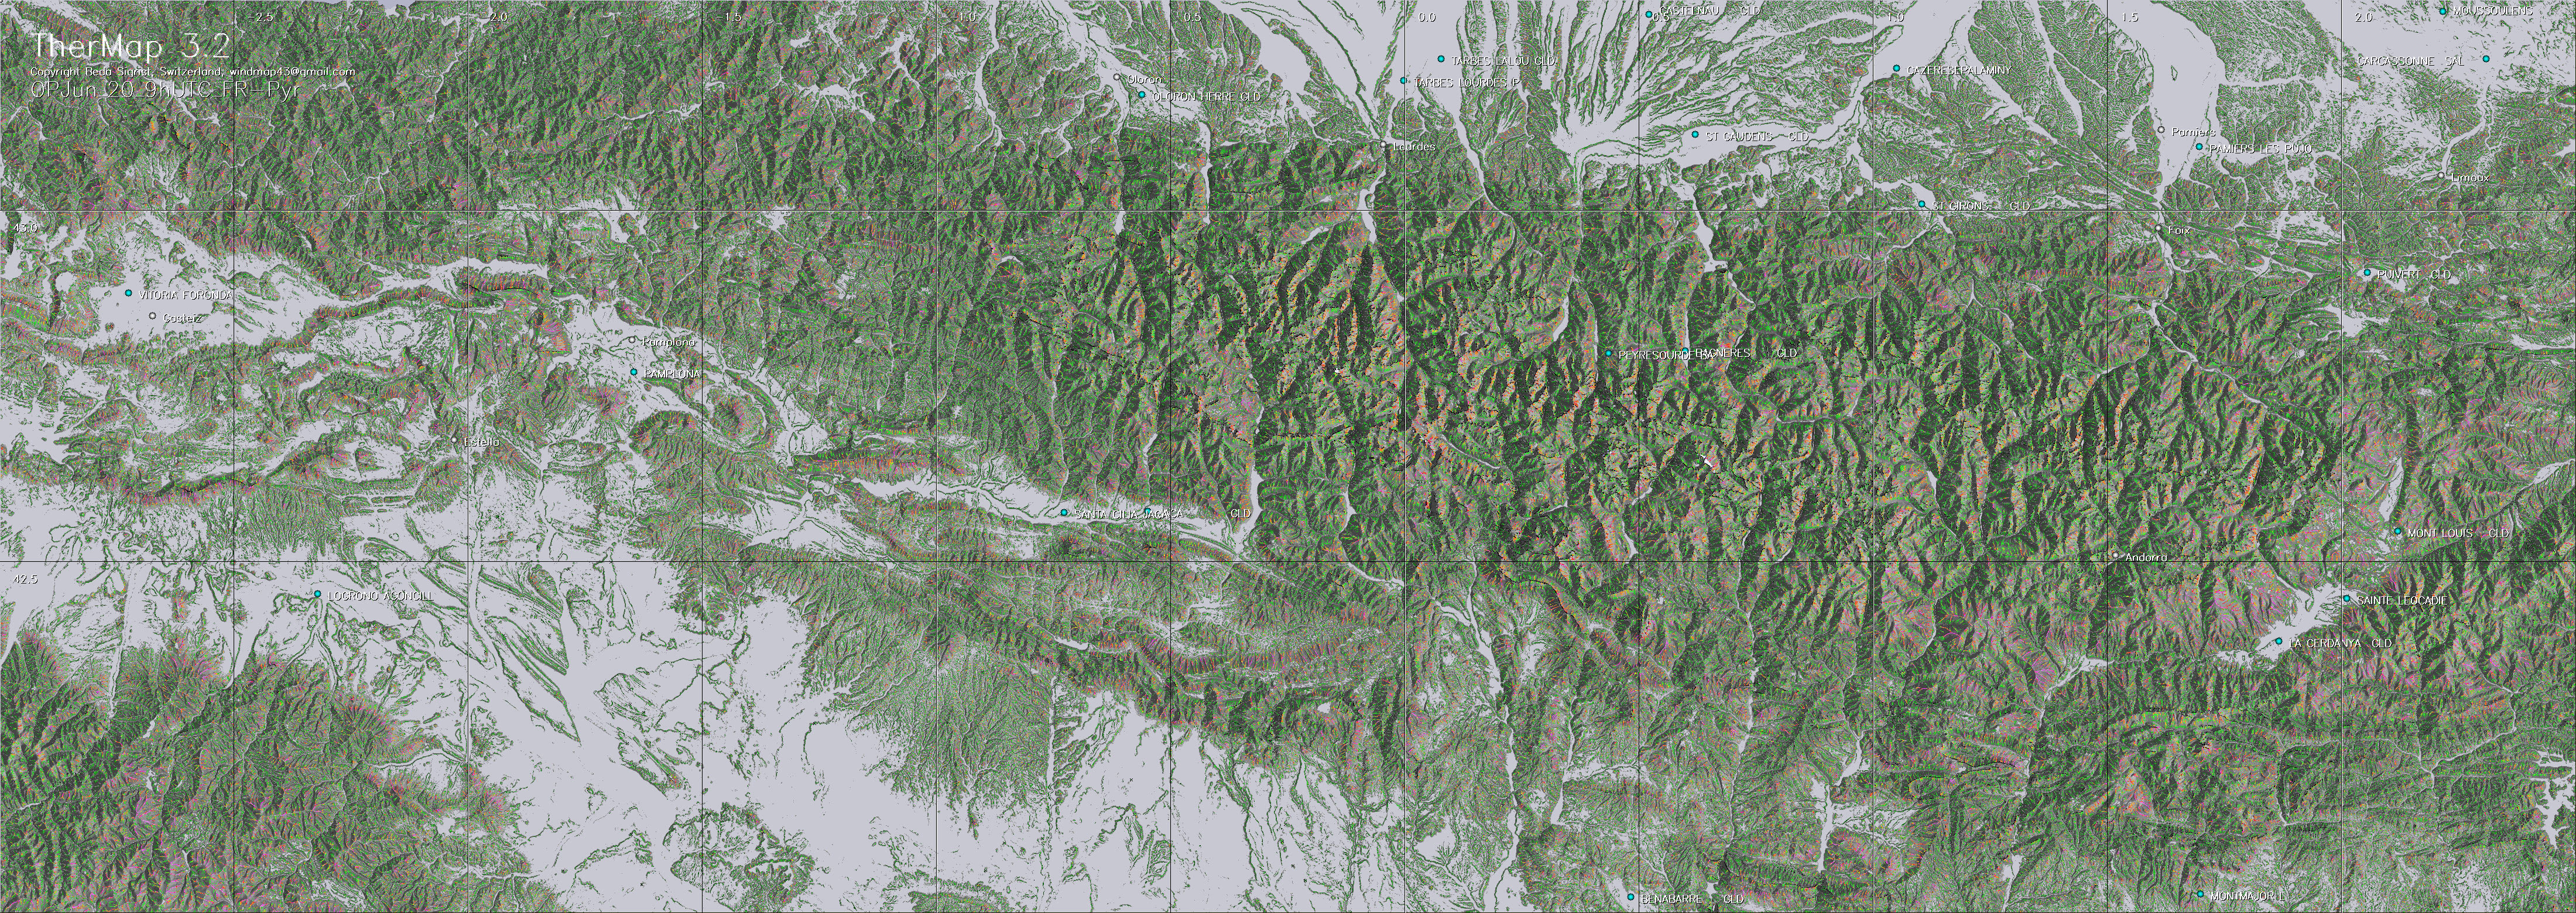
The following table contains maps generated
by TherMap 3.
Each cell on the following table represents a map of a region
at a the indicated date and time. Select the one closest
to your flight path. (About 6-10 Mb per JPG map). Then either
double click on the field of the map to be viewed, or right
click on the target field and request the map to be saved
directly on your PC.
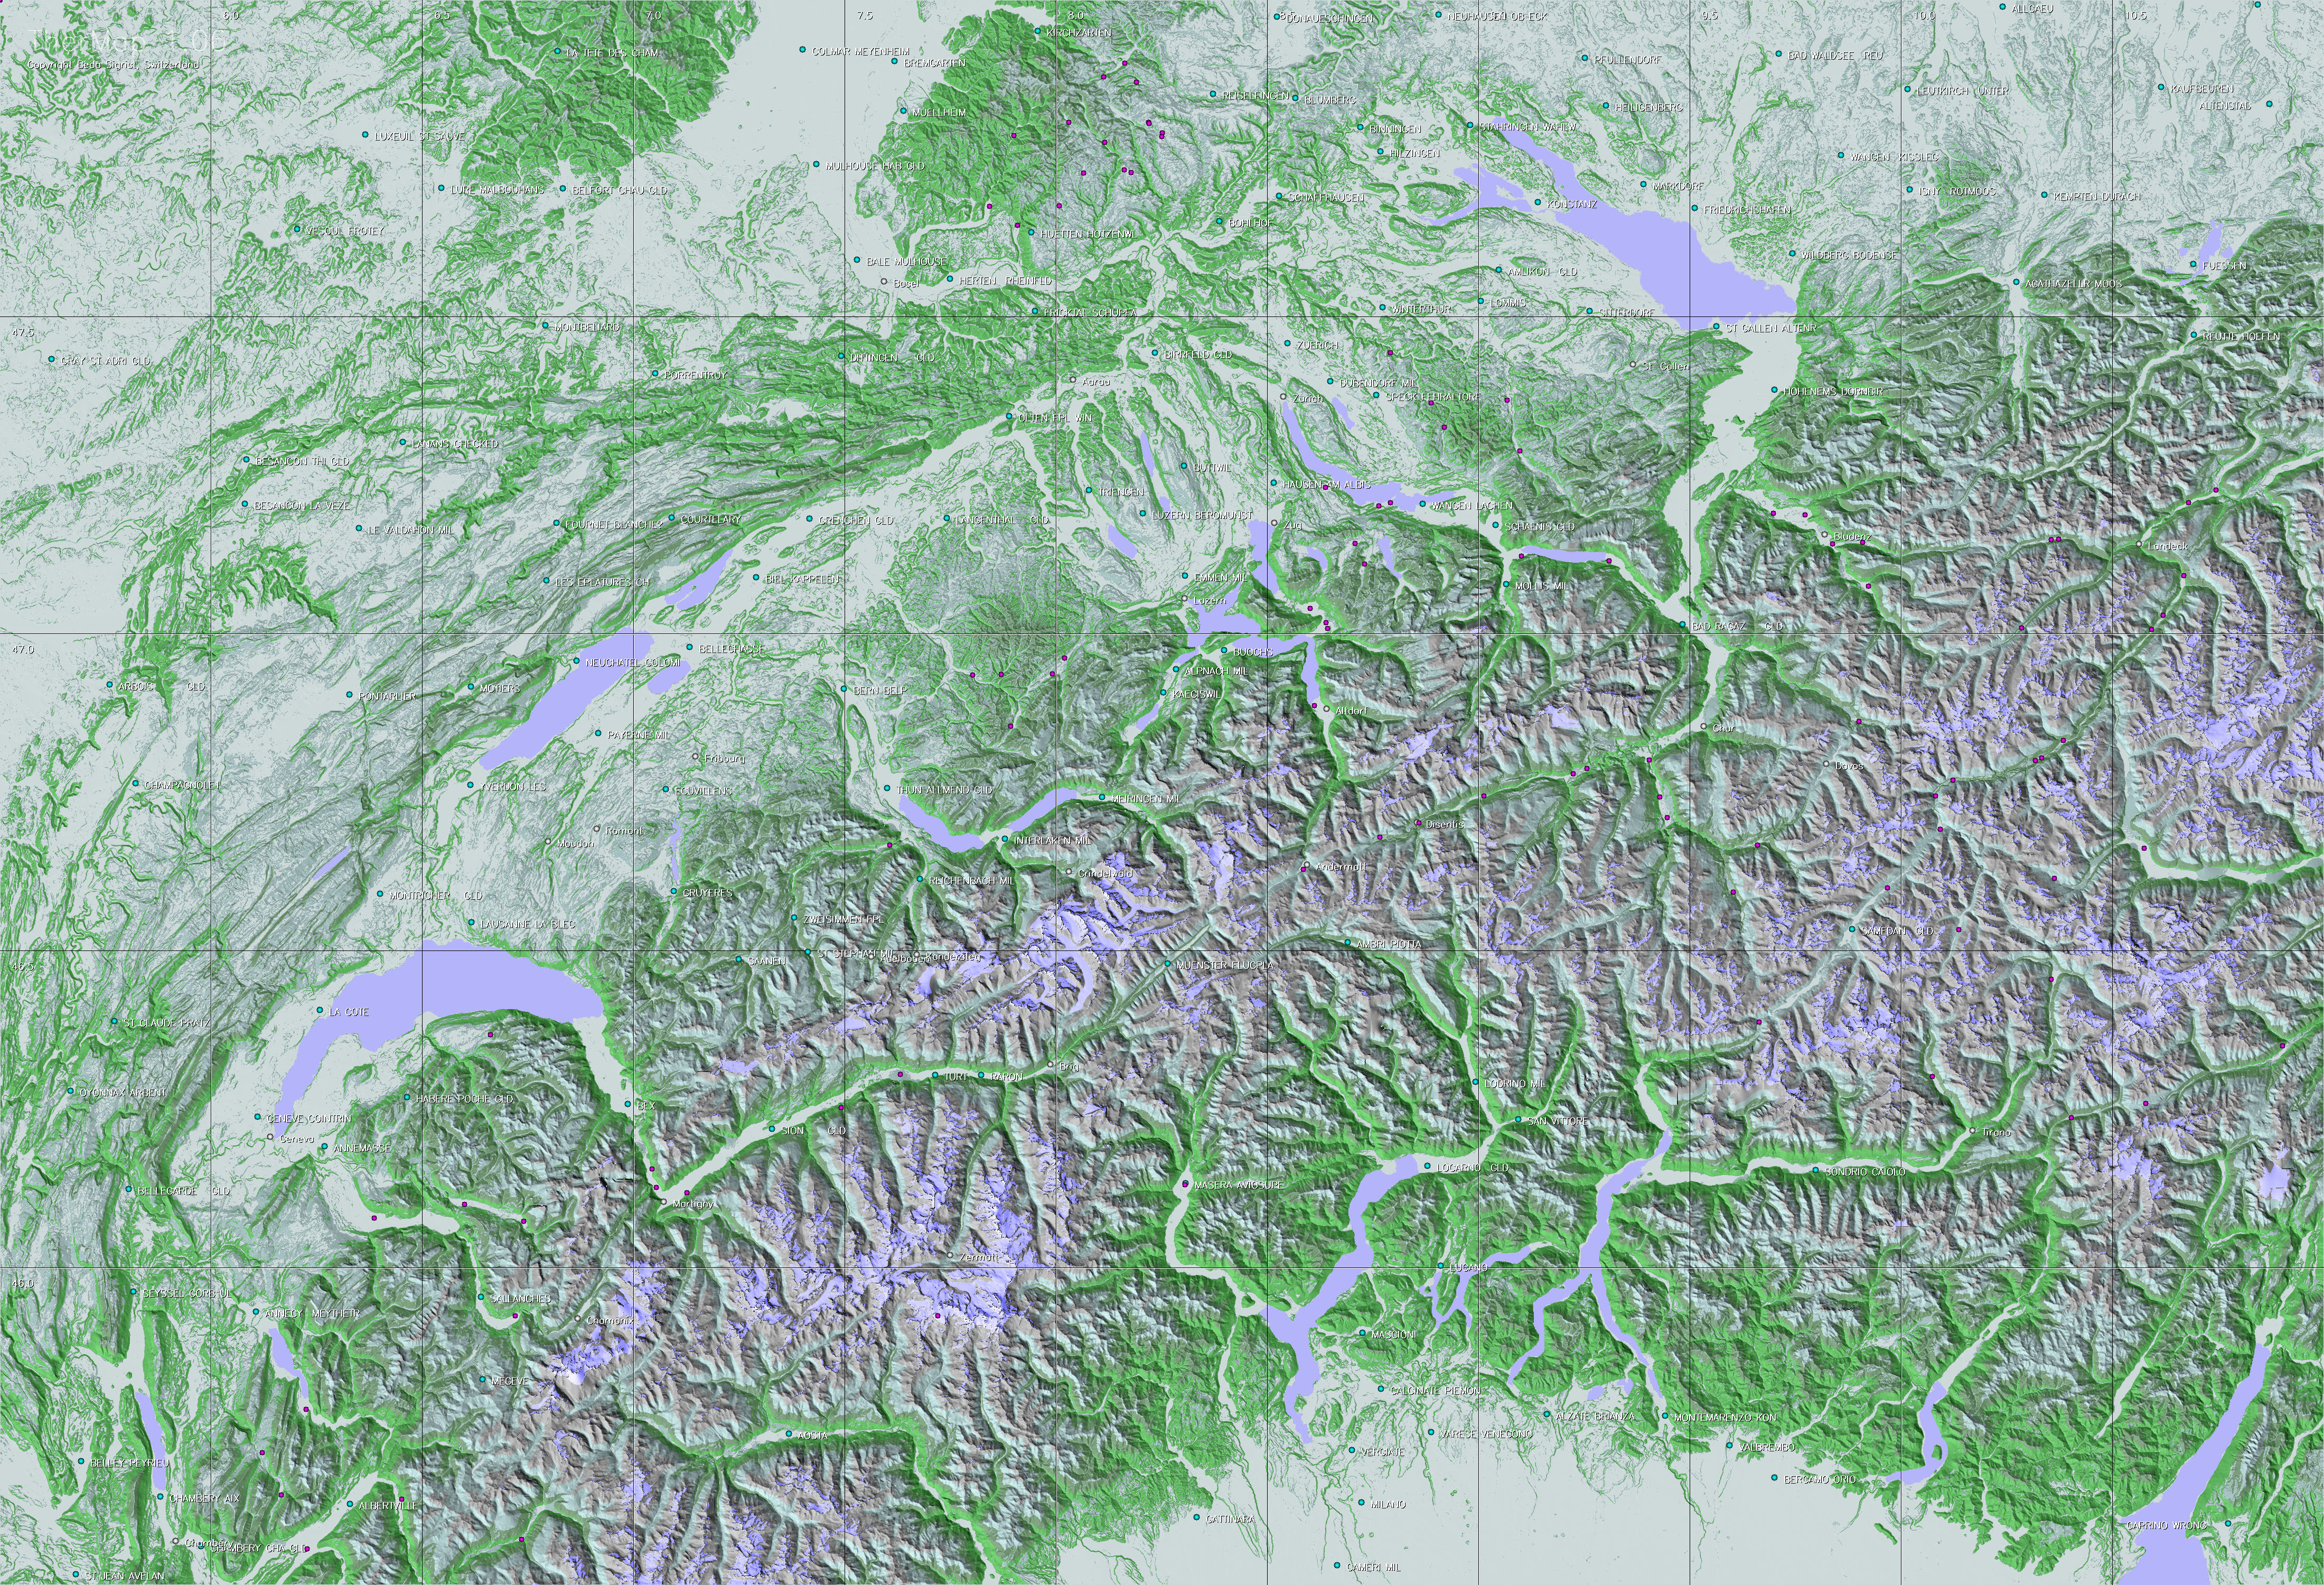
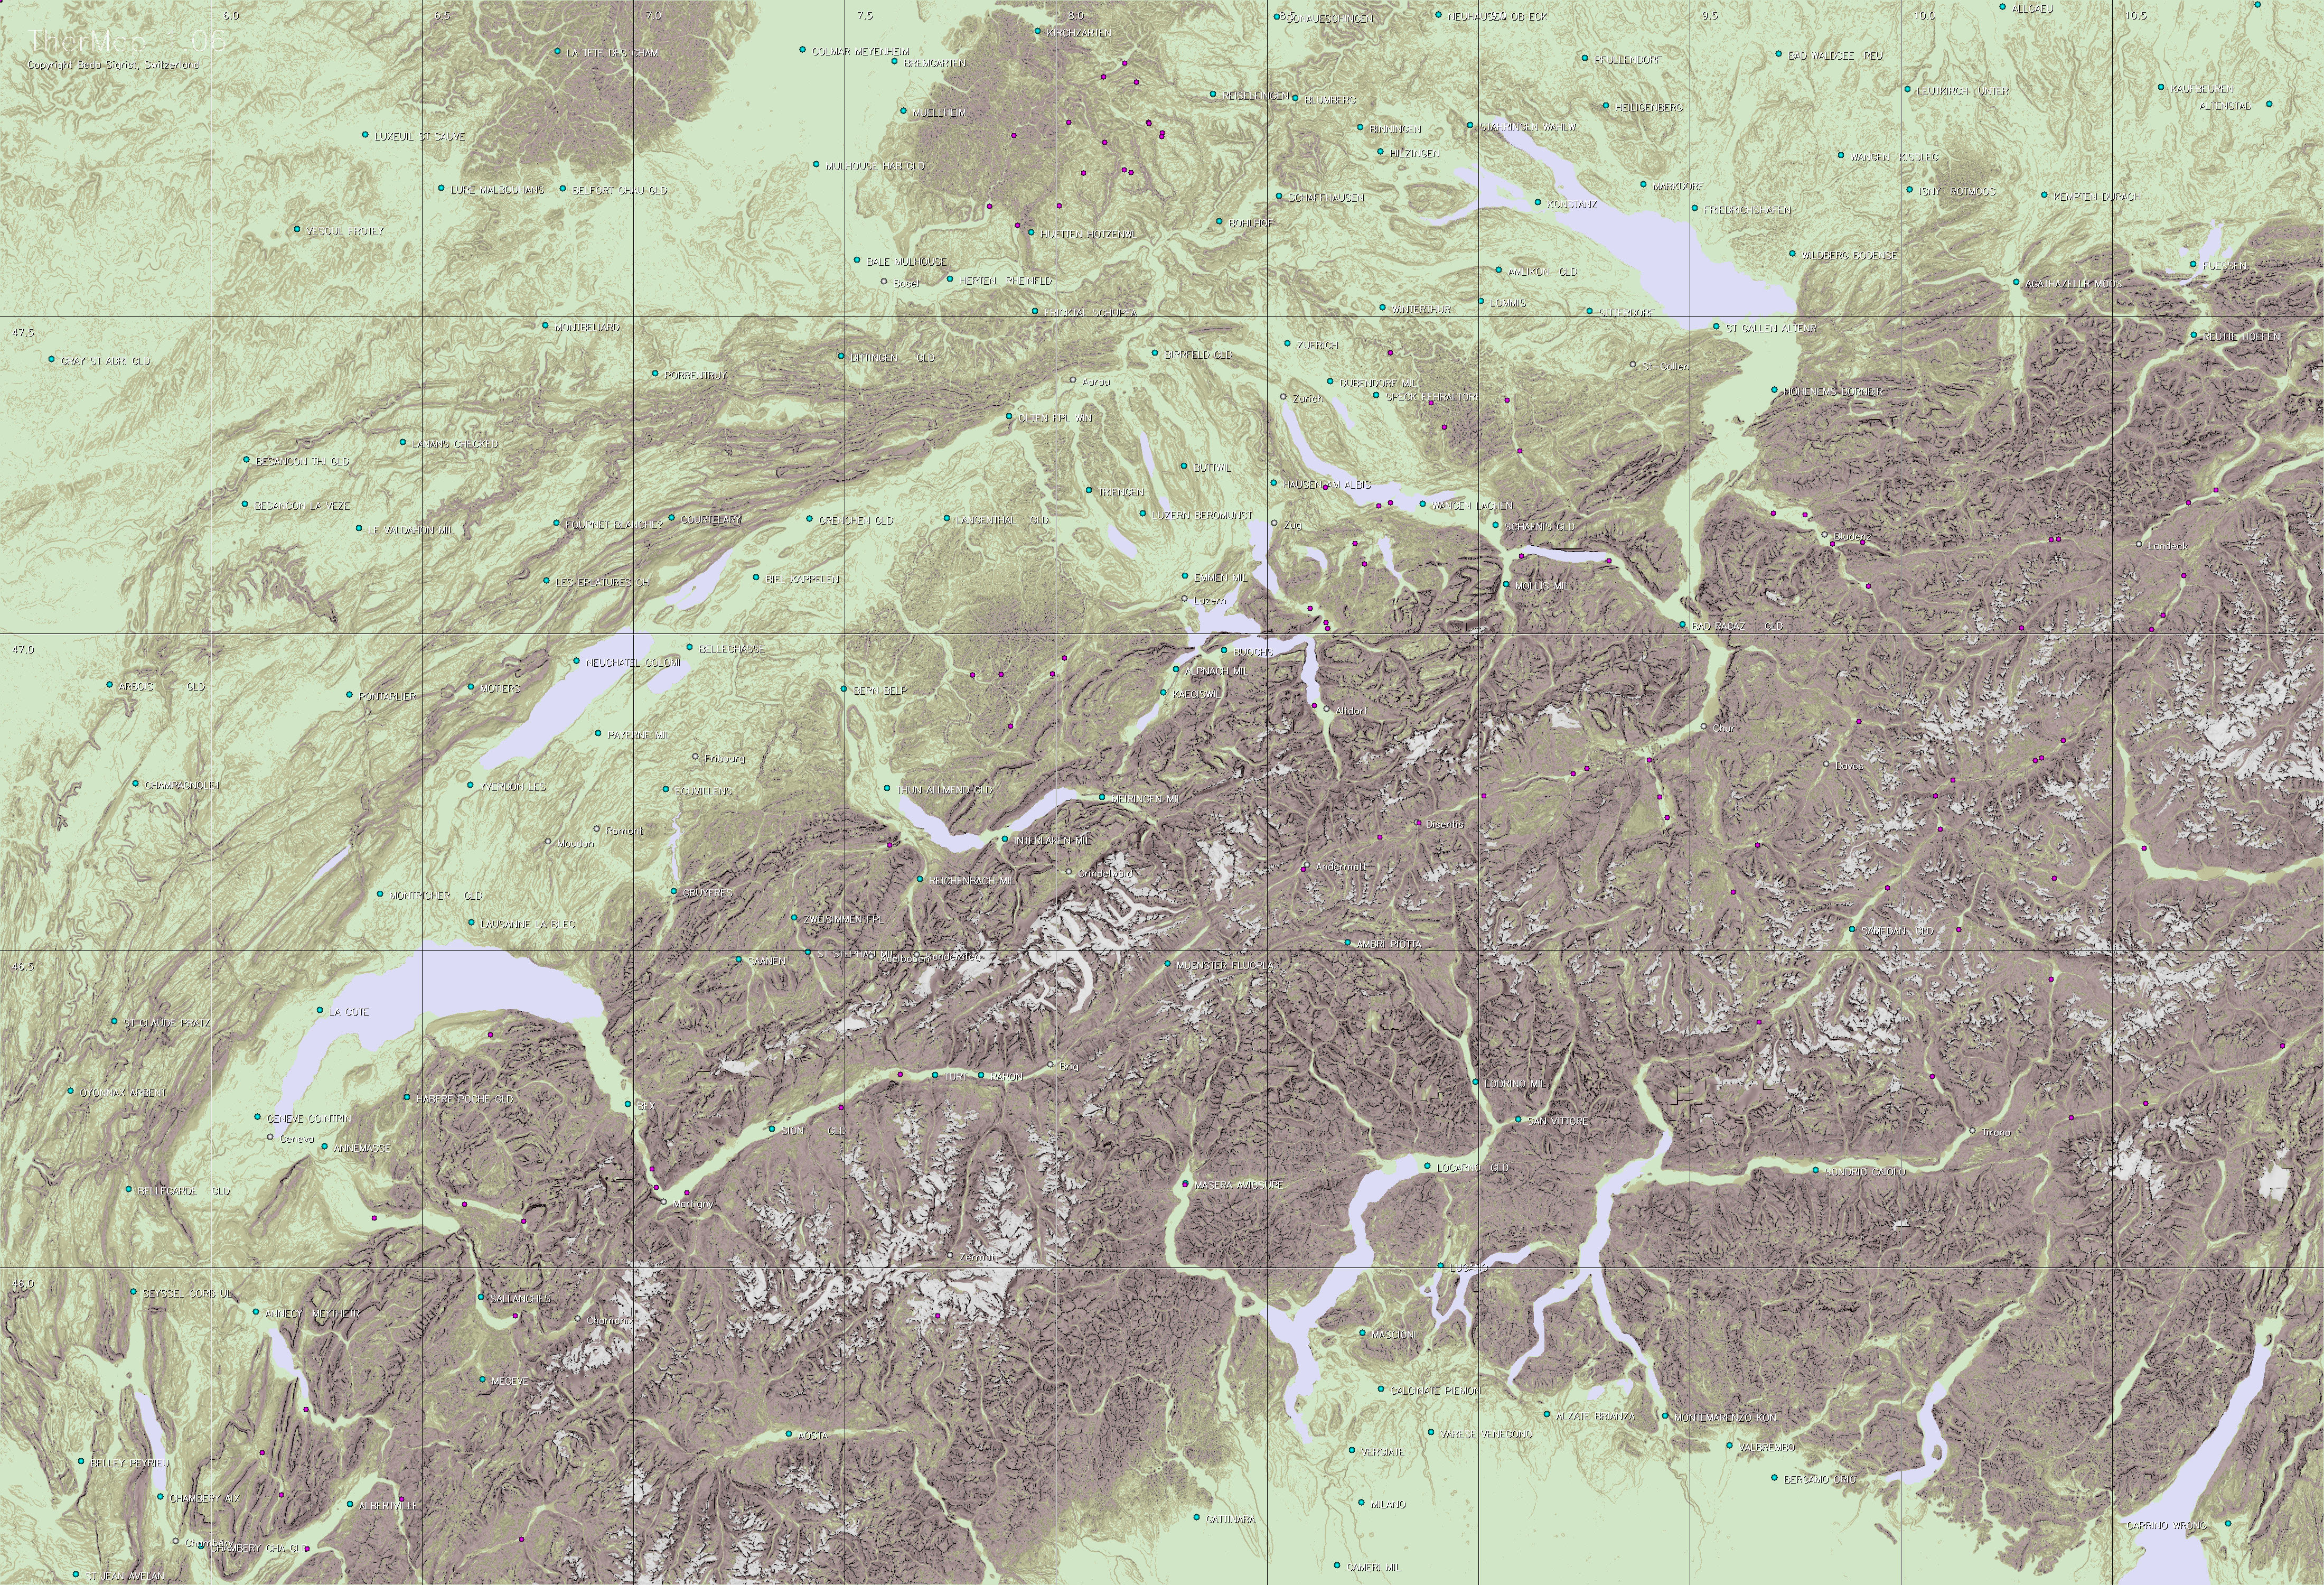
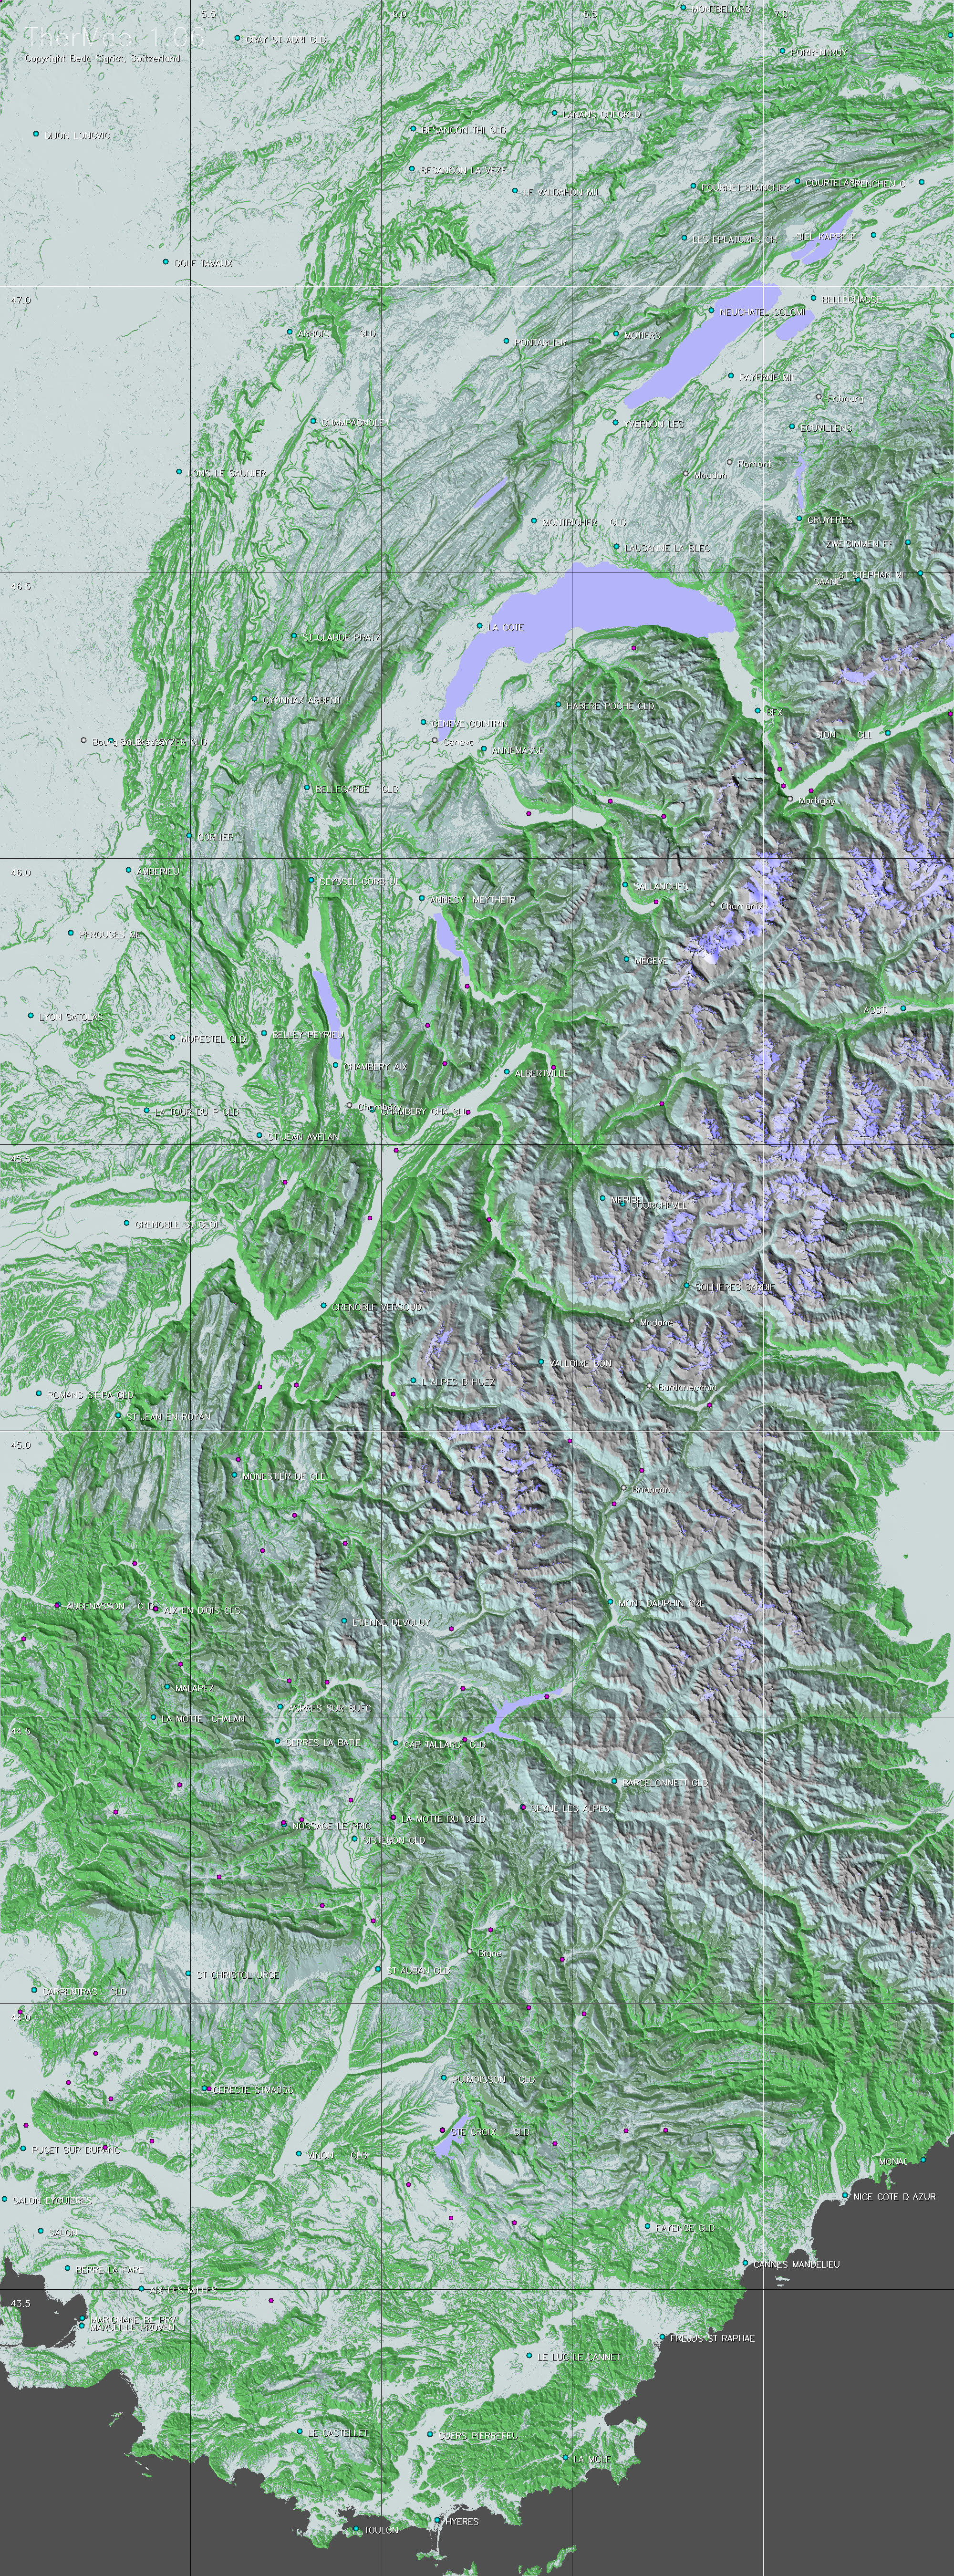
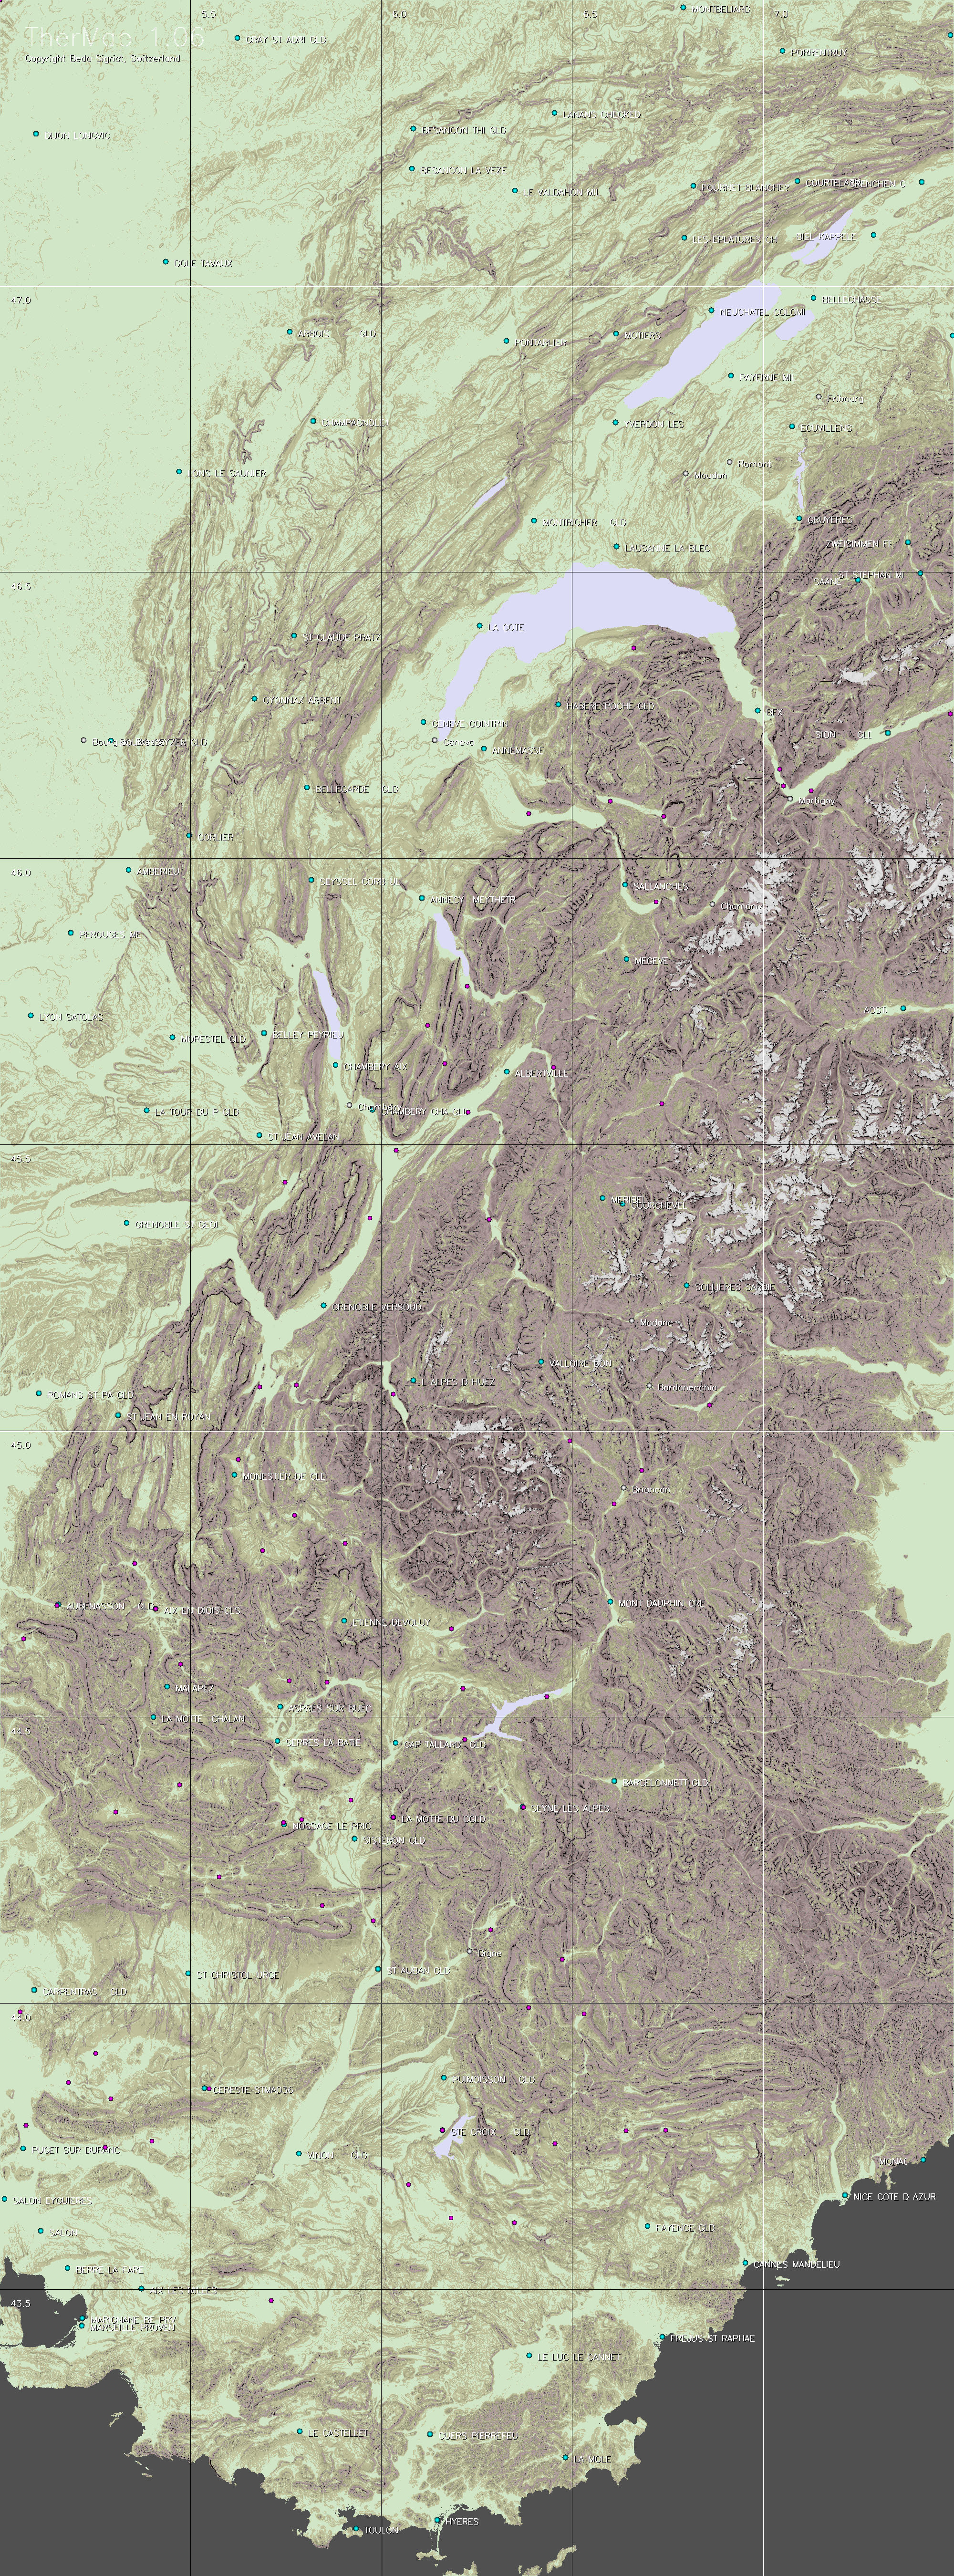
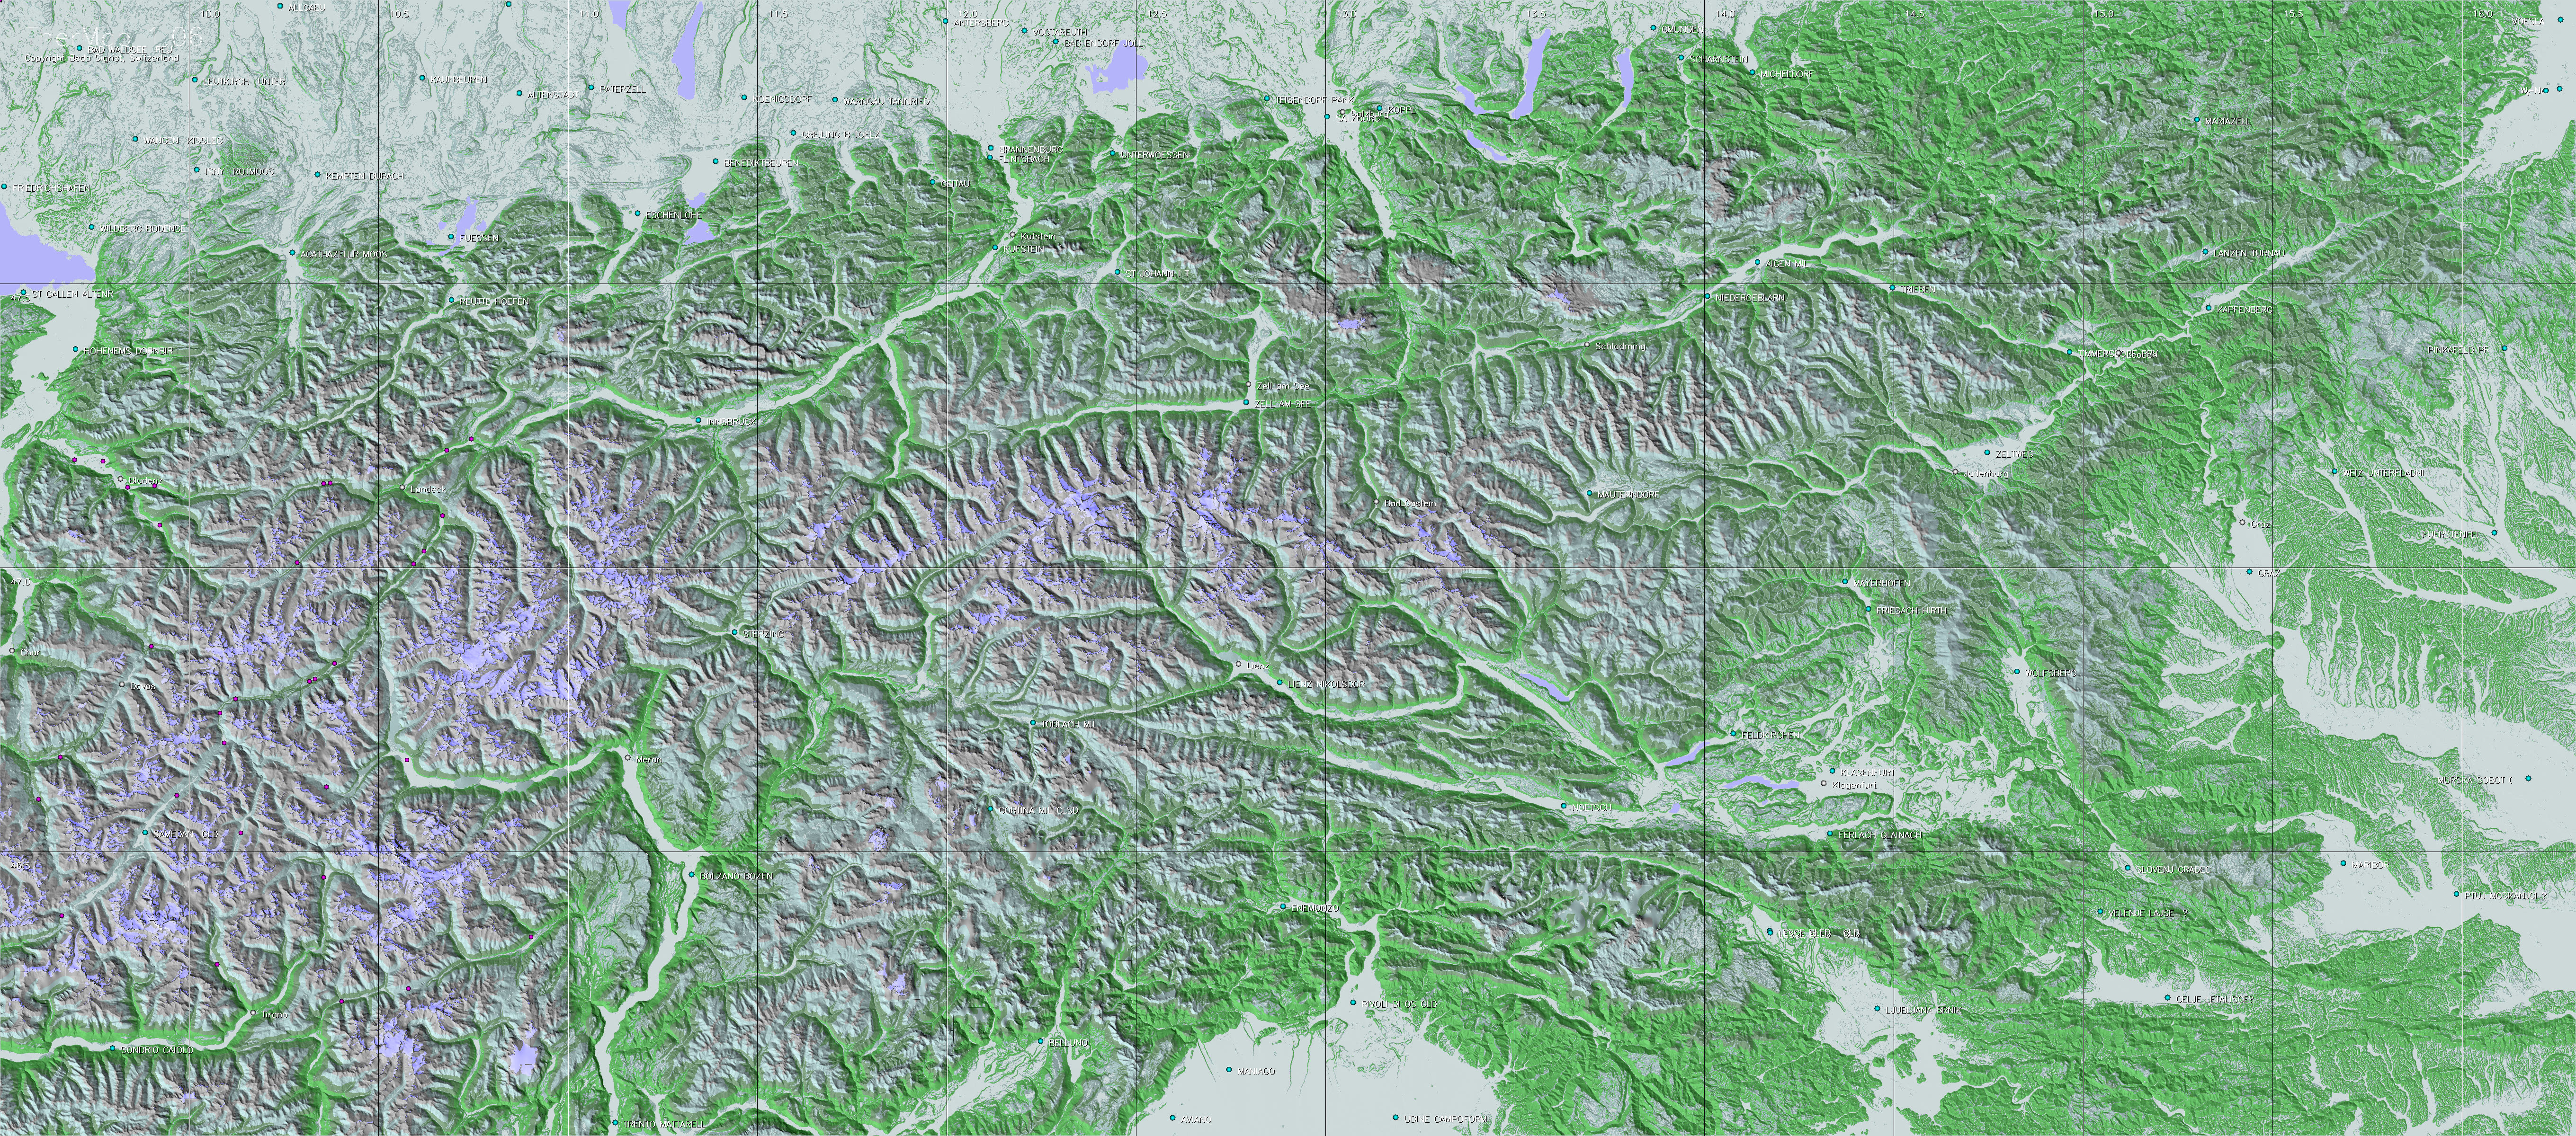
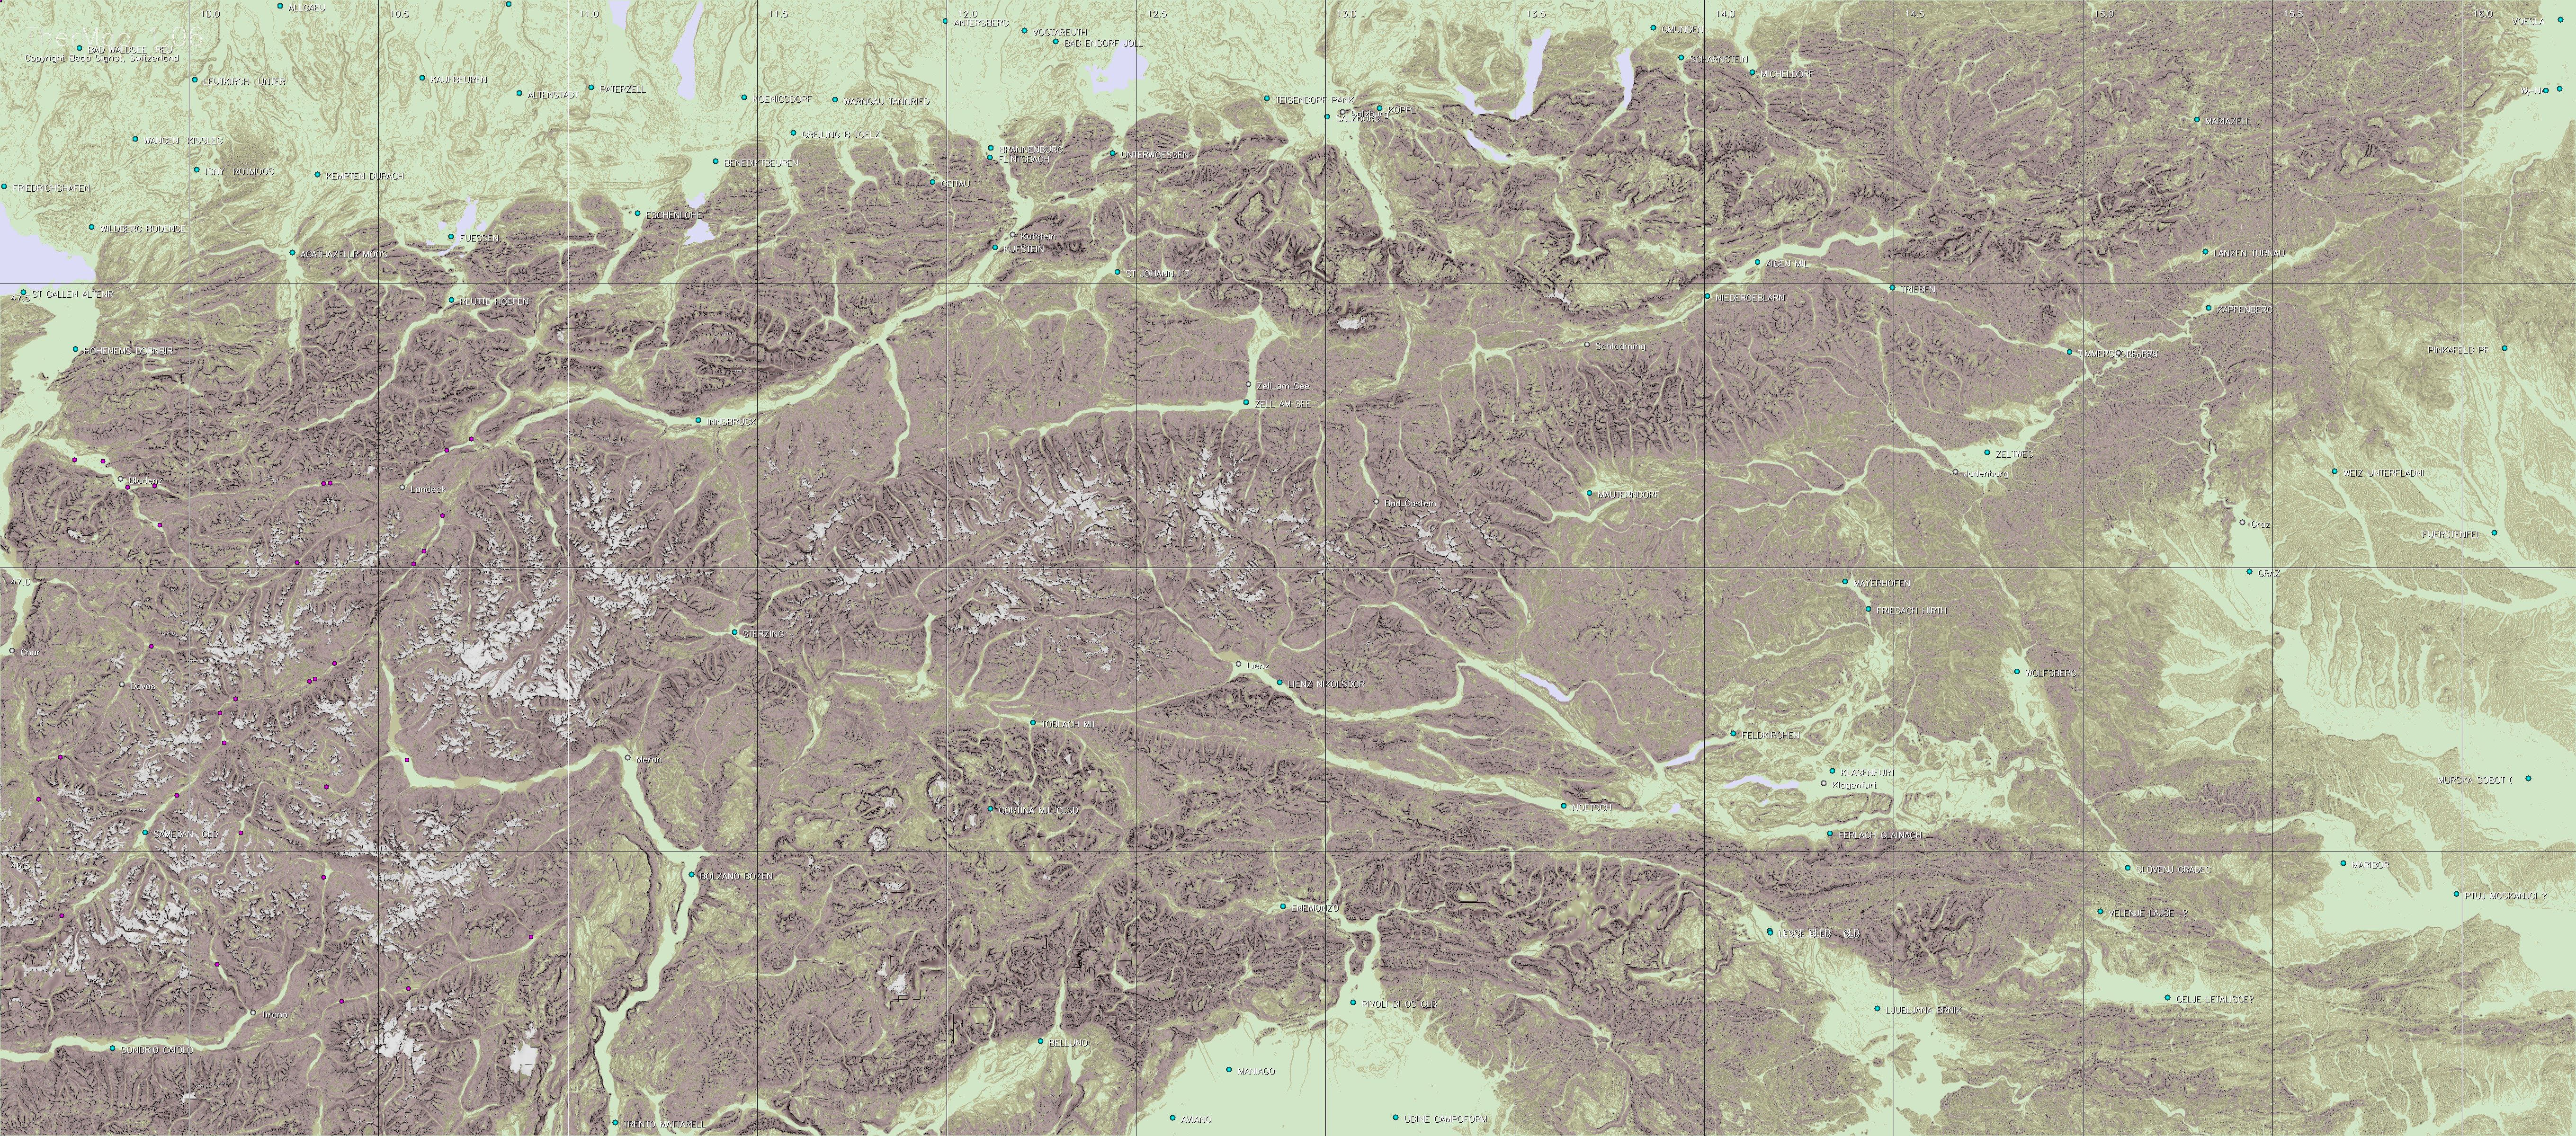
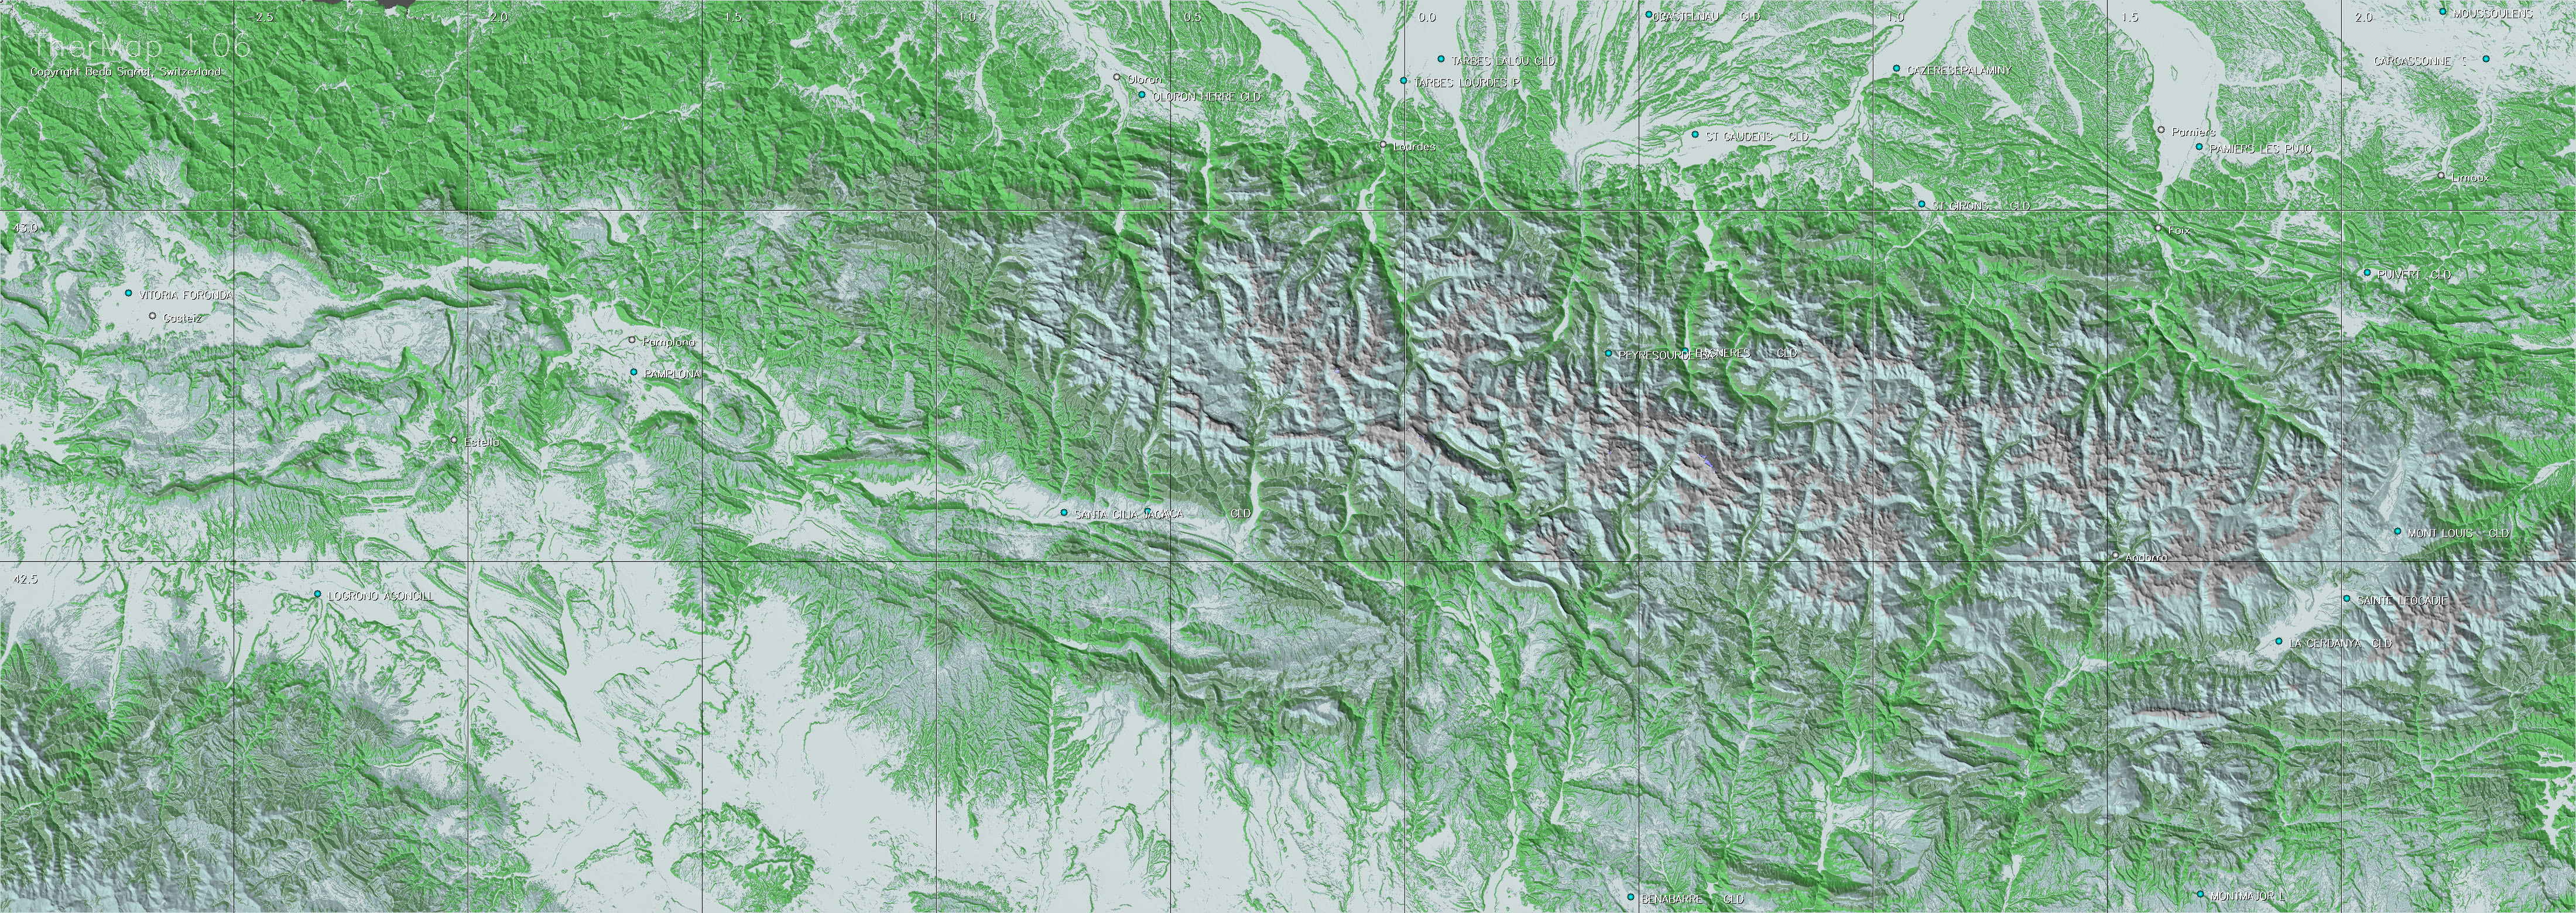
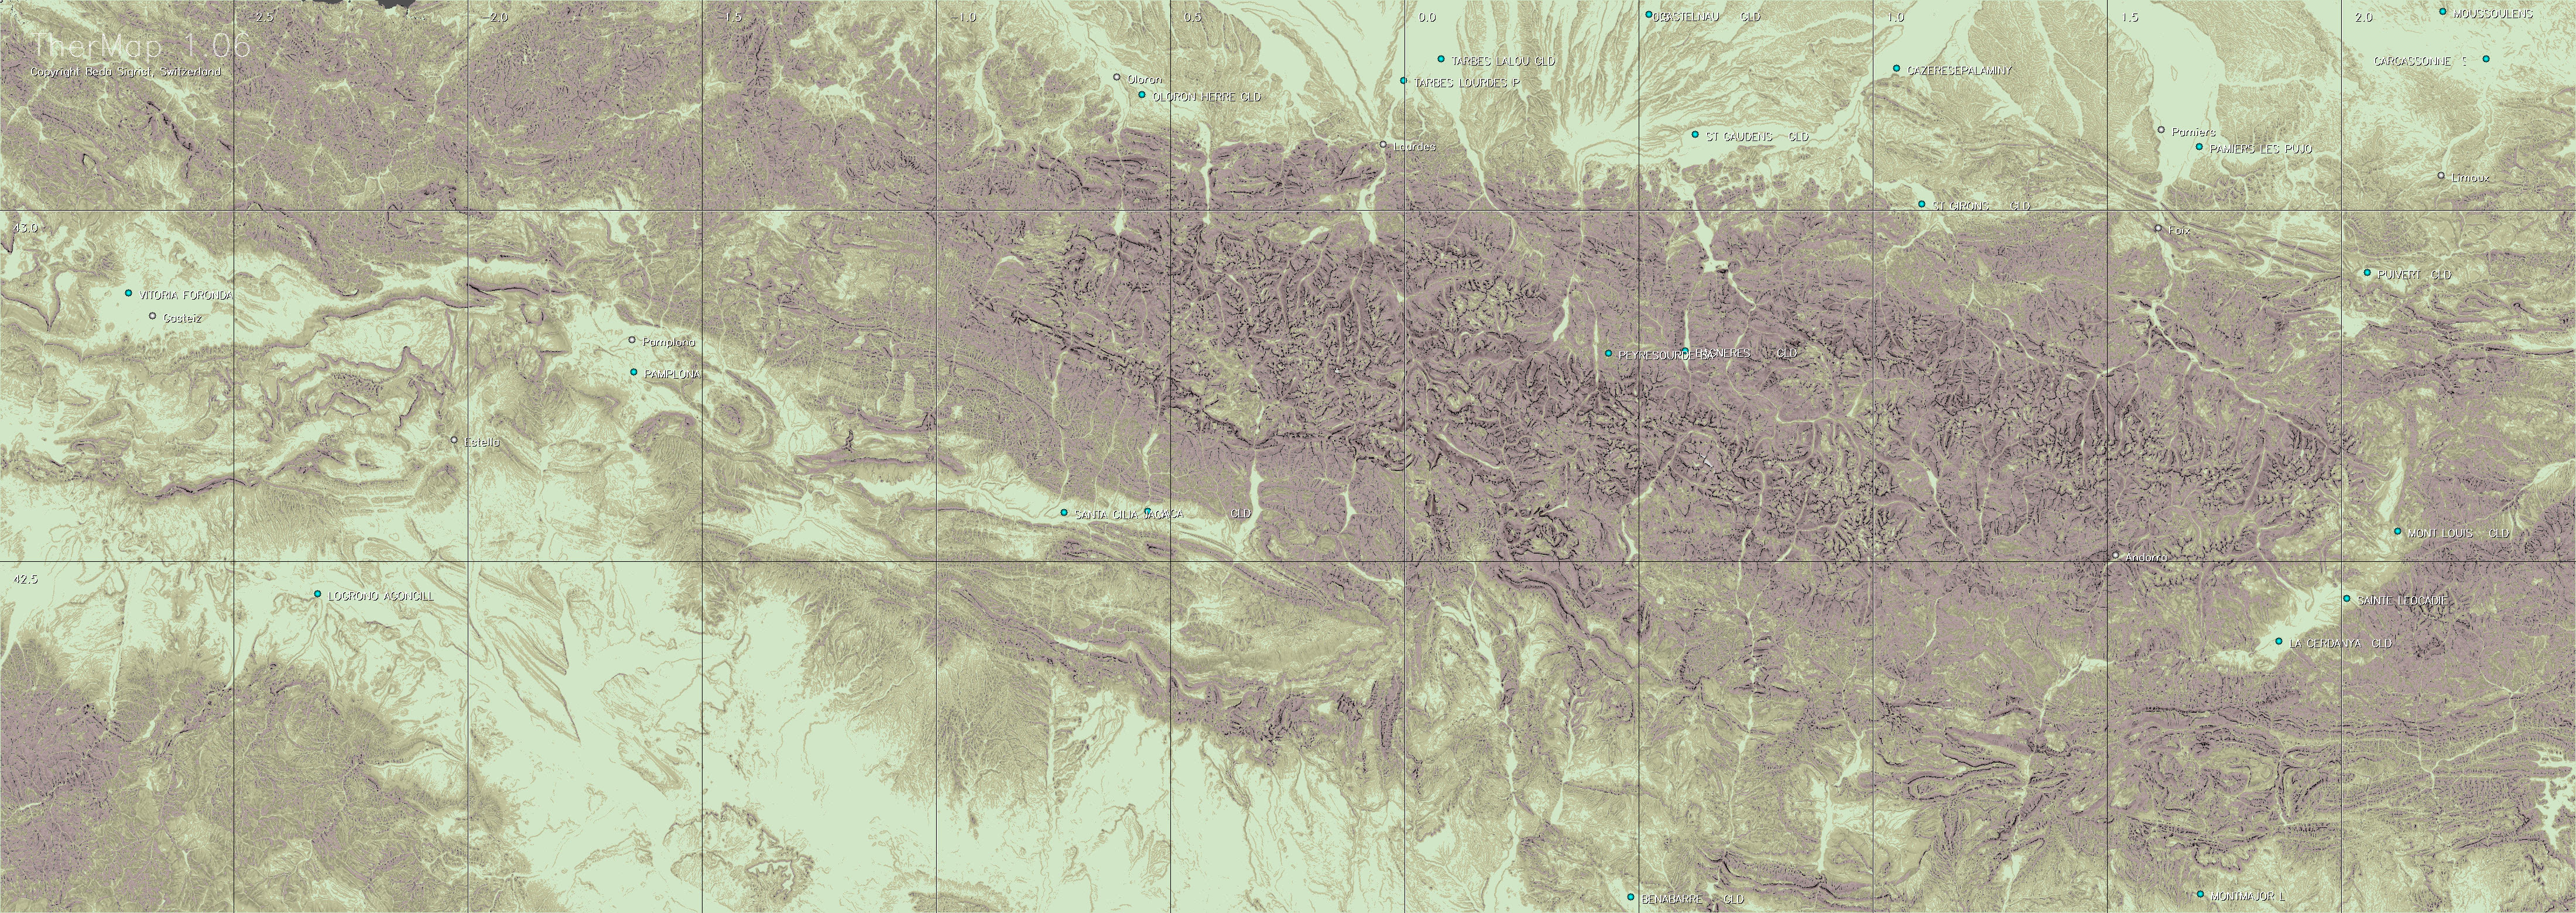
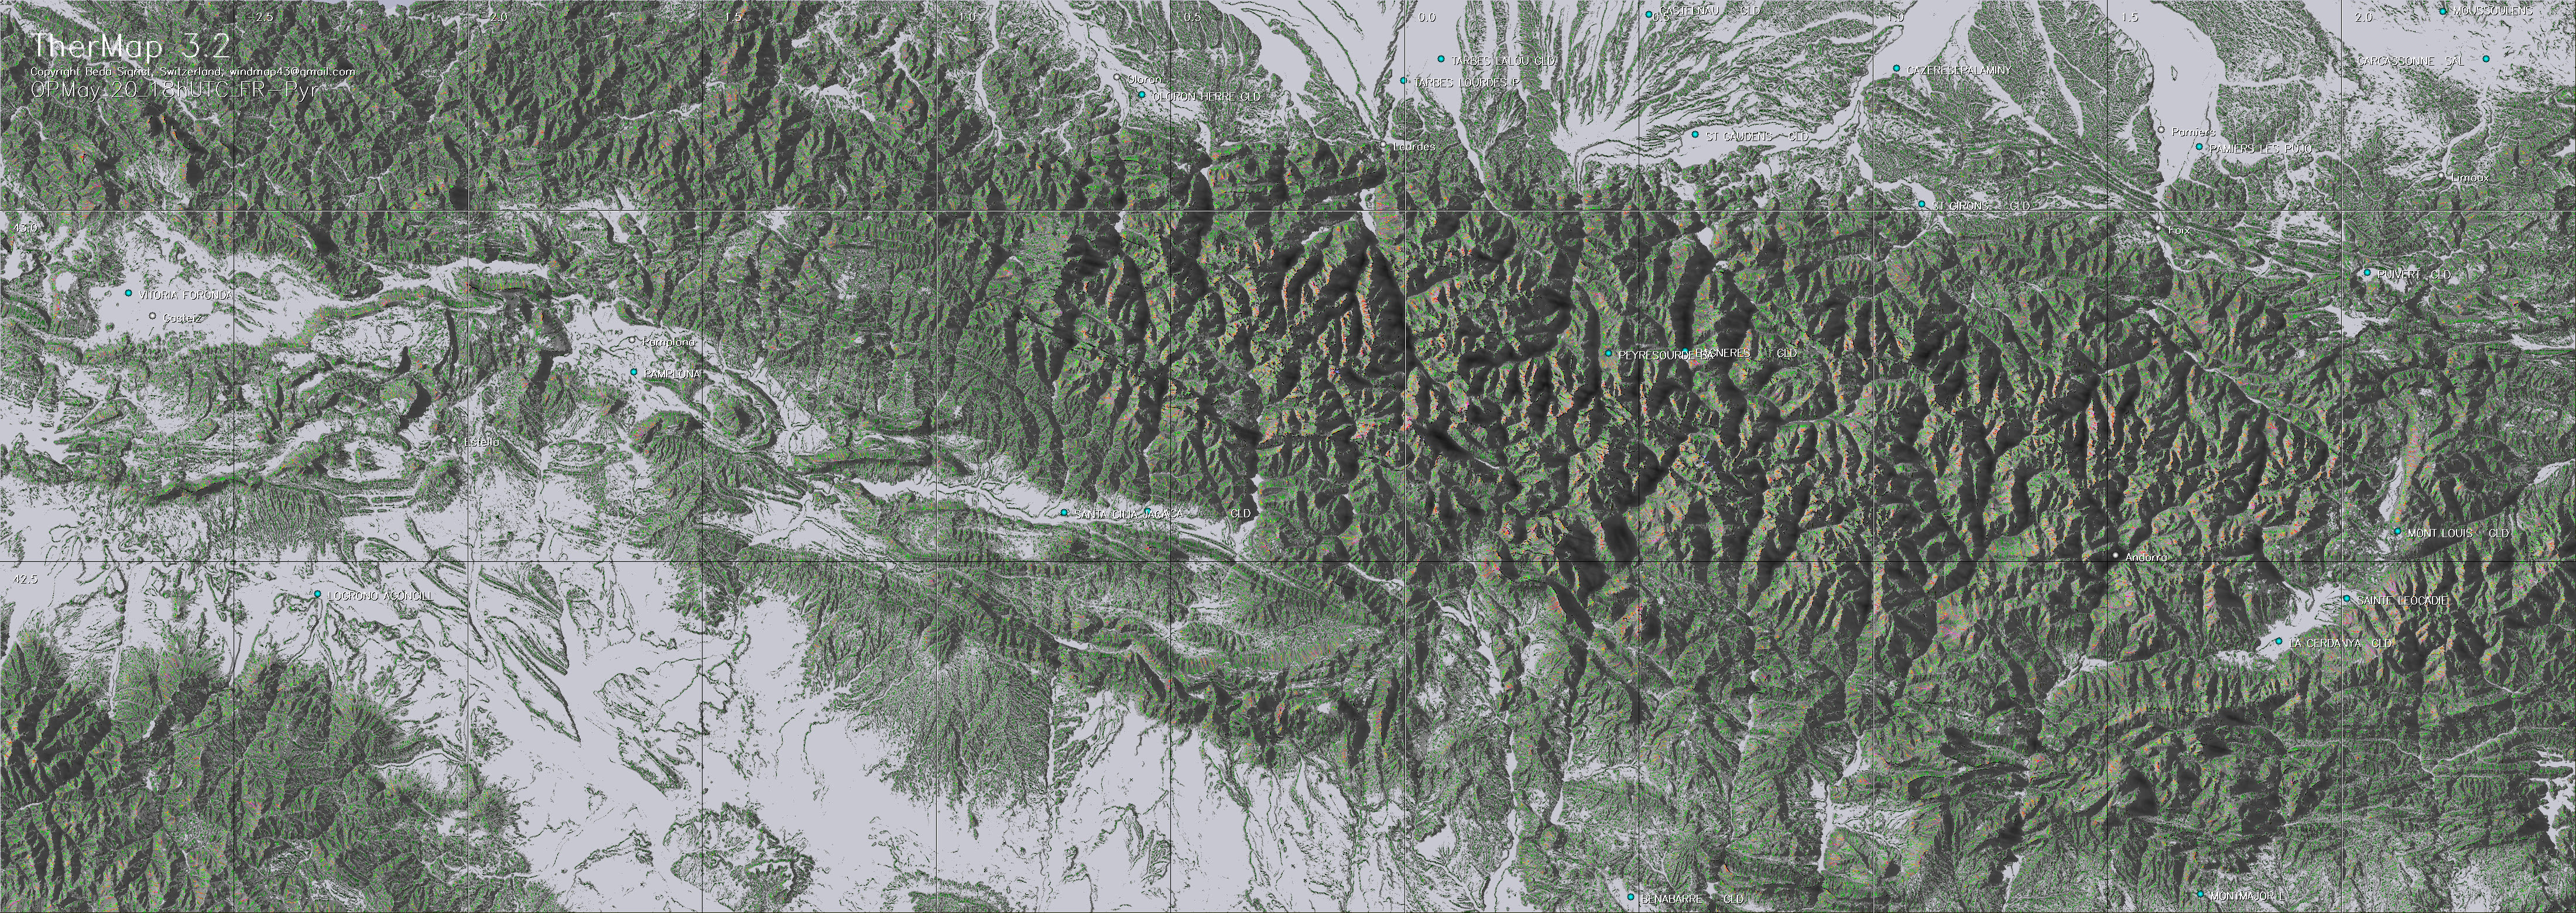
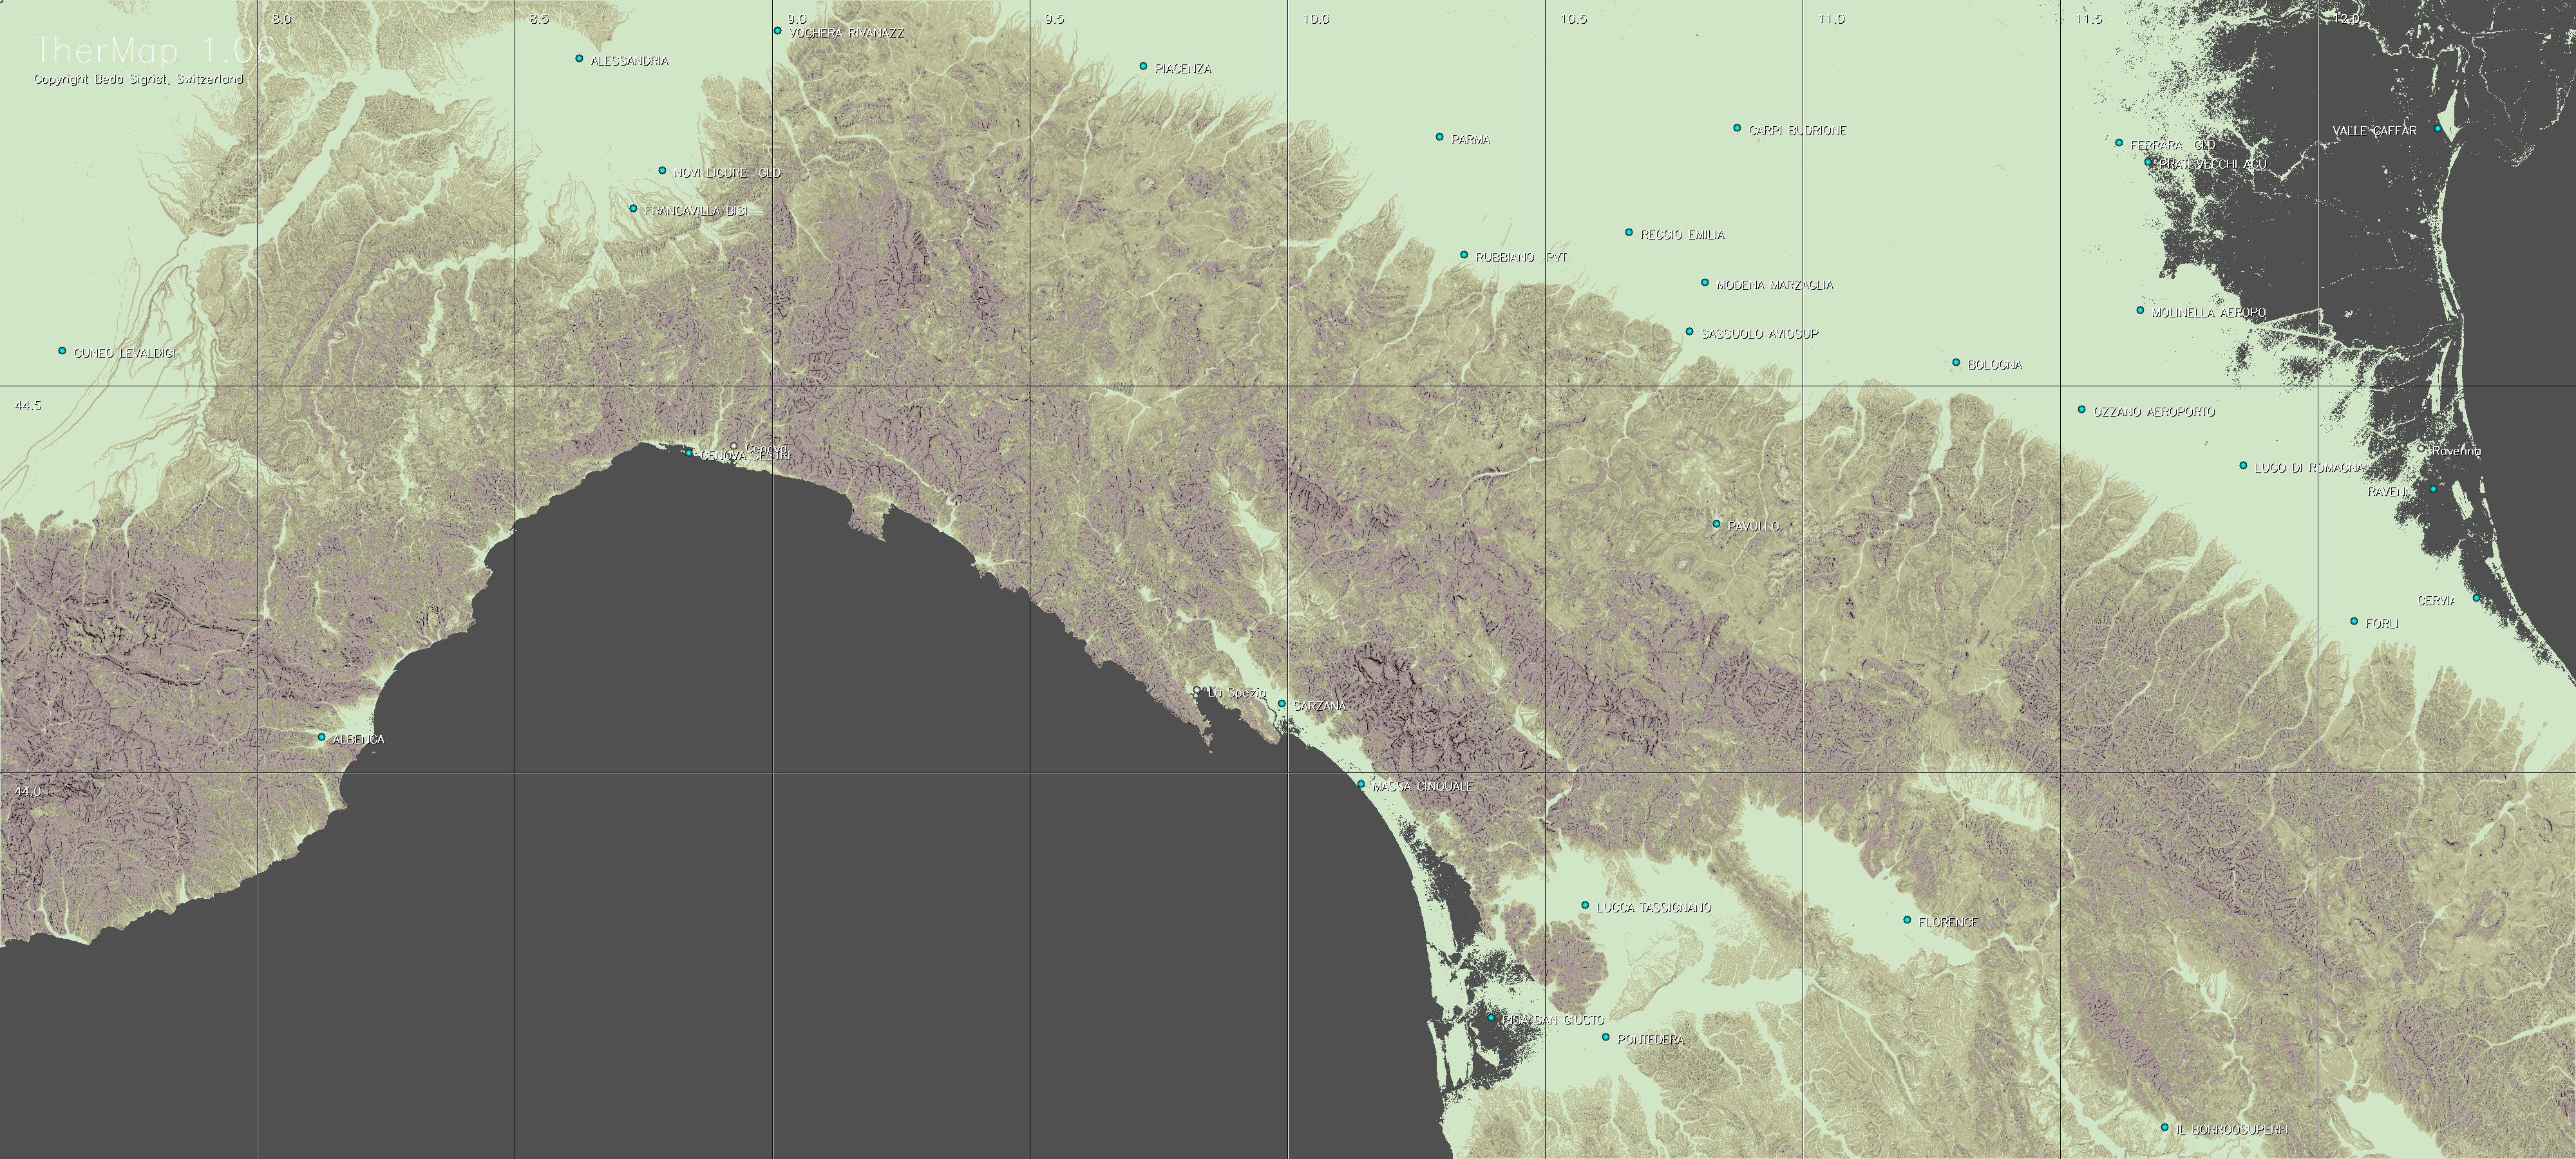
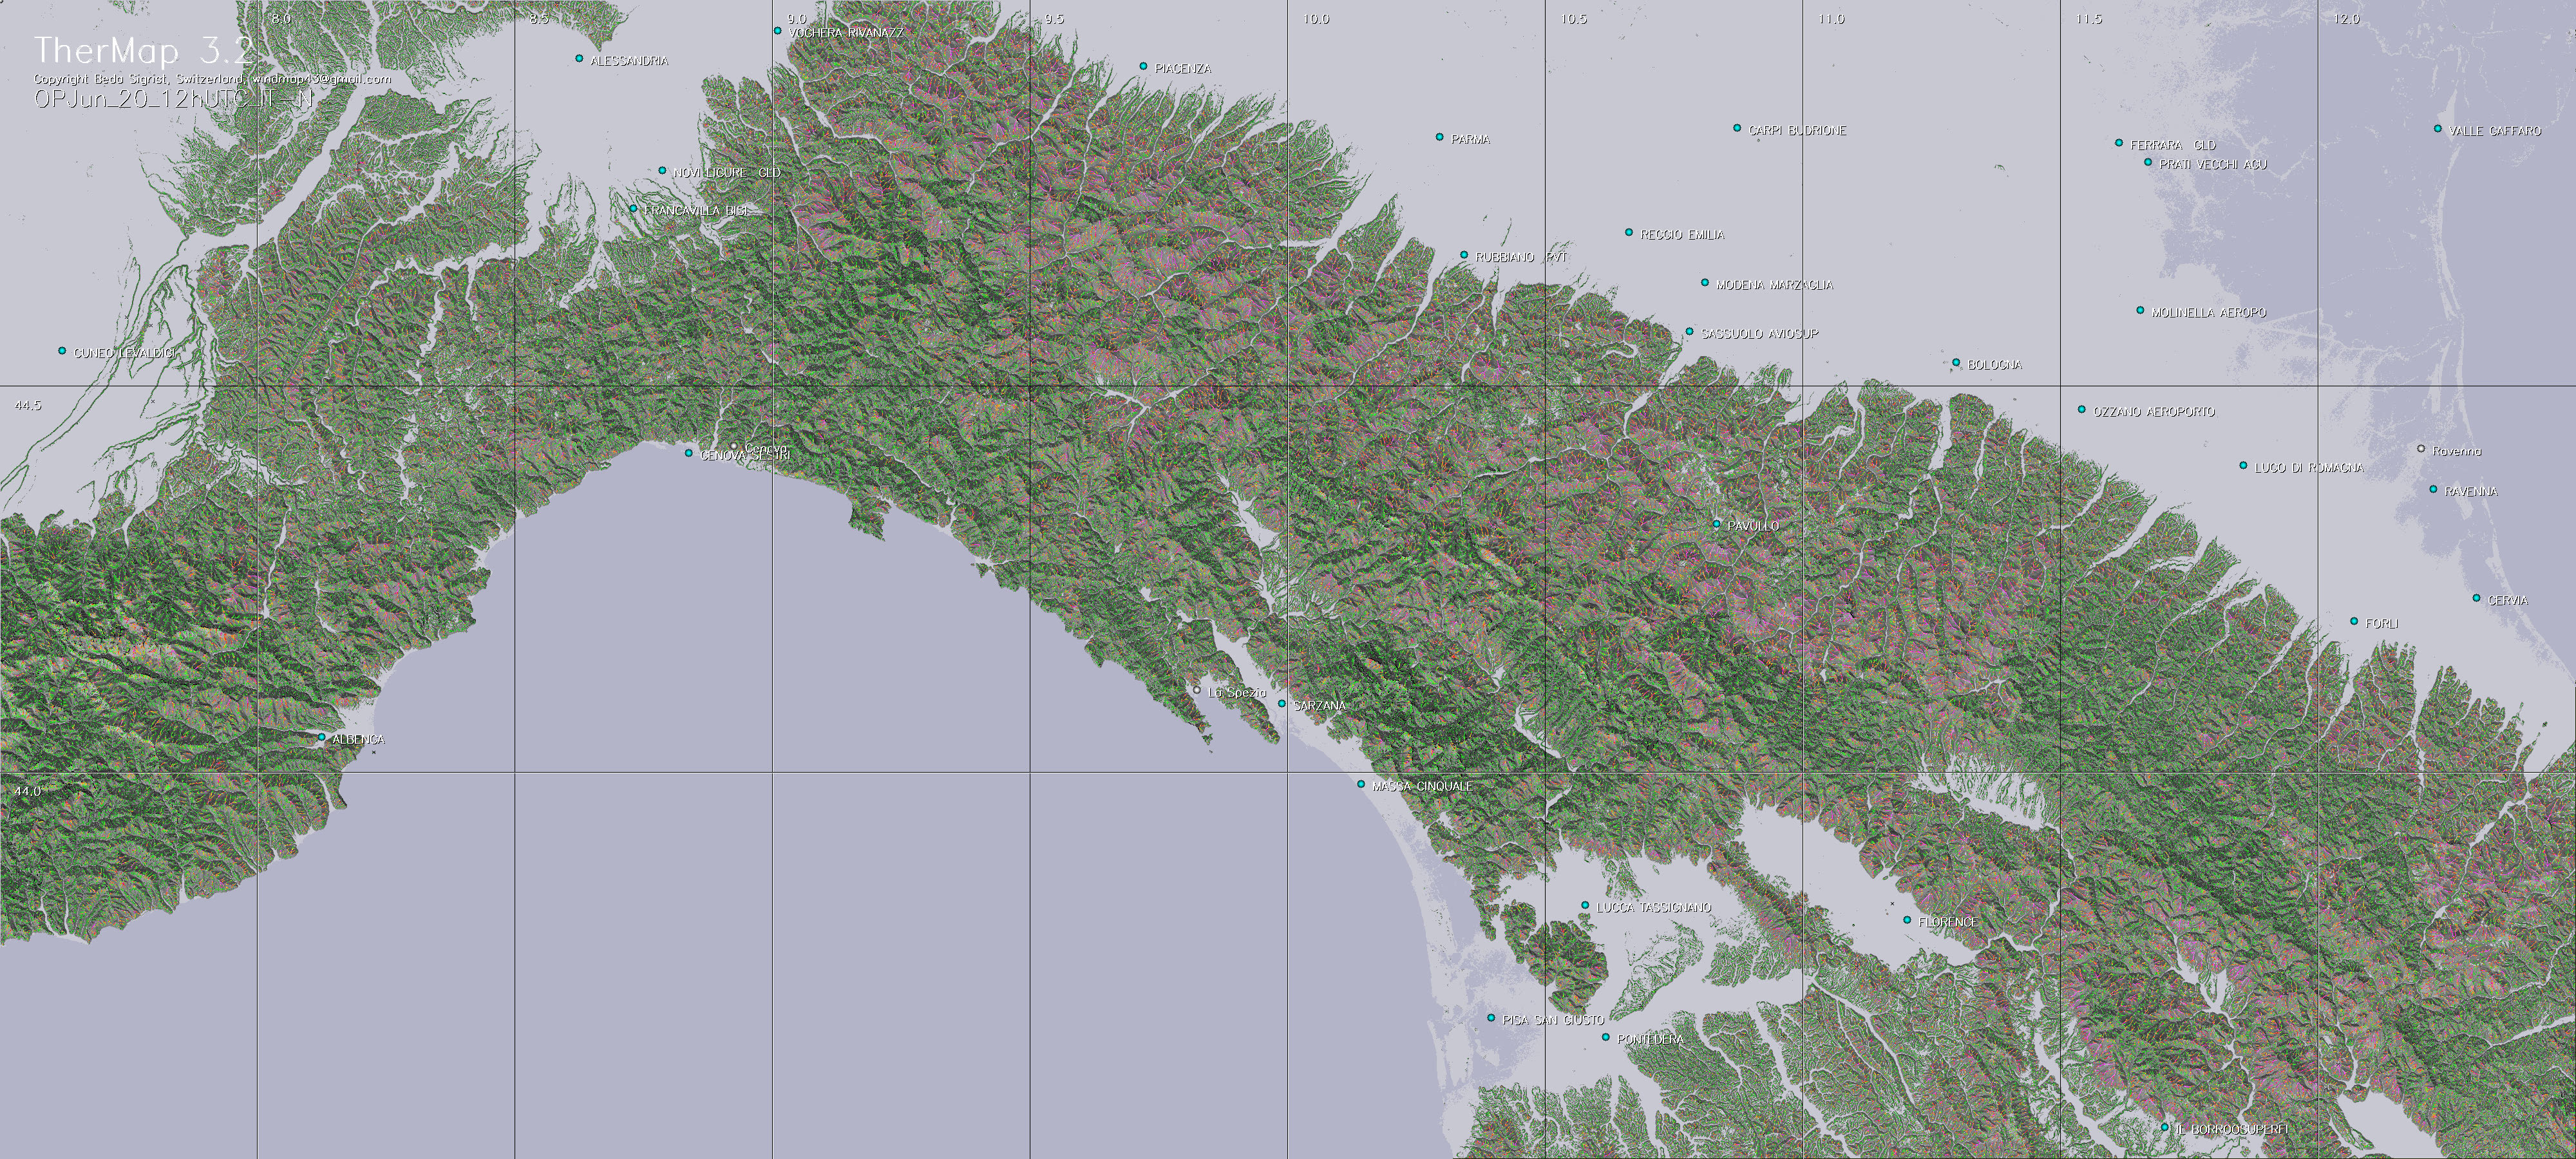
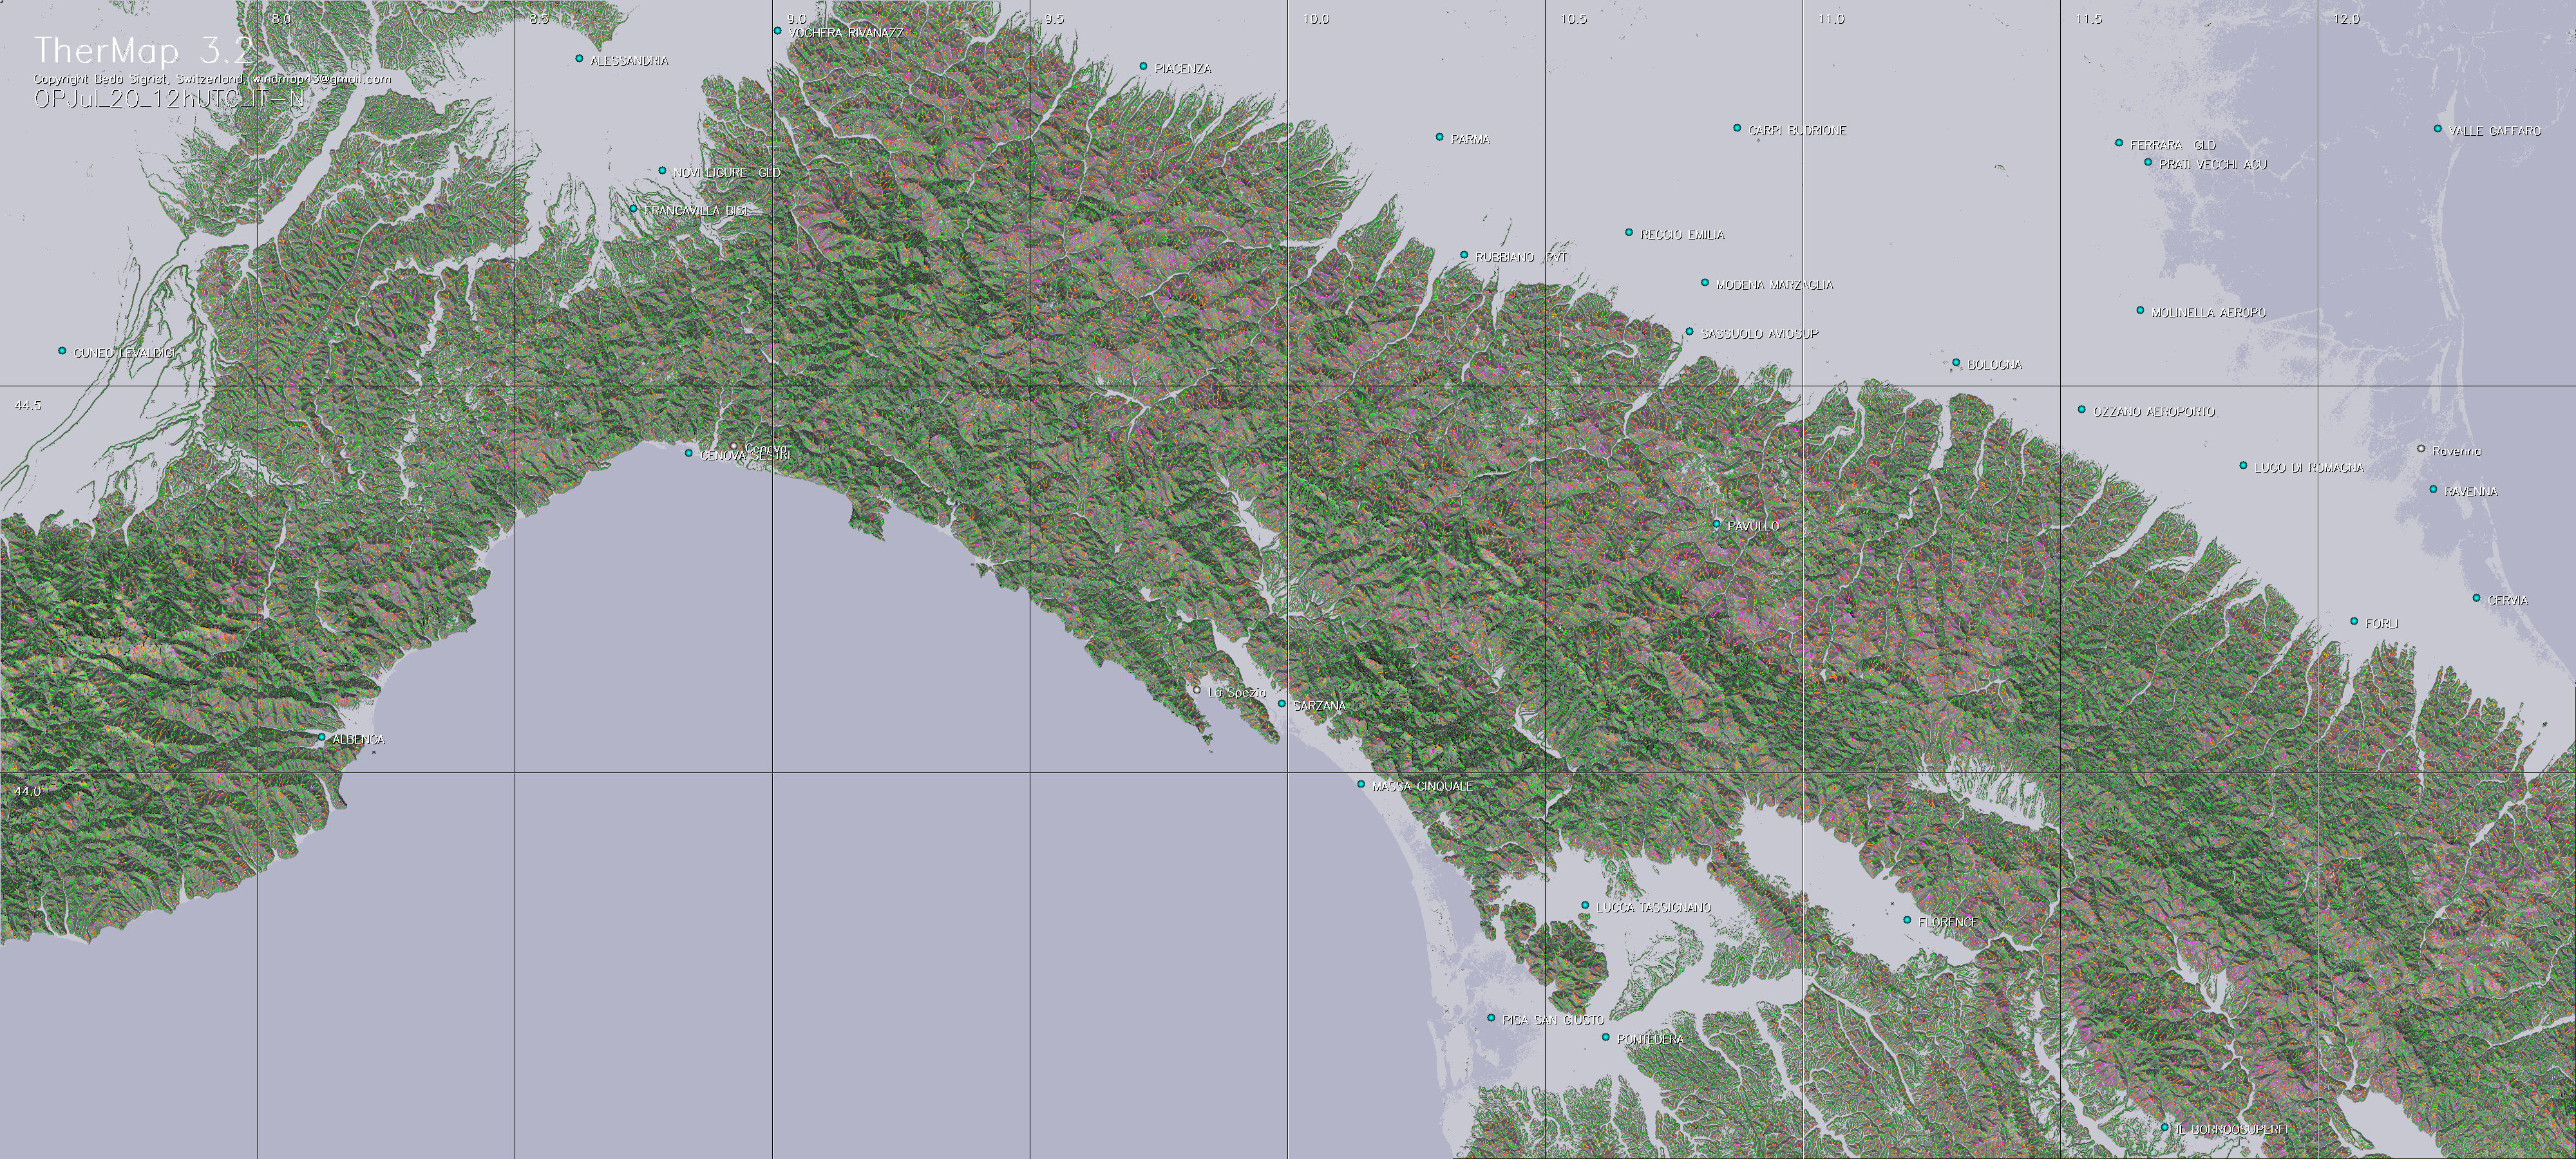
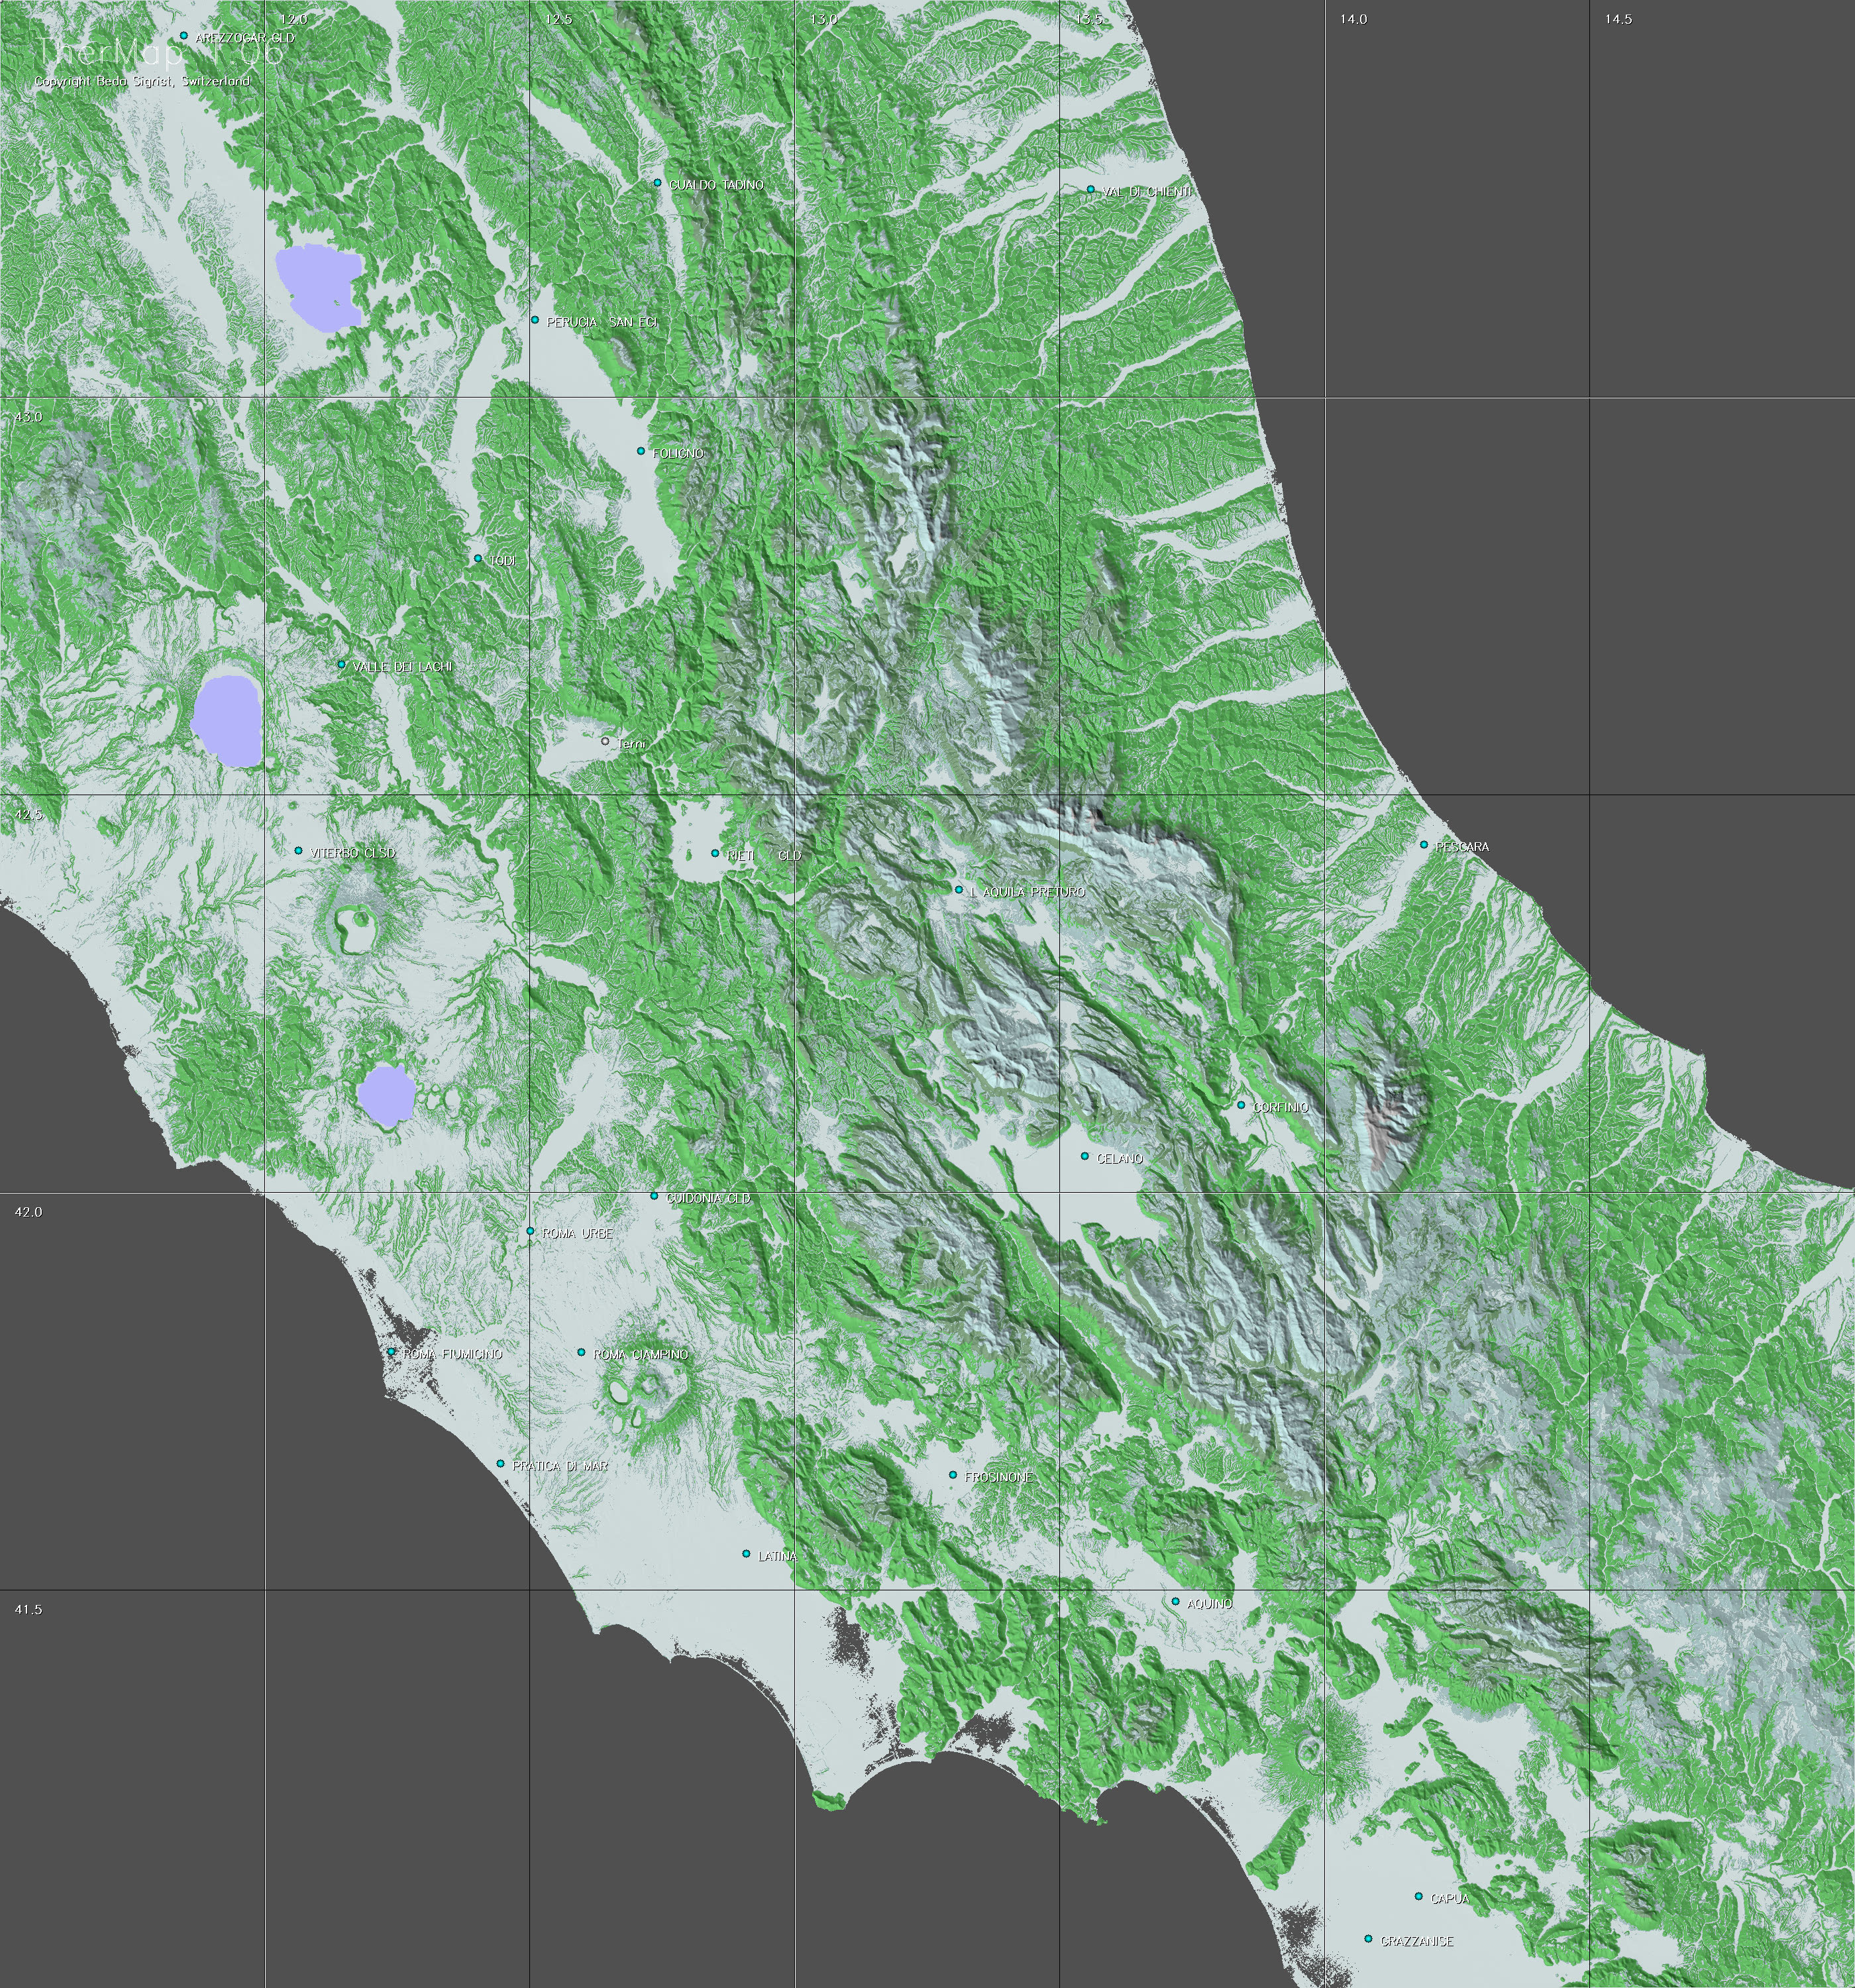
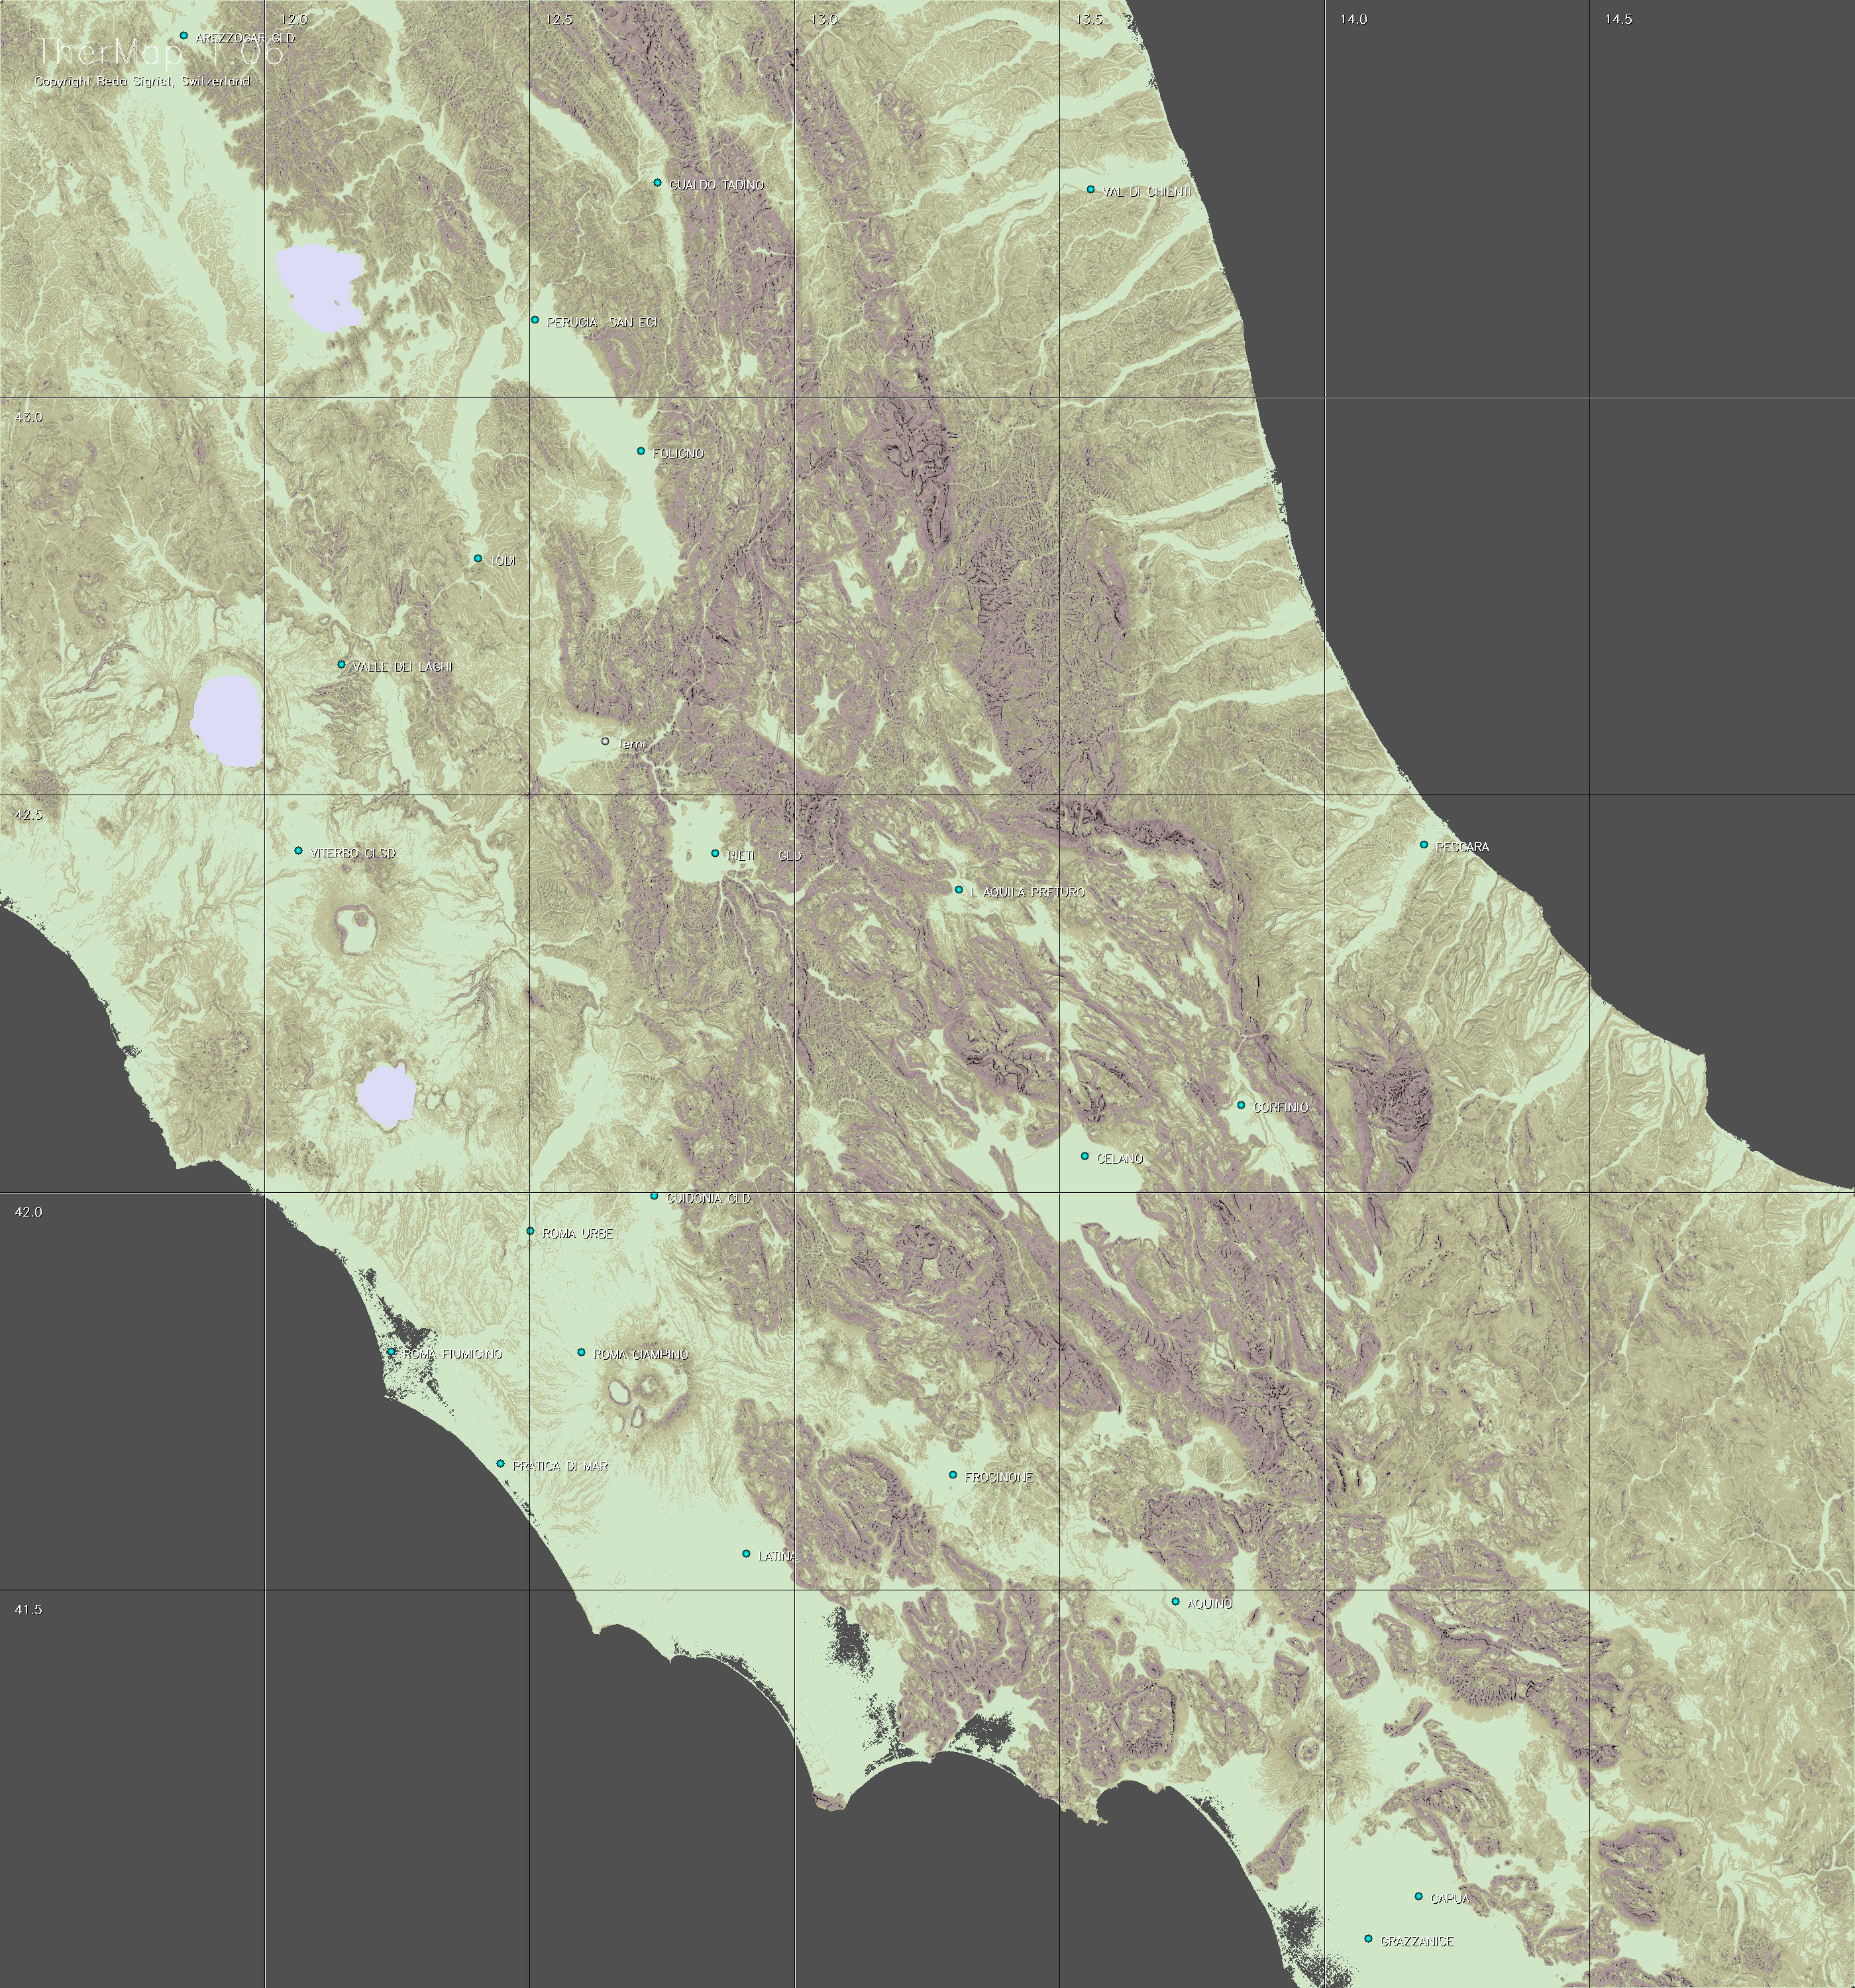
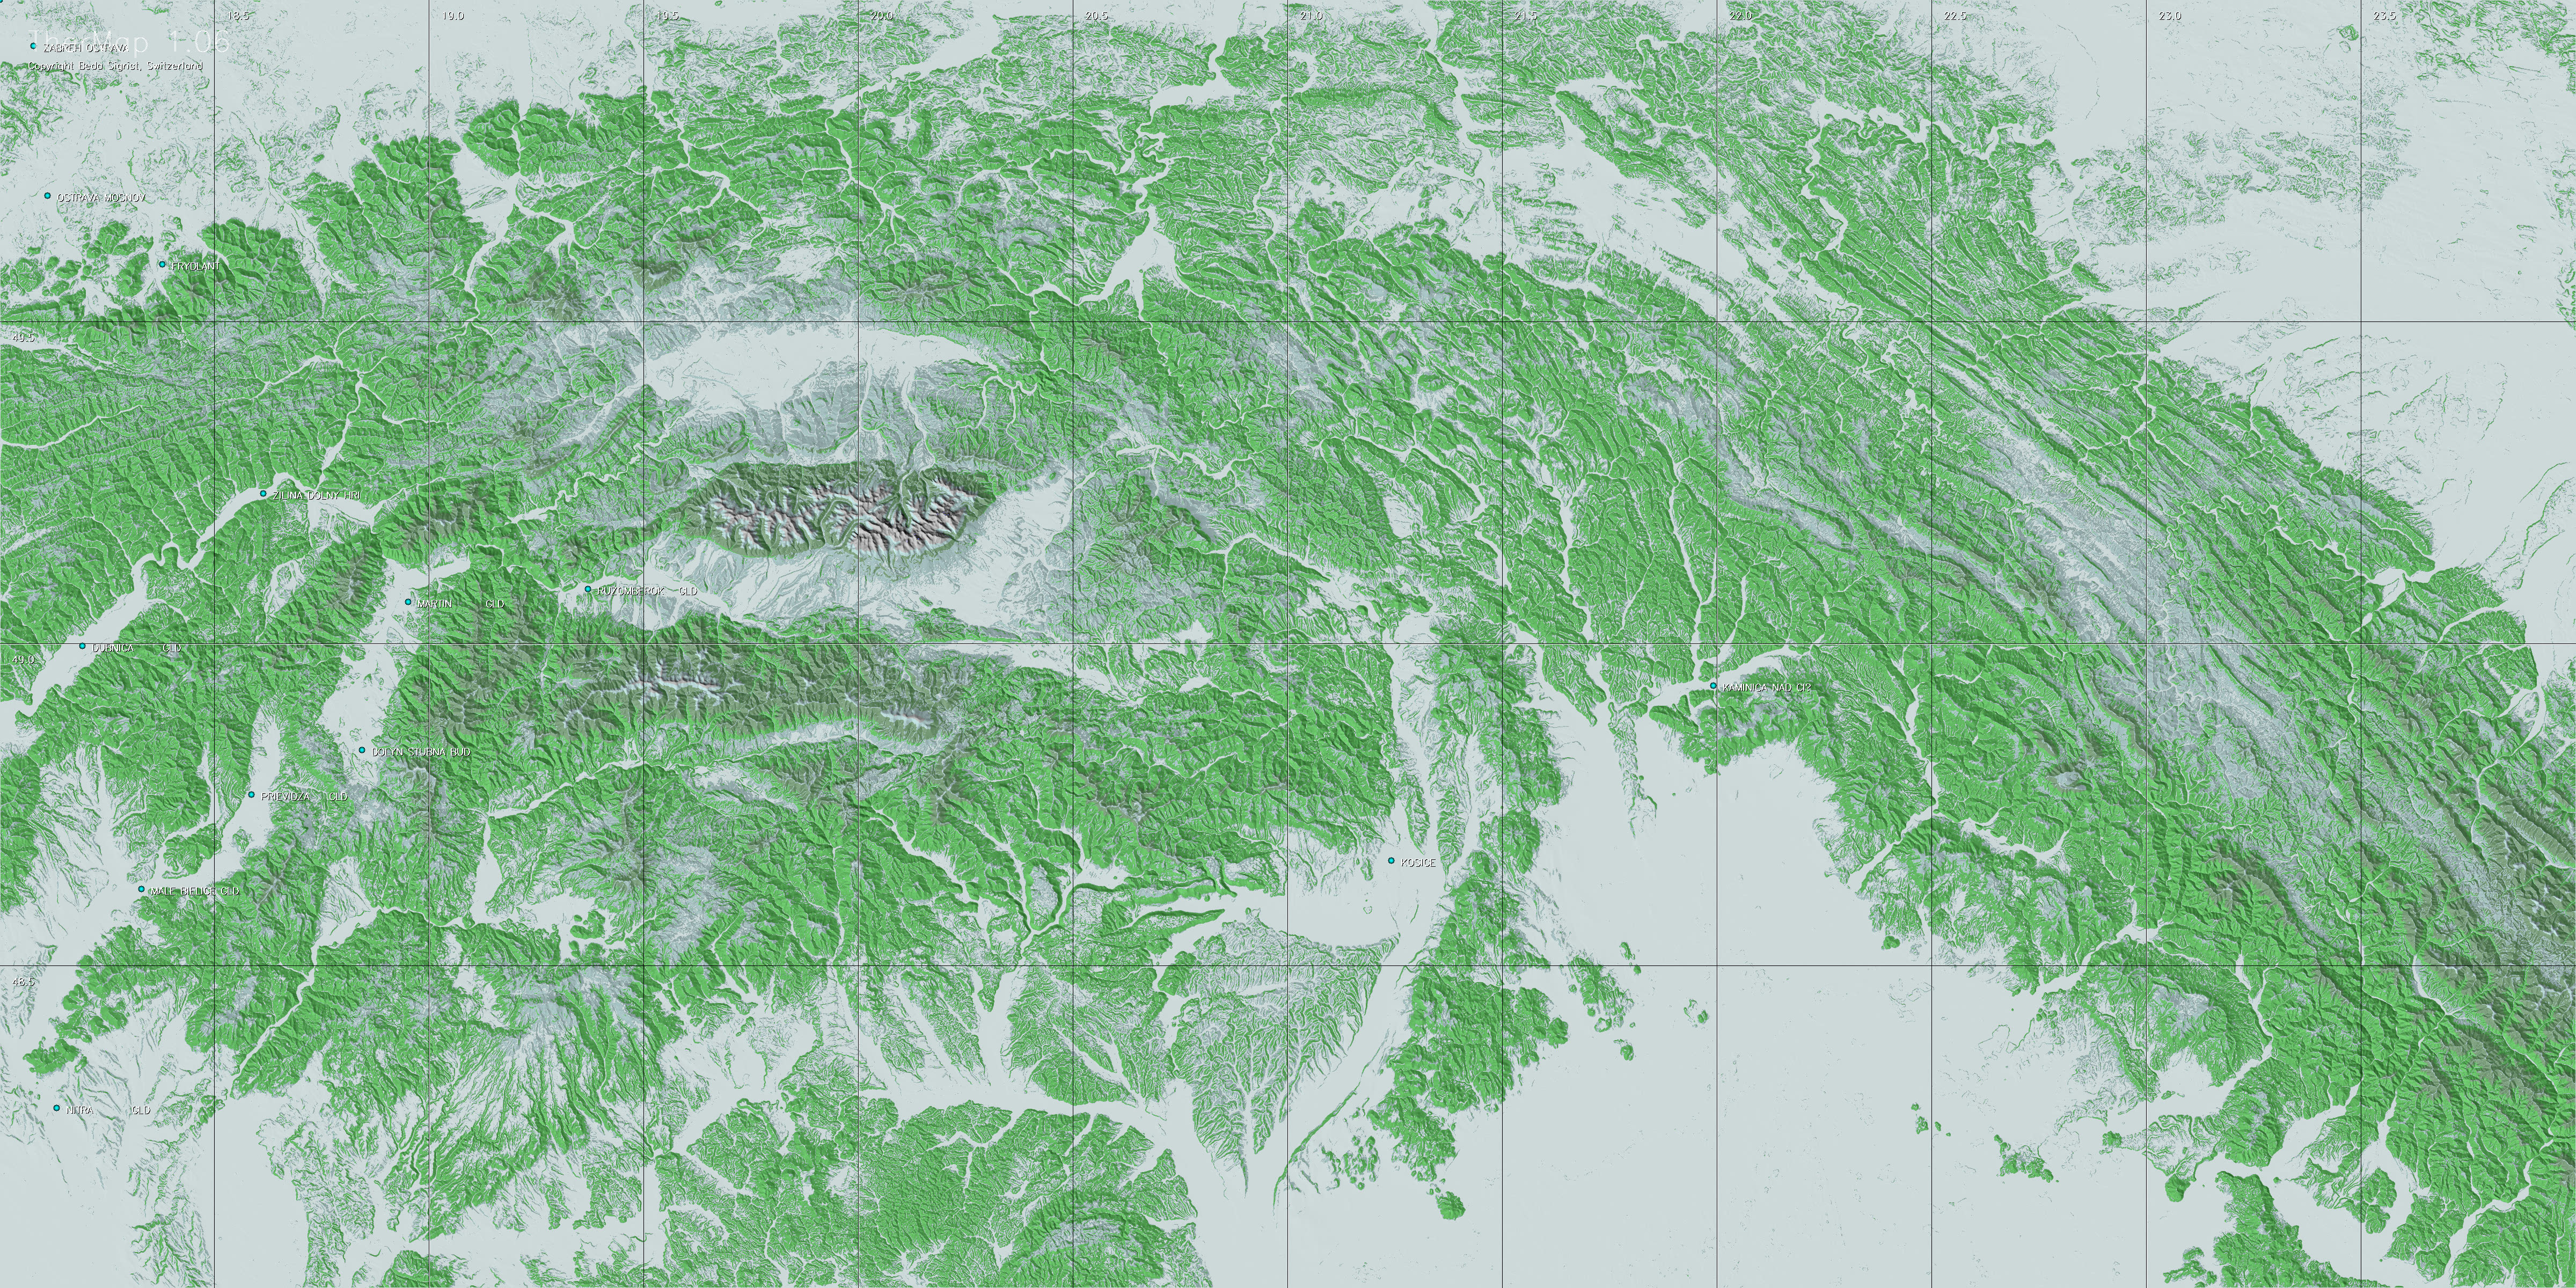
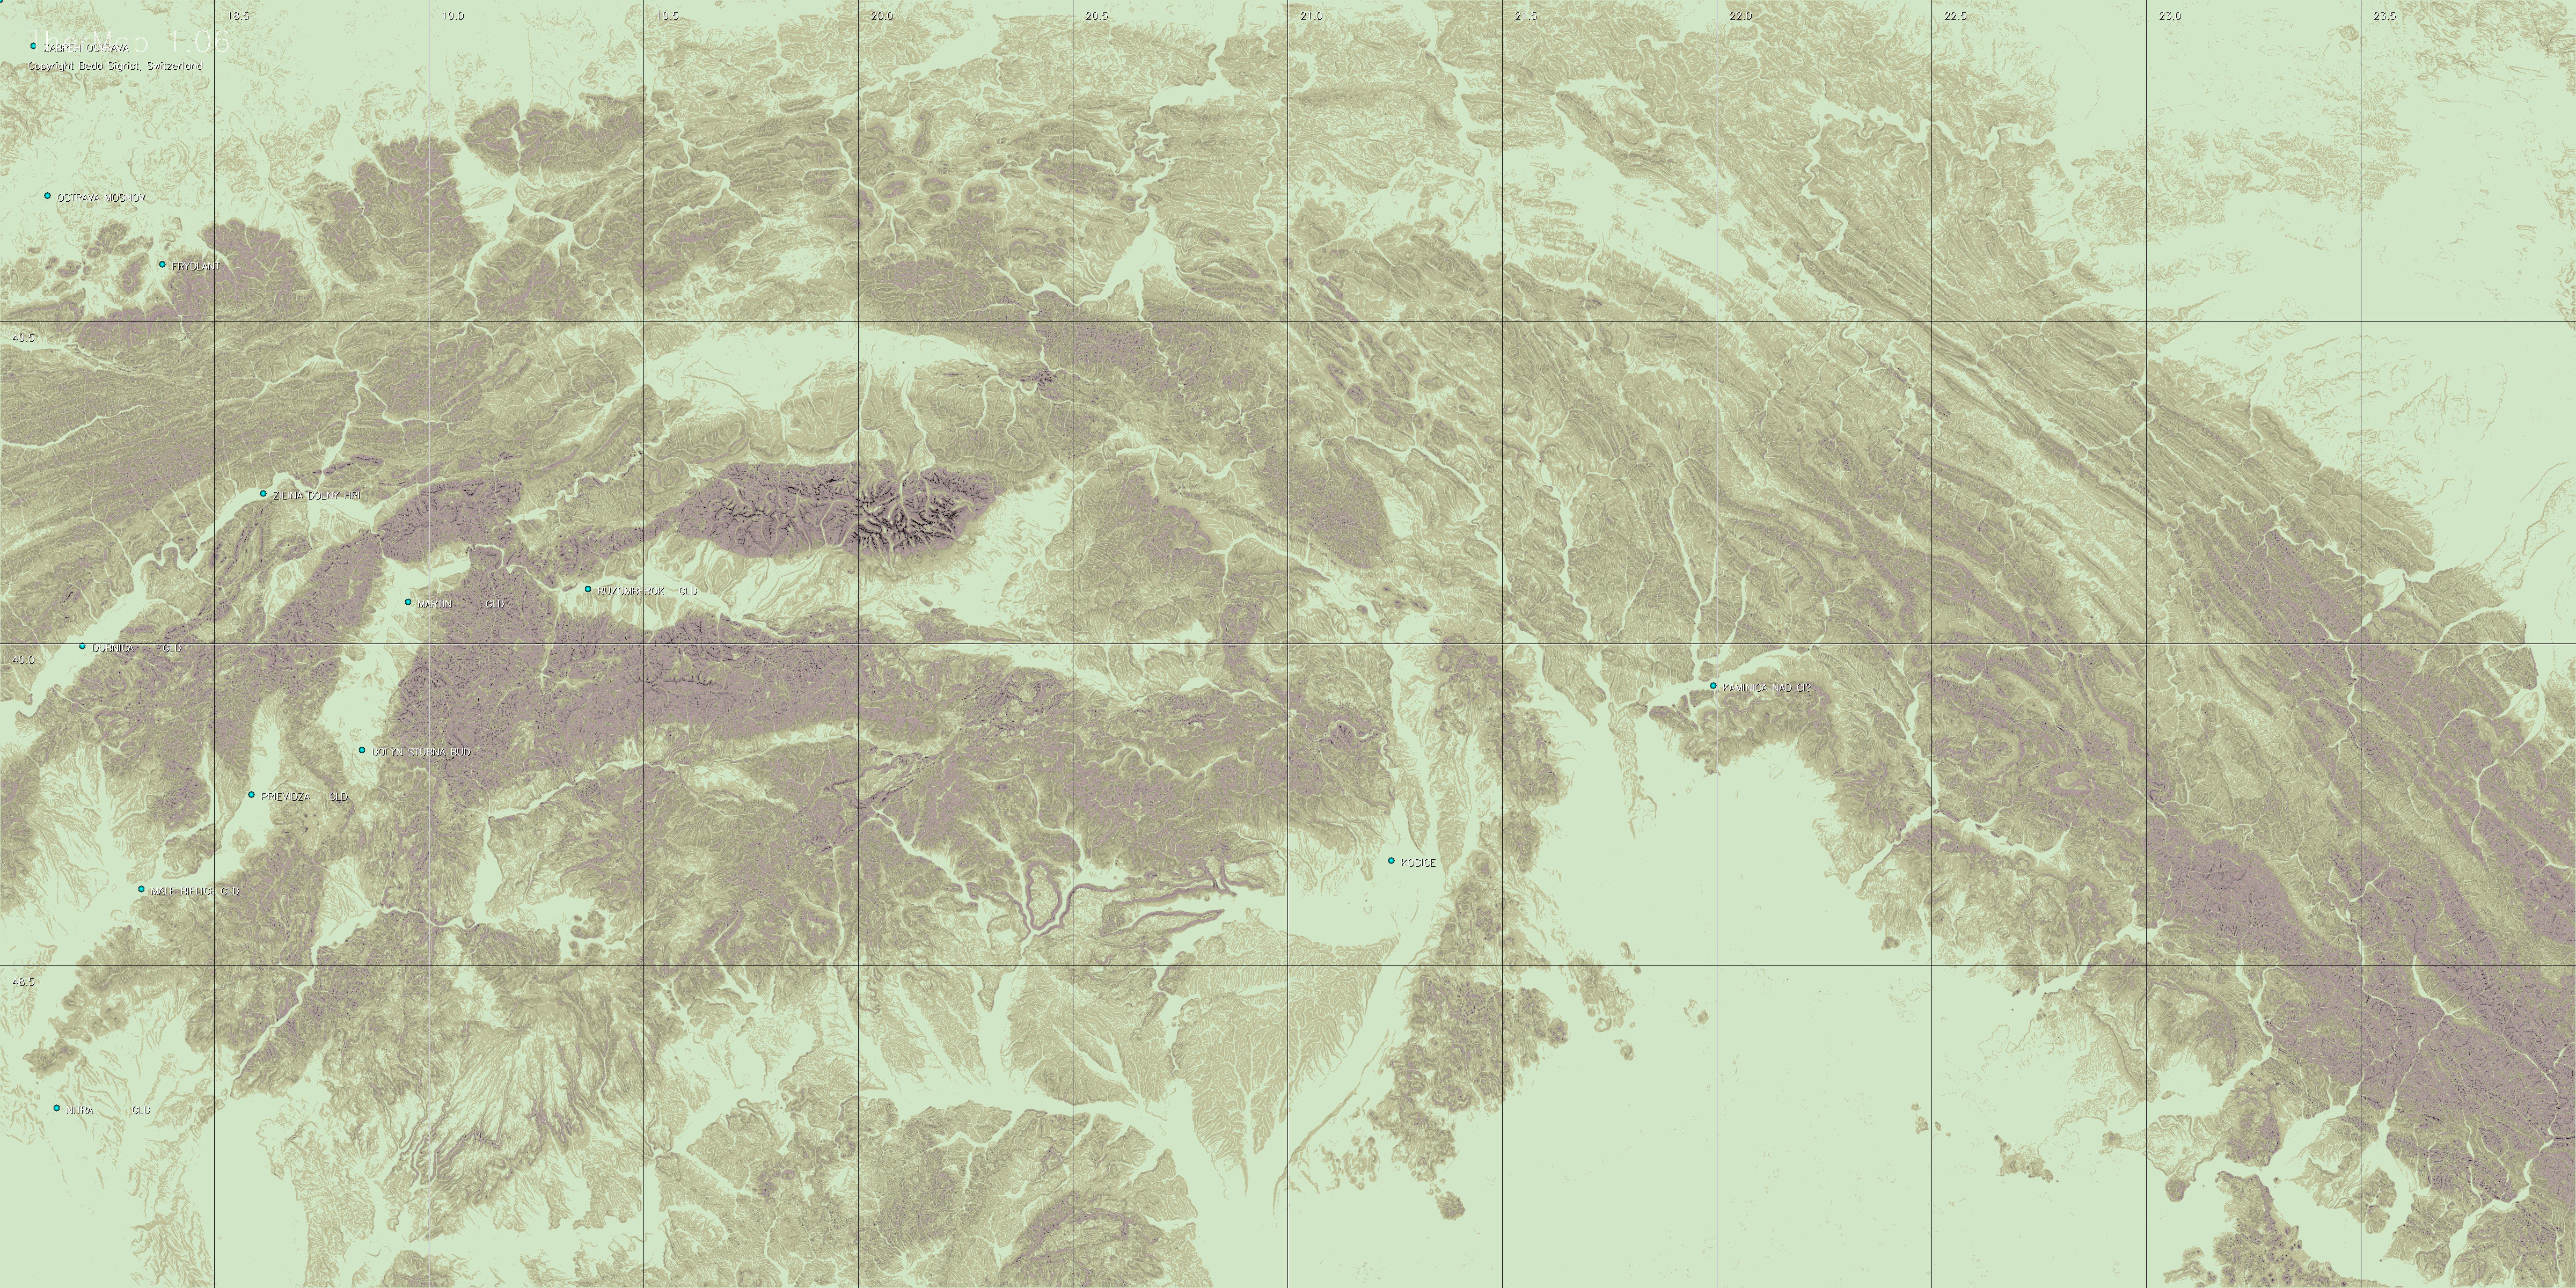
The complementary maps either show
the basic topography or the slope determined view of the
region.
|
EUROPE
|
Date
+
Time
|
|
|
|
|
|
|
|
|
|
April
01
|
April
25
|
May
20
|
June
20
|
July
20
|
Aug
15
|
Sep
10
|
Topography
and slope maps
|
|
Switzerland
|
Morning
|
|
|
|
|
|
|
|
|
|
Peak
|
|
|
|
|
|
|
|
|
Evening
|
|
|
|
|
|
|
|
|
France
Alps
|
Morning
|
|
|
|
|
|
|
|
|
|
Peak
|
|
|
|
|
|
|
|
|
Evening
|
|
|
|
|
|
|
|
|
Austria
|
Morning
|
|
|
|
|
|
|
|
|
|
Peak
|
|
|
|
|
|
|
|
|
Evening
|
|
|
|
|
|
|
|
|
Pyrenees
|
Morning
|
|
|
|
|
|
|
|
|
|
Peak
|
|
|
|
|
|
|
|
|
Evening
|
|
|
|
|
|
|
|
|
Apennine
North
|
Morning
|
|
|
|
|
|
|
|
|
|
Peak
|
|
|
|
|
|
|
|
|
Evening
|
|
|
|
|
|
|
|
|
Apennine
Center
|
Morning
|
|
|
|
|
|
|
|
|
|
Peak
|
|
|
|
|
|
|
|
|
Evening
|
|
|
|
|
|
|
|
|
Carpathia
West
|
Morning
|
|
|
|
|
|
|
|
|
|
Peak
|
|
|
|
|
|
|
|
|
Evening
|
|
|
|
|
|
|
|
|
USA
|
Date
Time
|
April
01
|
April
25
|
May
20
|
June
20
|
July
20
|
Aug
15
|
Sep
10
|
>Topography
and slope maps
|
|
Very North
Sierra Nevada
|
Morning
|
|
|
|
|
|
|
|
|
|
Peak
|
|
|
|
|
|
|
|
|
Evening
|
|
|
|
|
|
|
|
|
North
Sierra Nevada
|
Morning
|
|
|
|
|
|
|
|
|
|
Peak
|
|
|
|
|
|
|
|
|
Evening
|
|
|
|
|
|
|
|
|
Central
Sierra Nevada
|
Morning
|
|
|
|
|
|
|
|
|
|
Peak
|
|
|
|
|
|
|
|
|
Evening
|
|
|
|
|
|
|
|
|
South
Sierra Nevada
|
Morning
|
|
|
|
|
|
|
|
|
|
Peak
|
|
|
|
|
|
|
|
|
Evening
|
|
|
|
|
|
|
|
© Wafer: All
maps of this collection are provided by the copyright
holder solely as an informational tool for the planning
of the best course of soaring flights. In particular,
airports and landing places are indicated mainly for
geographical reference without guarantees about their
exact location and/or their operational conditions.
These maps are not intended to be used for navigation.
Pilots should independently confirm all information
regarding airports and landing places and other information
required for navigation, and obtain an official briefing
before flight. In no event shall the copyright holder
or the contributors be liable for any direct or consequential
damages caused by incorrect, obsolete or missing graphical
or written content.
The copyright holder:
Beda Sigrist, Switzerland
Viewing
with Google Earth
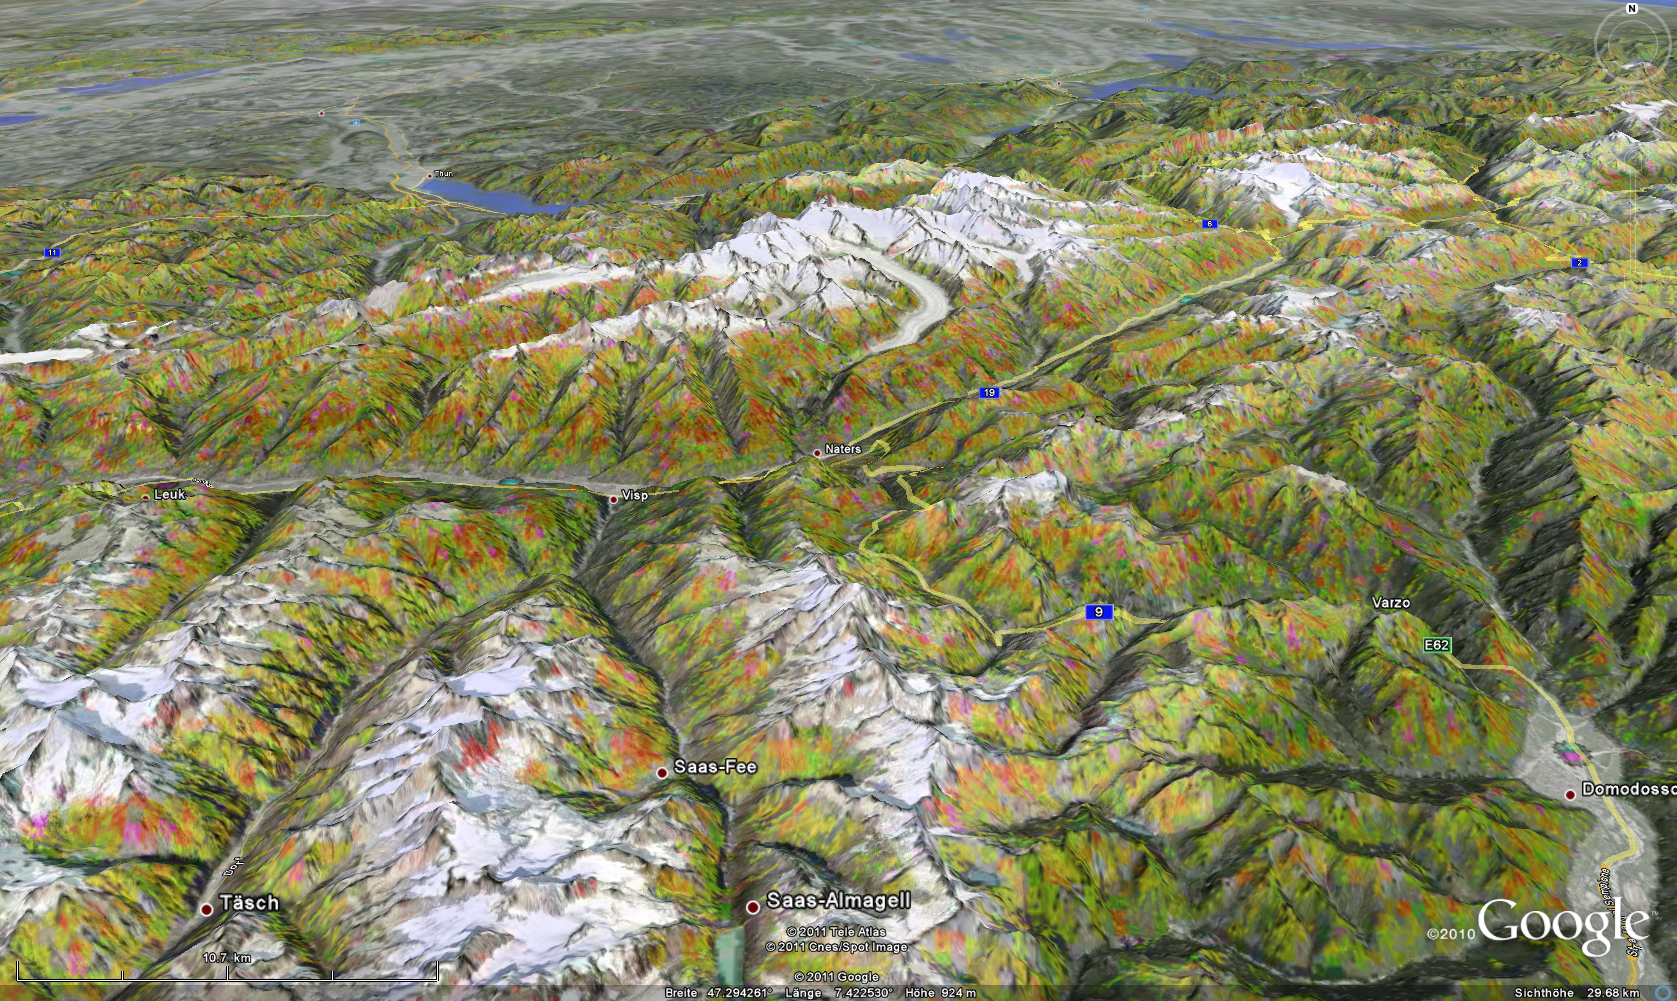
A 3D view may facilitate
the perception of a thermal landscape, as illustrated
by this example.
Users having installed Google Earth©
on their PCs (not on tablets or
smartphones) can generate such perspectives themselves
and/or simulate flights in a "landscape with visible
thermals". In addition actual flight records (converted
to KML file format) can be superimposed to review a
flight. Note that Google Earth running on Android does
not yet permit to use the kmz-files.
TherMap is based on the same topographic data (SRTM)
as Google Earth. It is possible to link TherMap files
with Google Earth within seconds. Before doing this
you should be aware of the following:
In order to avoid a significant loss in image resolution
(due to a constraint of Google Earth), the original
charts had to be cut into tiles of two square degrees
which are therefore referred to at the lowest level
of the Google selection tree. TherMap actual had to
generate almost 3000 tile files for this purpose. The
resulting Google selection hierarchy looks as
follows
(1) TherMap3-3D> (2)
Region > (3) Region+date+daytime> (4) Tile
(coordinates of left lower corner)
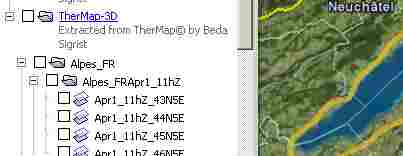
It is crucial to
never select the maps above the level of the "Region
+ Date + Daytime"i.e. level 3.
Above this level Google overlays all maps below the
level selected, e.g. all dates and daytimes of
a selected region, which would be meaningless. It is
however also possible to activate several adjacent regions
for a specific date and daytime. Note that loading the
tiles still takes a few seconds with Google Earth.
Example
of how to use Google Earth:
Suppose you want to see the area around
Lake Mono (US) on June 1 at 19hUTC,
click on the link below: "US Maps
(Sierra Nevada)" and confirm that
you want to open this link with Google
Earth, upon which the Google screen
appears.
-
Under "Places"
at left first click the "+"
box to expand the map selection e.g. "TherMap2_USA-3D".
You will see the regions available.
-
Then click
the "+" box of "SraNevd_C"
(i.e. the Sierra Nevada between 37 and 39
deg latitude).
Google then shows the dates and daytimes available
for this region.
-
Check the
empty square on the left of "SraNevd_CJun1_19hZ"
to select all maps for this region ,date and
time. Google then switches on the map tiles
of this region and adds the list of these
tiles.
-
Unselect
the tiles you do not need. In our case these
are the ones ending with 37N117W, 38N117W,
37N115W, and 38N115W, leaving
the four map tiles around Mono Lake. Then
zoom into them...
|
Google overlay picture
transparency is set at 20-35 percent, in order to
still perceive the underlying Google landscape. The
transparency can be changed manually at tile (= lowest)
level by right-clicking on the selected field,
then clicking on "Properties" and finally
adjusting the transparency slider on top of the
property window.
Right-click
on the region for which you want to download
the kmz-file
on your desktop. Then click on the downloaded
kmz-file to open
Google Earth showing the selection of TherMap
files >
|
|
|
Links
-
-
-
-
-
-
Meteorological panel
of OSTIV
-
-
-
Alfred Ultsch: "Thermikstrassenkarten",
Segelfliegen, 3/2010
-
-
-
Sergio Colacevich: Sierra
Nevada Great Basin TherMaps, Soaring,
July 2011
-
Contact:
If you have any comments, suggestions, or questions, you
are welcome to directly contact the author Beda Sigrist by
e-m@ail.
|
|