How to open OLC flight tracks in
Google Earth and
view them on a TherMap backdrop
OLC (Online Contest) is a free service permitting to publish flight records of gliders on the Internet and to have them scored and ranked according to different categories. Members can view and download the flights published by OLC. Membership is free, but voluntary contributions are welcome.
Besides the standard IGC-format, OLC publishes the flight record files also in the KML-format of Google Earth.
1. Viewing a flight on Google Earth
To open and view a flight on Google Earth one has to first log in as a member and then either open the desired file directly or after having downloaded it from OLC. Upon double clicking on the kml-file of the flight the map opens automatically under Google Earth.
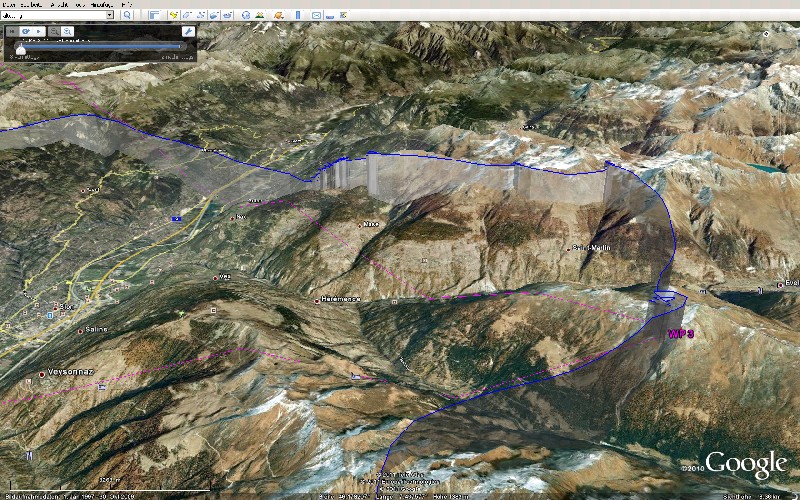
Using the viewing features of Google
Earth, selected parts of the flight can then be studied under any
observation angle, as for instance shown in the following figure.
It displays part of a flight (in Switzerland) starting on the left
with the crossing of a wide valley, followed by the regaining of altitude
and the crossing of some side valleys.
The main limitation of this representation is that the flights are presently only shown in space and time. Other flight parameters, such as the flight velocity, vario readings or the wind situation, which can for instance be color coded in the flight track of SeeYou, cannot be displayed, at least for the time being. Despite its limitations the KML-representations of OLC seem to be the best available today. Different other IGC to KML converters are however offered on the Internet and the future will certainly bring further improvements.
![]()
2. Adding TherMap backdrops to Google Earth
The TherMap website describes how to link the TherMap library with Google Earth and how to activate the correct date and daytime for the backdrop. In the case of the above flight, this leads to the following result:
SeeYou then displays the flight on the selected TherMap backdrop, as shown on the following figure. Since TherMap is a color map, the color coded flight track does not contrast well. The example below nevertheless demonstrates a high correlation between the thermal potential of TherMap and the actual variometer readings of the flight track.

One can clearly see that the pilot has been aiming at the hotspots on the other side of the main valley and that he tended to follow into the side valley along the snow limit, where thermals typically take off. What the picture cannot show here are the altitude limitation due to the cloud base. On a day with stronger winds one might also discover the effect of the wind shift.