|
How to open
OLC flight tracks in SeeYou
SeeYou can open the flight record in IGC as well as LXN format and then save them in either IGC, MUL, BMP, OLC or JPG format, thereby working also as a format converter. However SeeYou does not offer conversions to the KML format of Google Earth. Users interested to do that are advised to read the instructions for analyzing flights with Google Earth.
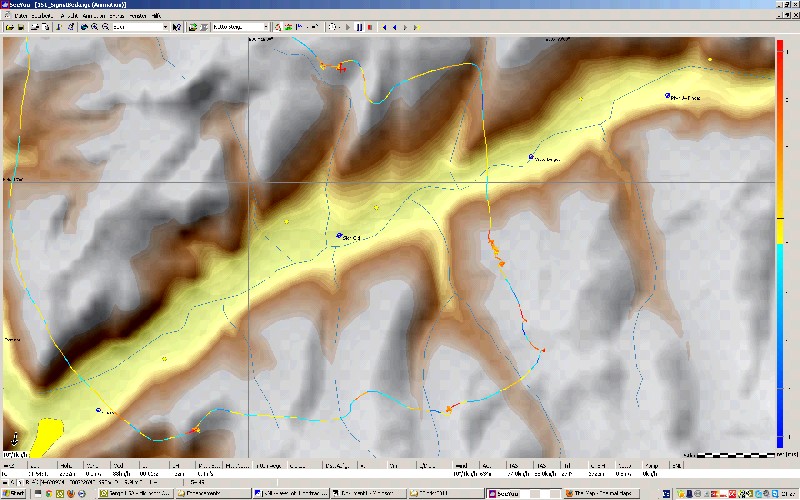
Users having installed SeeYou can open an IGC or LXN flight record file, or after having downloaded it from OLC, to view the flight typically as shown in the figure below. This example contains the track of a flight coming from the north, before crossing a large valley and then regaining altitude and continuing across the side valleys further south. Here, the color of the flight track has been selected to be the variometer reading. SeeYou actually offers 15 different possibilities for colouring the flight track, which is a real advantage. Due to the variometer color coding one can easily see how the pilot has been regaining altitude after having crossed the main valley.
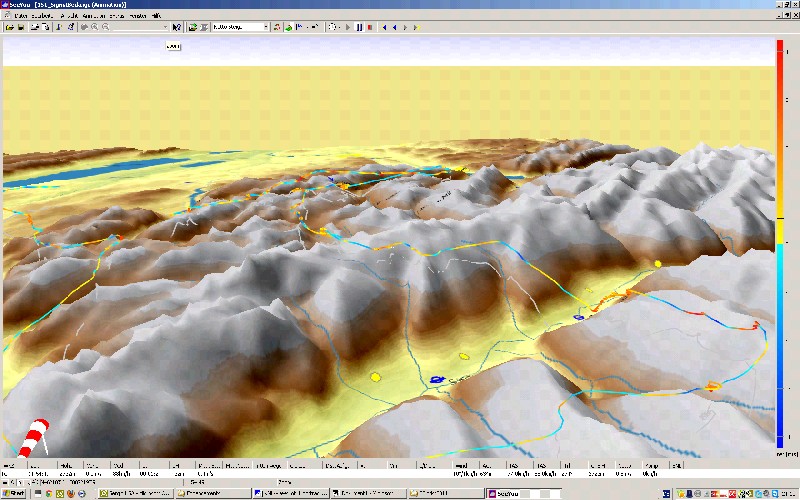
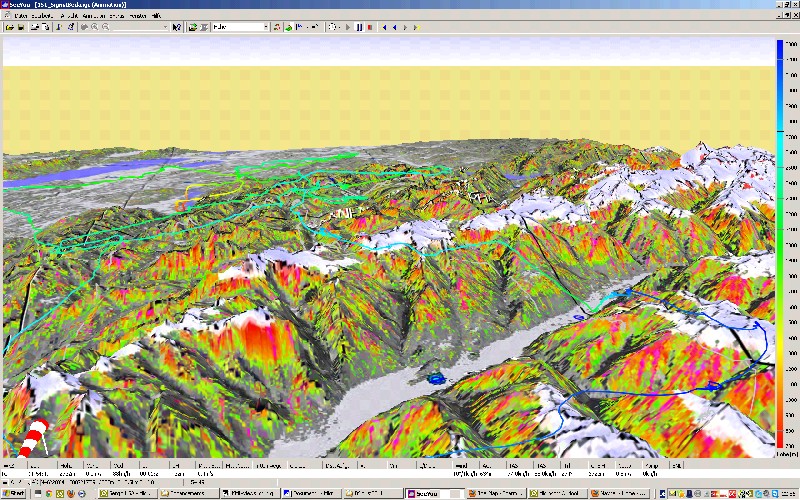
SeeYou also permits to view
flights in 3D. In this case one can see not only the actual
flight track, but also the ground trace showing exactly the
locations over which the glider has been flying.
SeeYou offers also the use of
more detailed Raster Maps derived from satellite pictures. However,
although the latter show more surface detail, they hardly provide
further insights on thermal processes linked with the landscape.
This is where TherMap can provide further insights. 2. Adding TherMap
backdrops to SeeYou
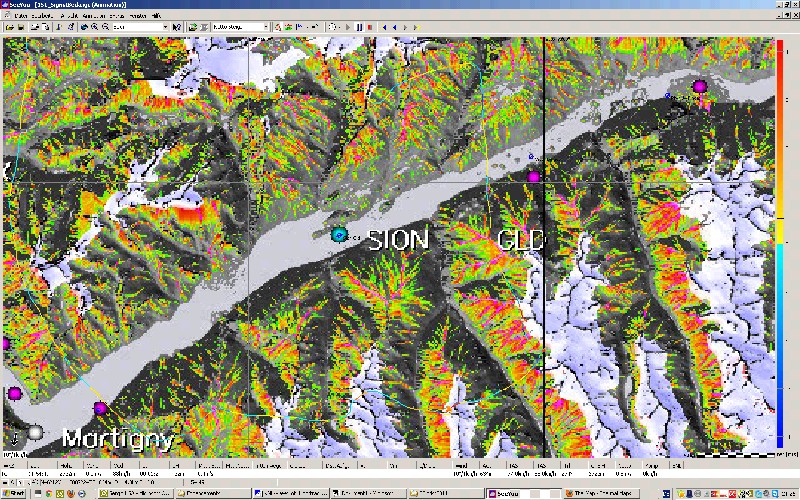
SeeYou then displays the flight
on the selected TherMap backdrop, as shown on the following figure.
Since TherMap is a color map, the color coded flight track does
not contrast well. The example below nevertheless demonstrates
a high correlation between the thermal potential of TherMap and
the actual variometer readings of the flight track.
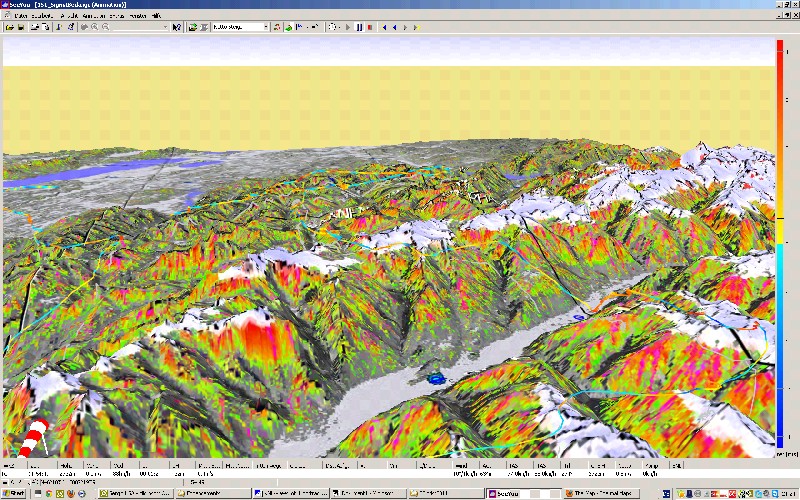
In the 3D-view the ground trace
crossing hotspot areas usually shows high variometer
readings, thus illustrating once again the validity of the
TherMap model.
By changing the
color coding parameter of the flight track, it is possible to
obtain a better contrast, as illustrated in the following figure
in which the flight track has been color coded by the altitude.
The original SeeYou user
guide can be downloaded in different languages. See >Tools>Rastermaps
for more. These manuals also elaborate on the different procedures
and map types.
|