 |
|
Using a relatively simple model, these maps have been computed to reveal the effect of ridge winds. Numerous validations with actual flight records have revealed that the maps reflect the real situation quite well, provided that the underlying wind direction correspond to the locally prevailing wind. A particular advantage of this approach is that the maps also show the thermal potential of less visited regions.
© The utilization of the maps for noncommercial
purposes remains free. For commercial uses, quotations, as well for
further publication, written
copyright permission must be obtained via the mail address mentioned
at the end of this site.
| Introduction | The Model | Using the maps | Map downloads | View maps in Google Earth | FAQ | Links/Contact |
Introduction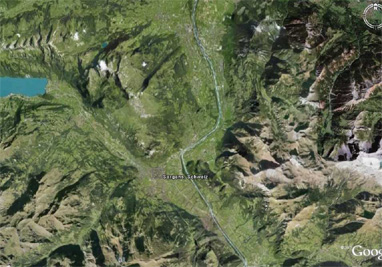
During the last years long distance mountain flights have demonstrated the often underestimated potential of ridge winds. Due to this, and following the positive experiences with TherMap, the meteorological section of OSTIV also expressed an interest in ridge wind maps. WindMap is an attempt to provide an answer to this.
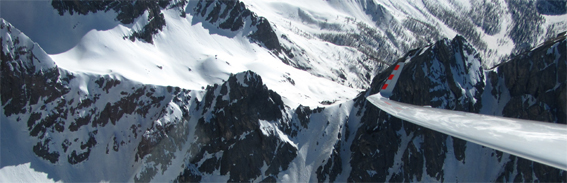
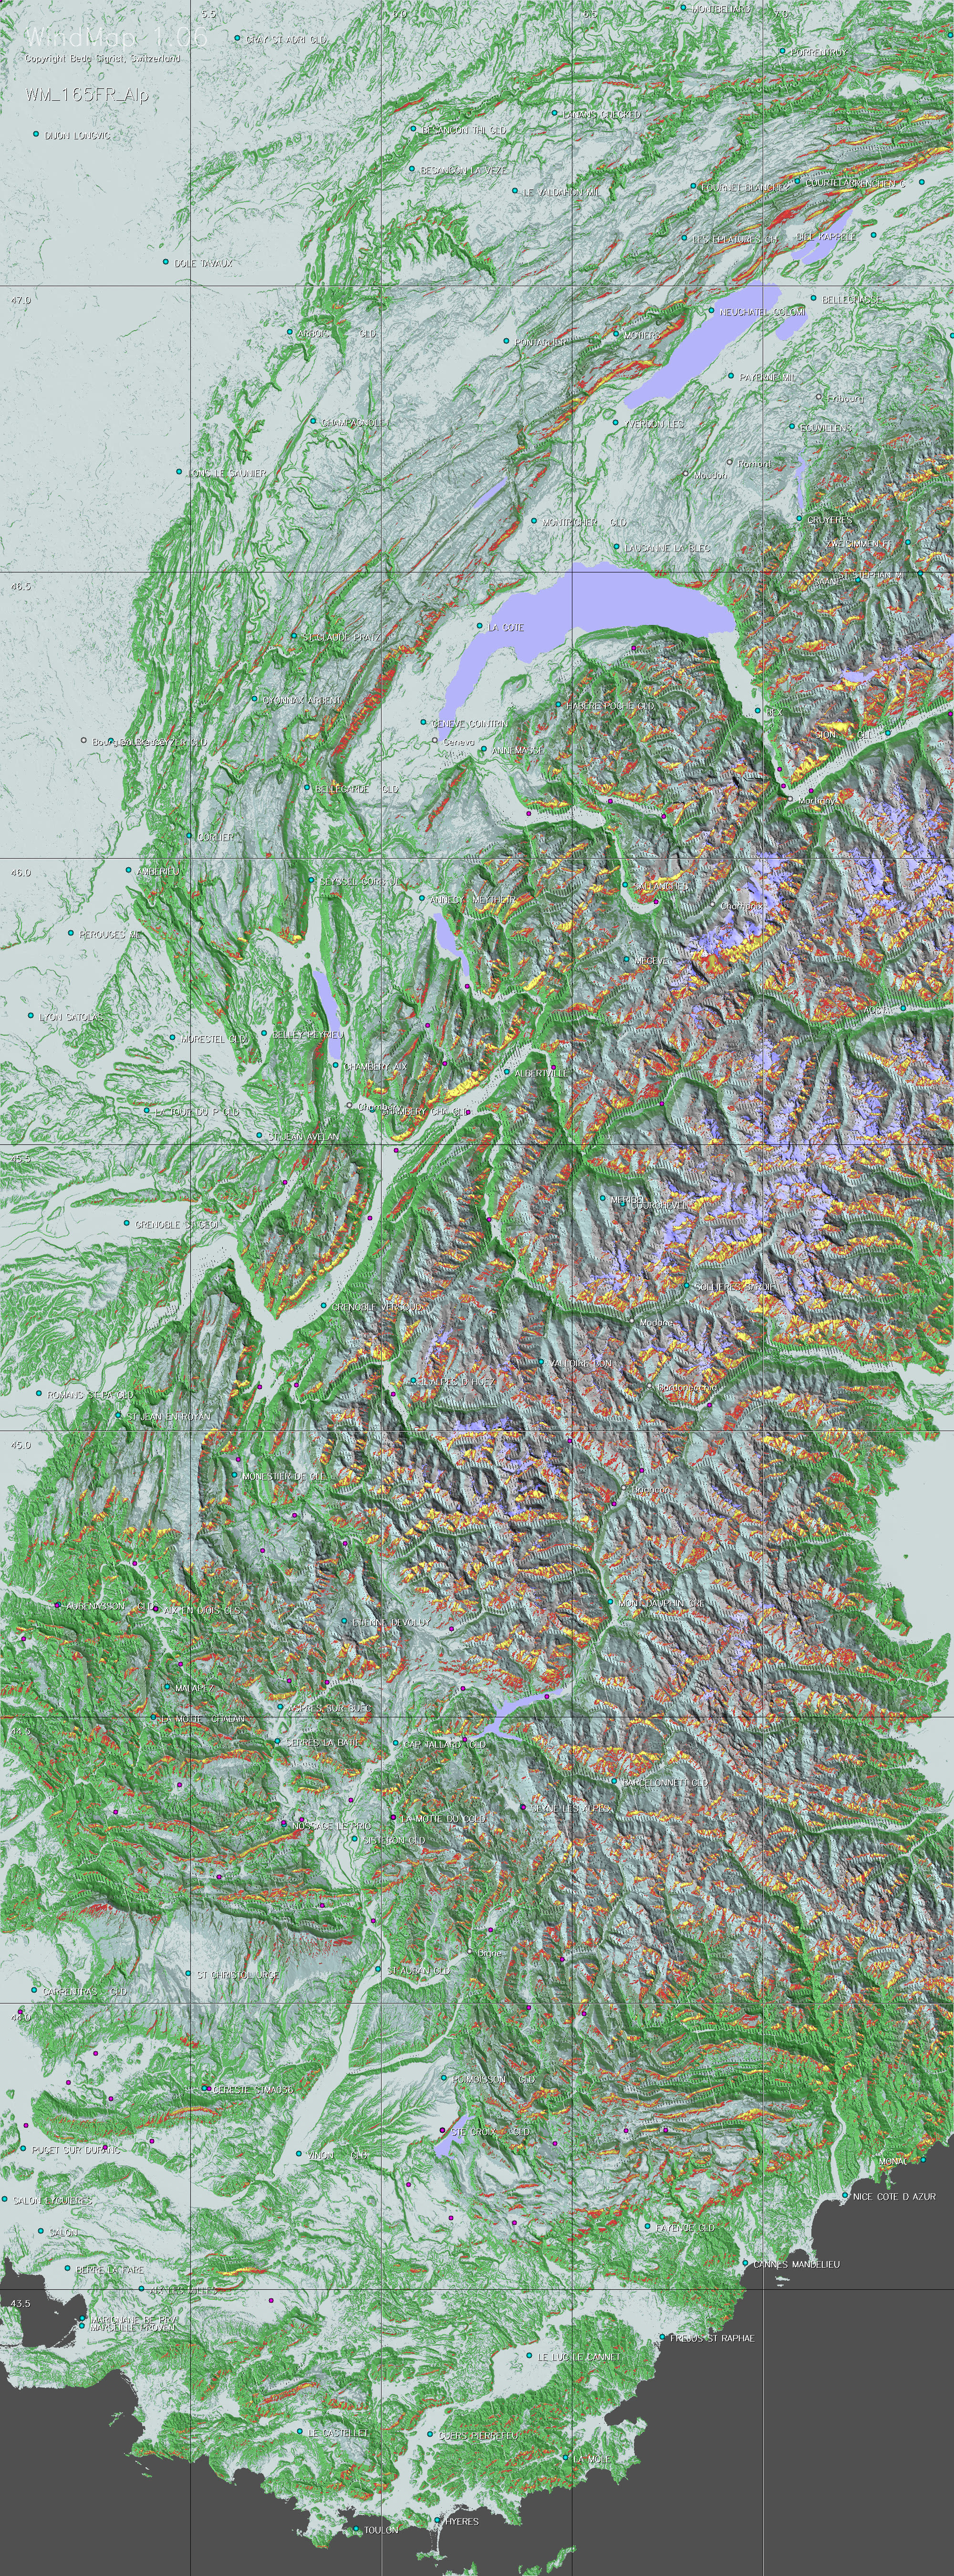
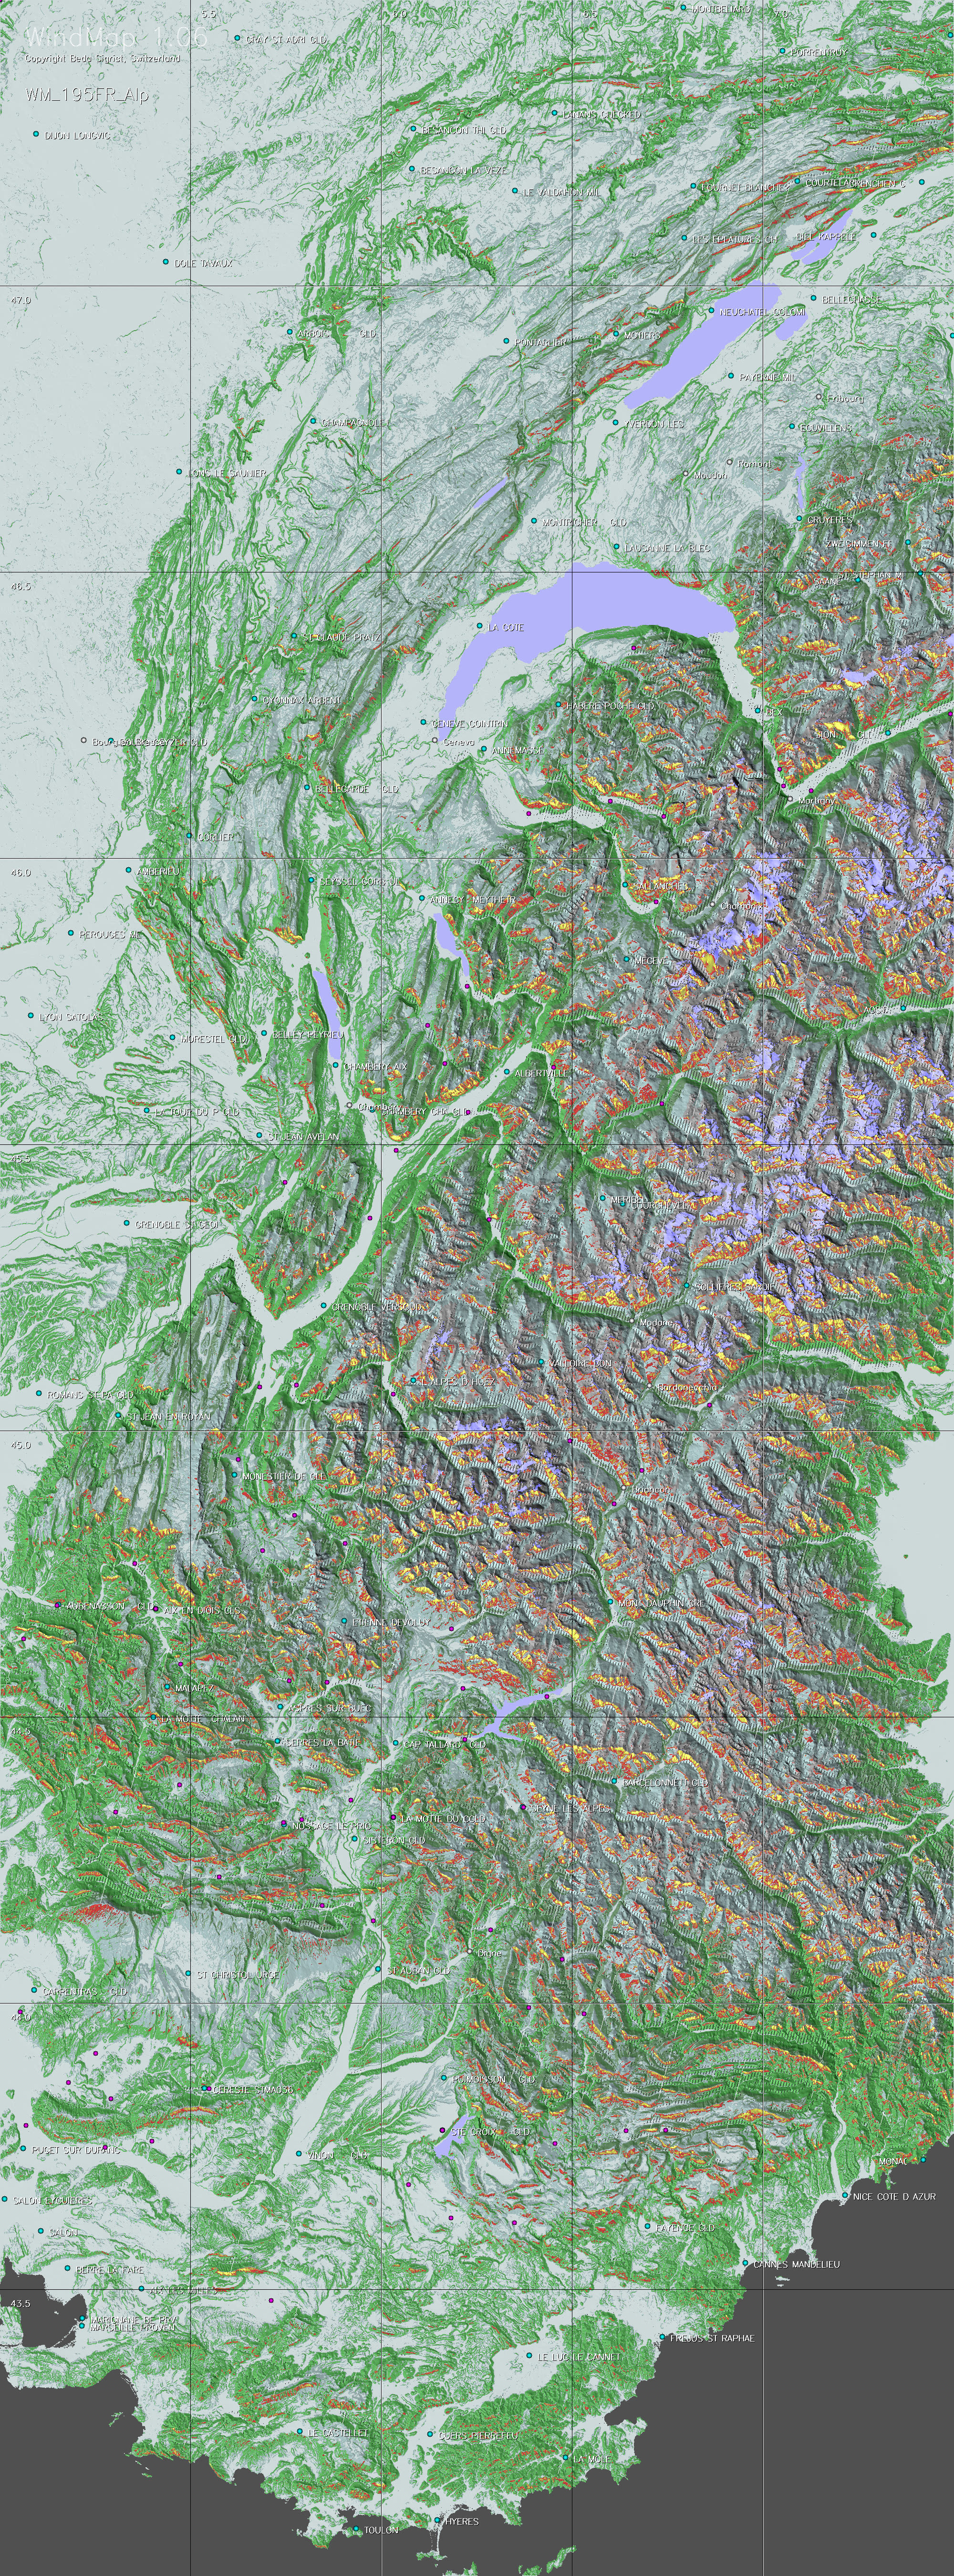
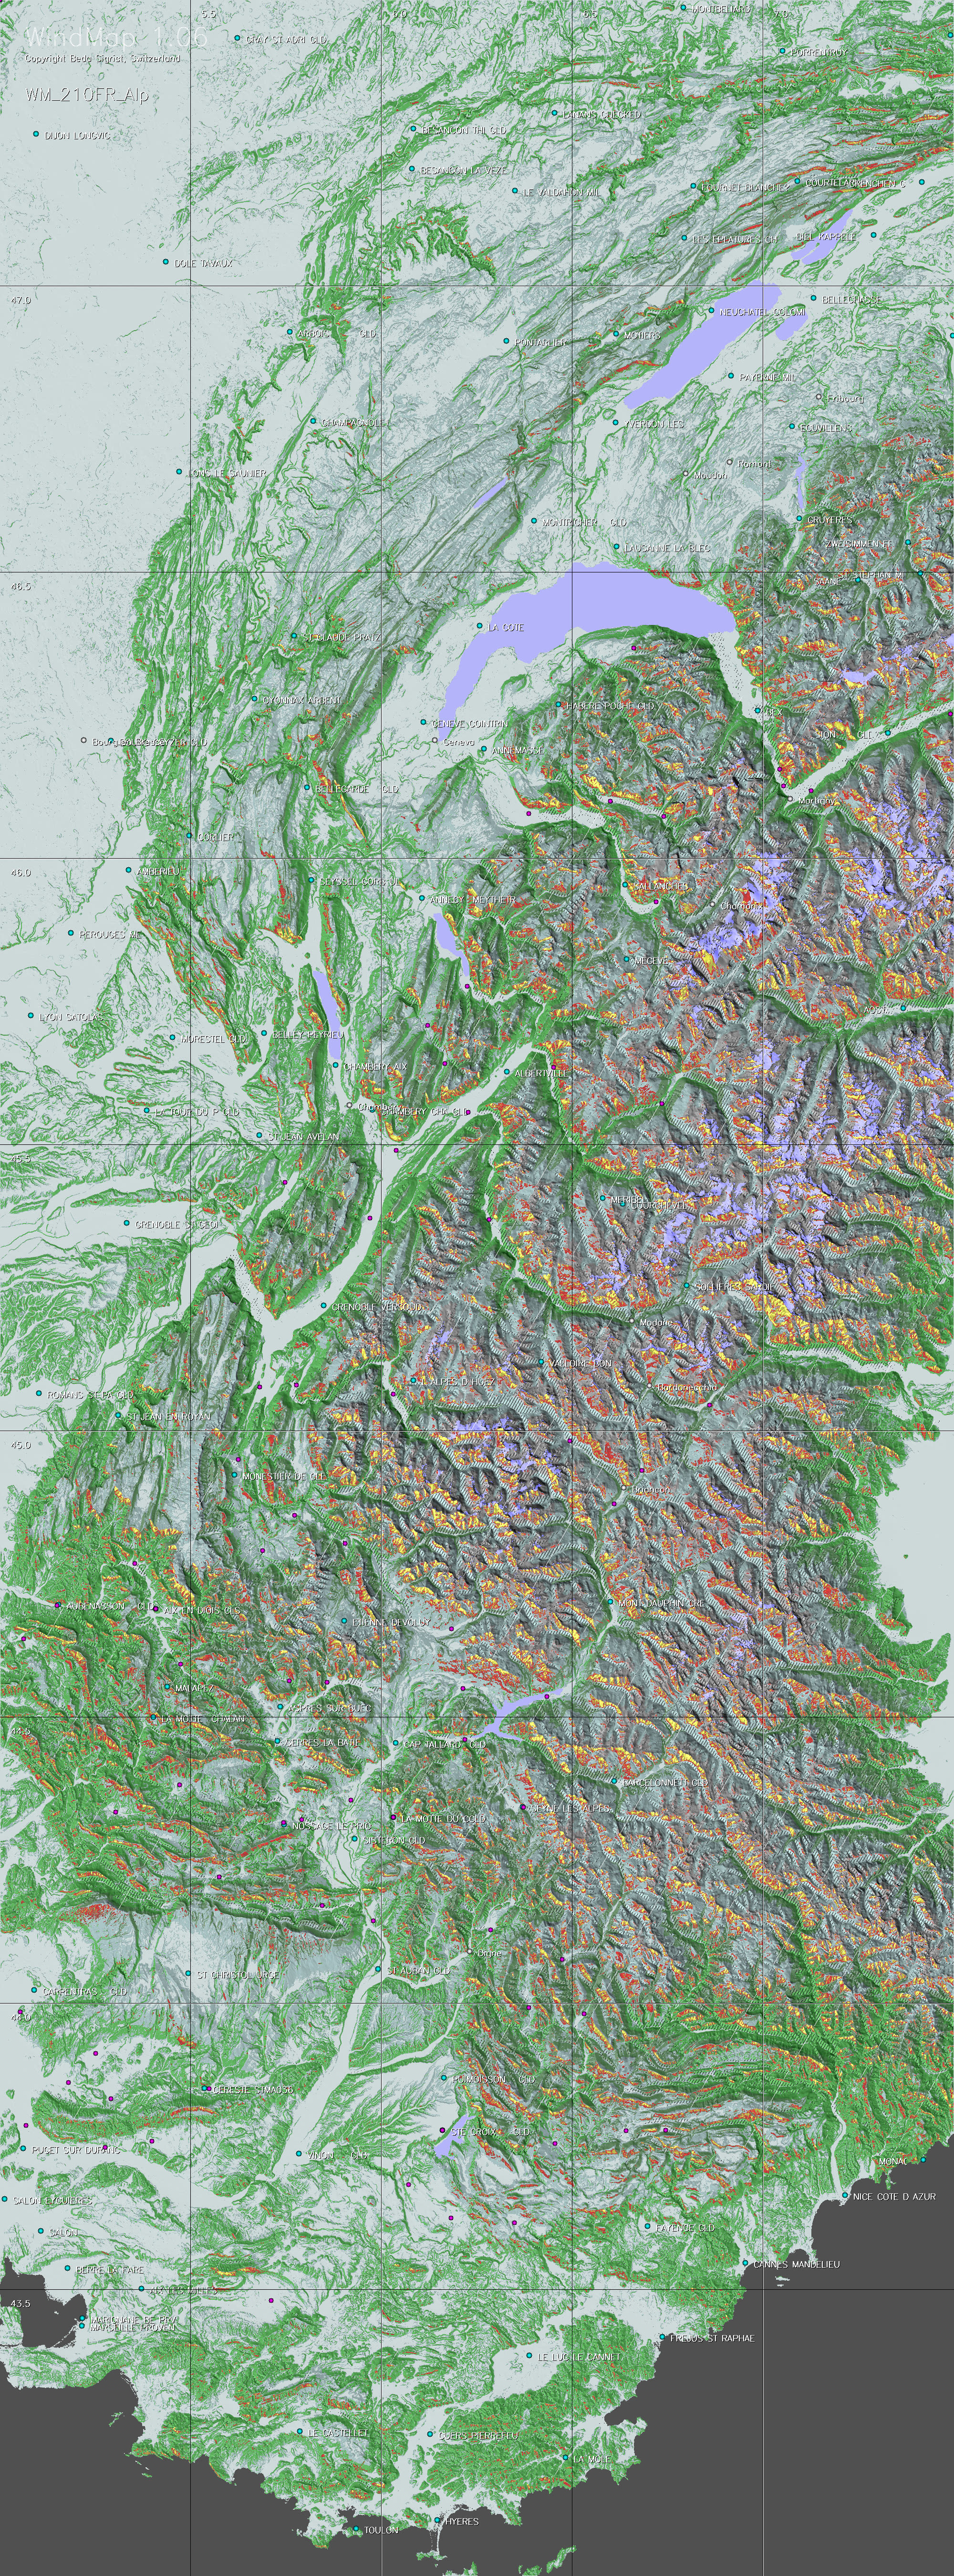
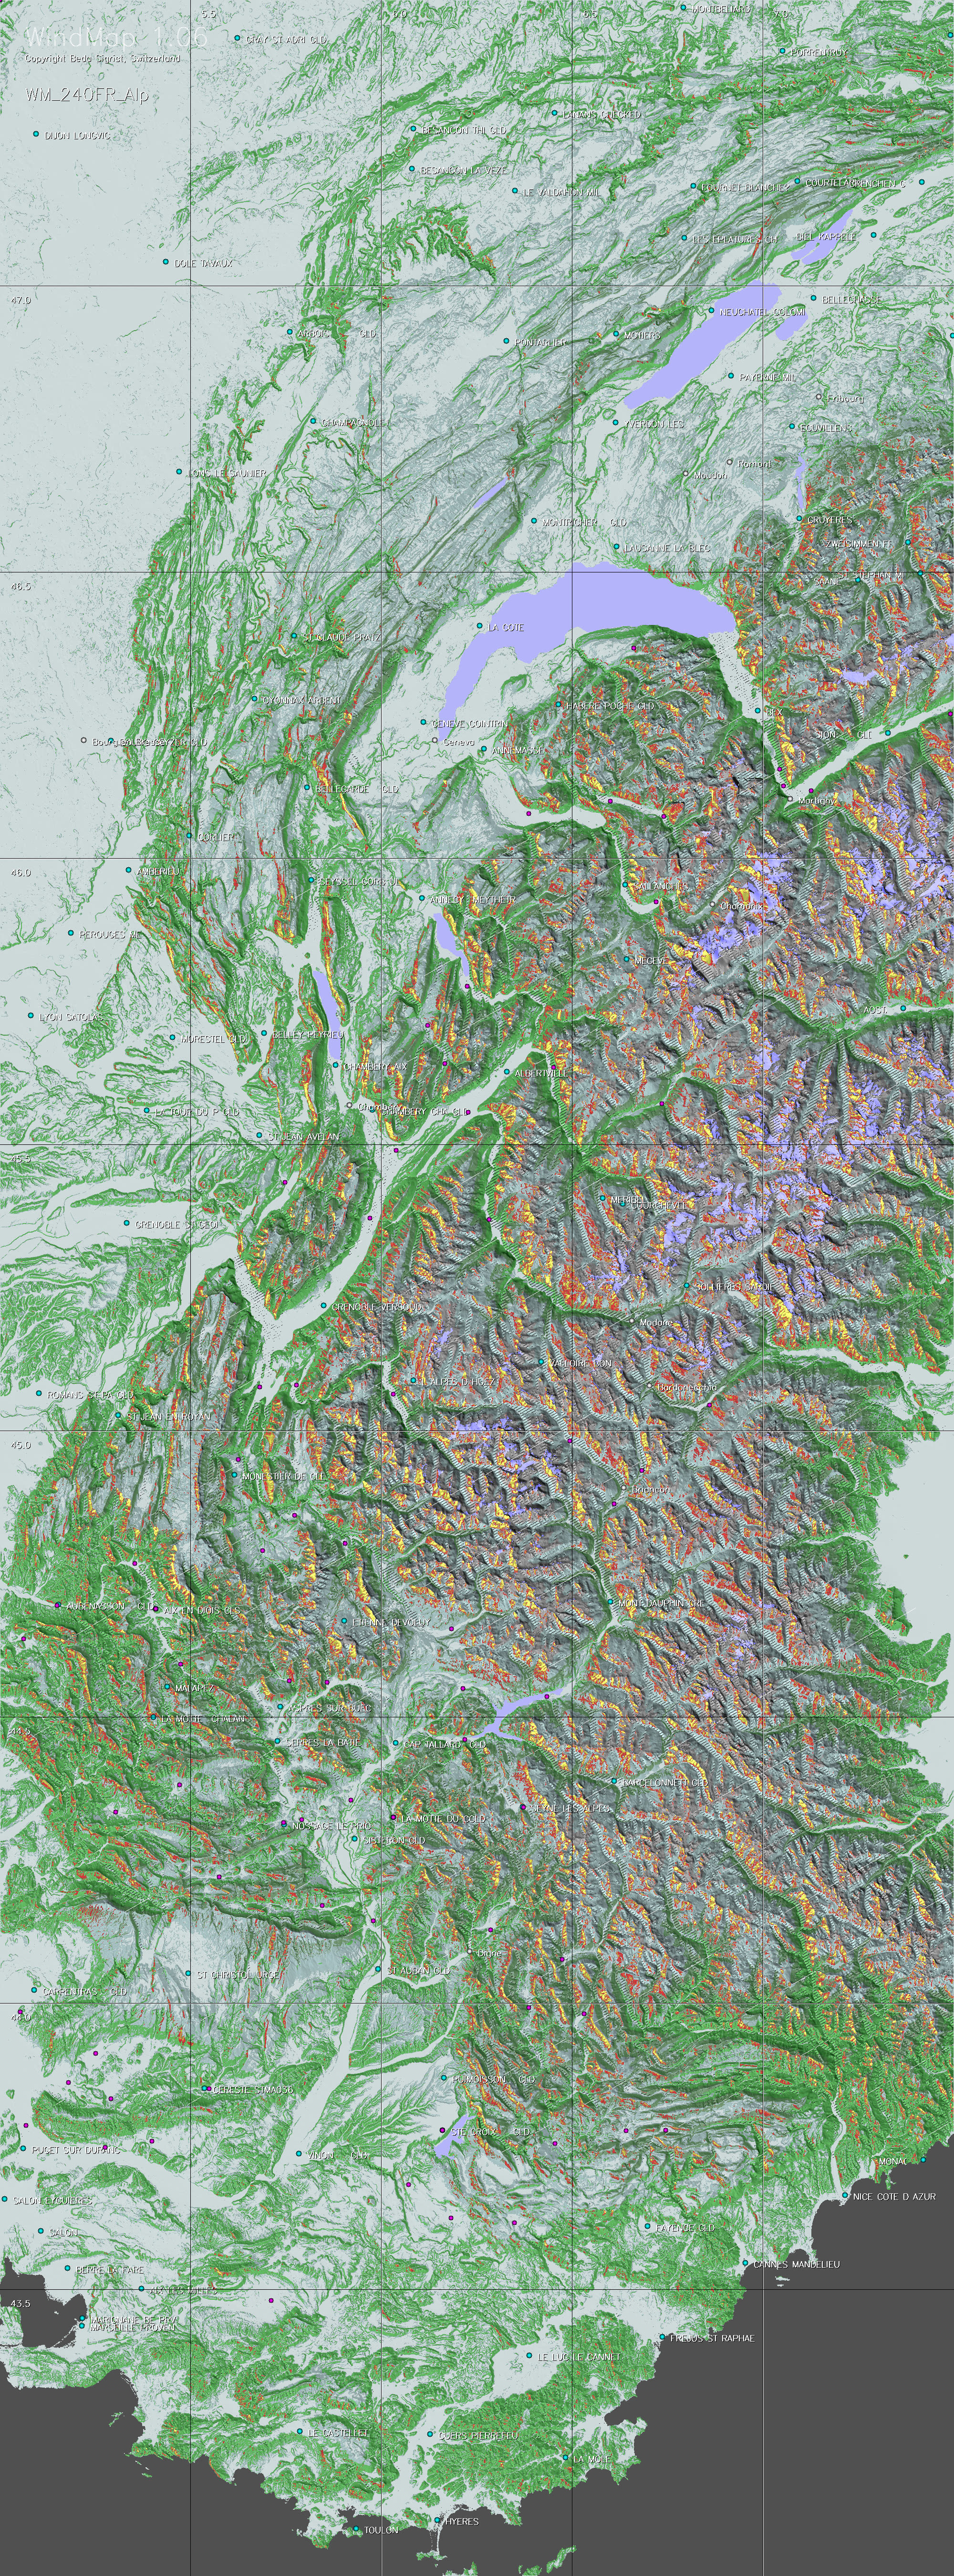
Position the cursor on the picture on the left and you can see a map extract of WindMap, a tool for glider pilots, to visualize the local potential of ridge winds for a given wind direction, assuming no other meteorological interferences or mountain waves. The WindMap picture also contains an actual flight track showing the flight phases with climbing (blue) and sinking (white) phases.
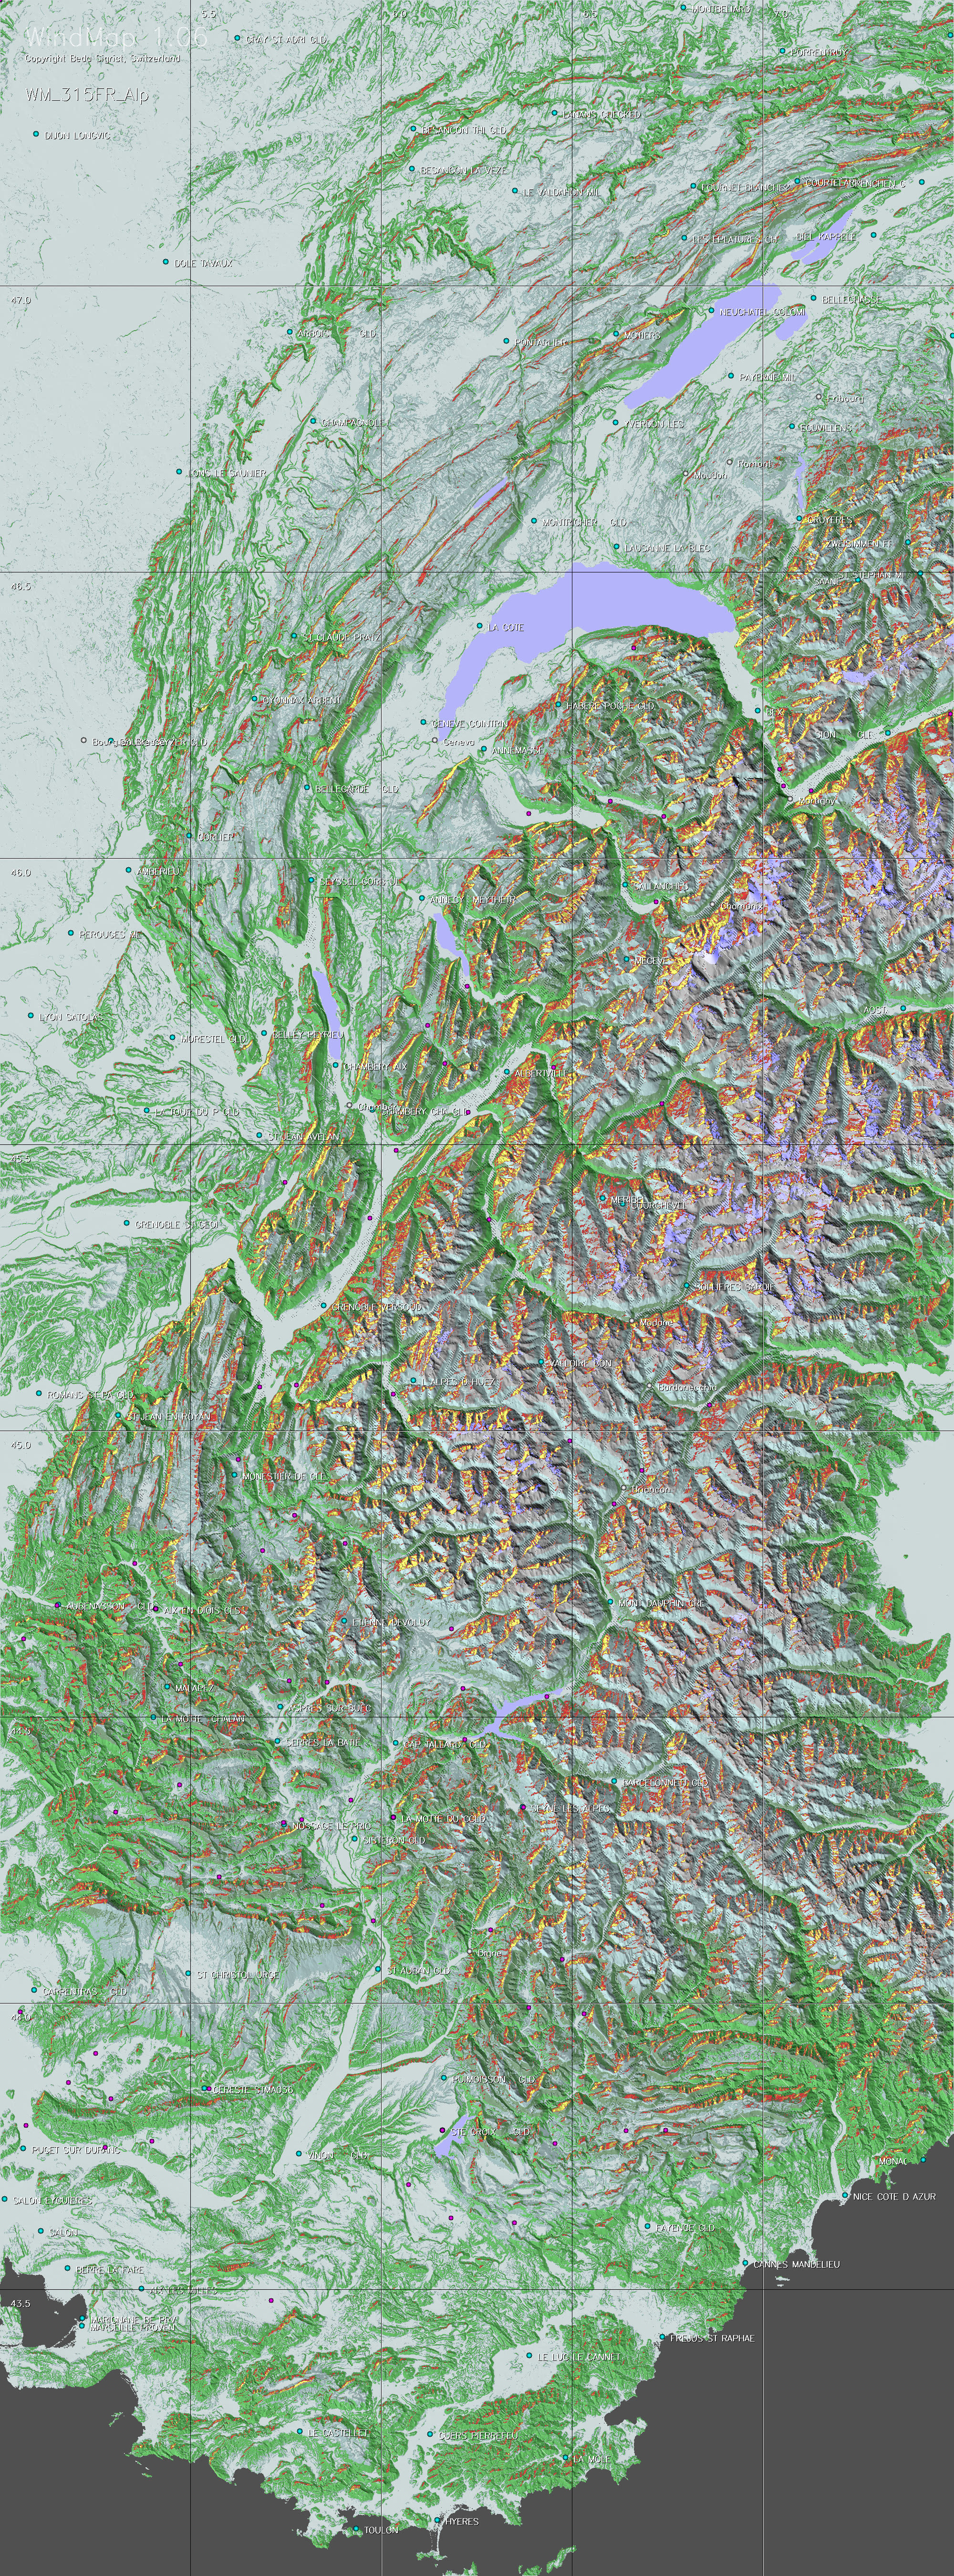
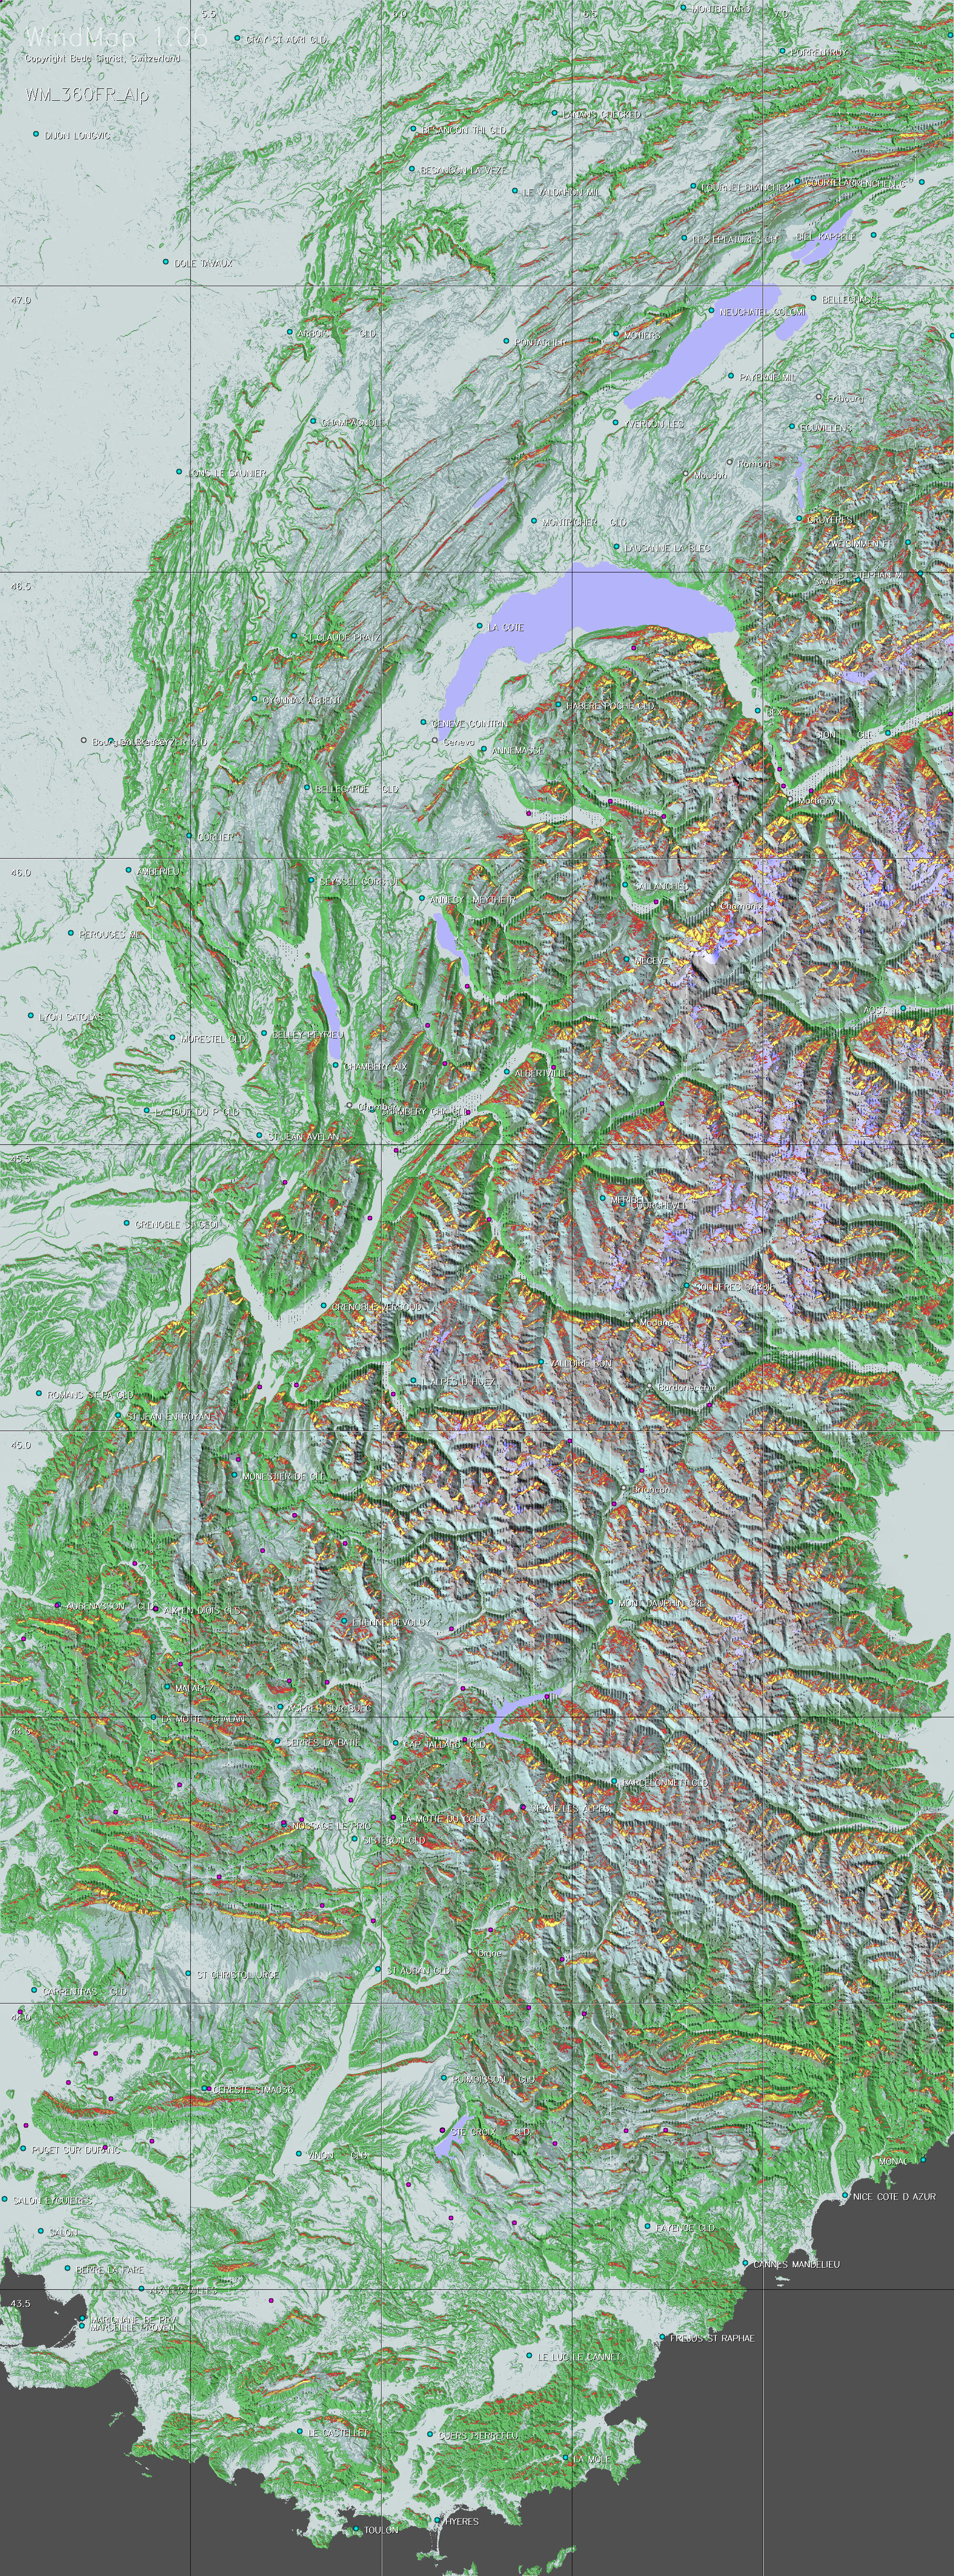
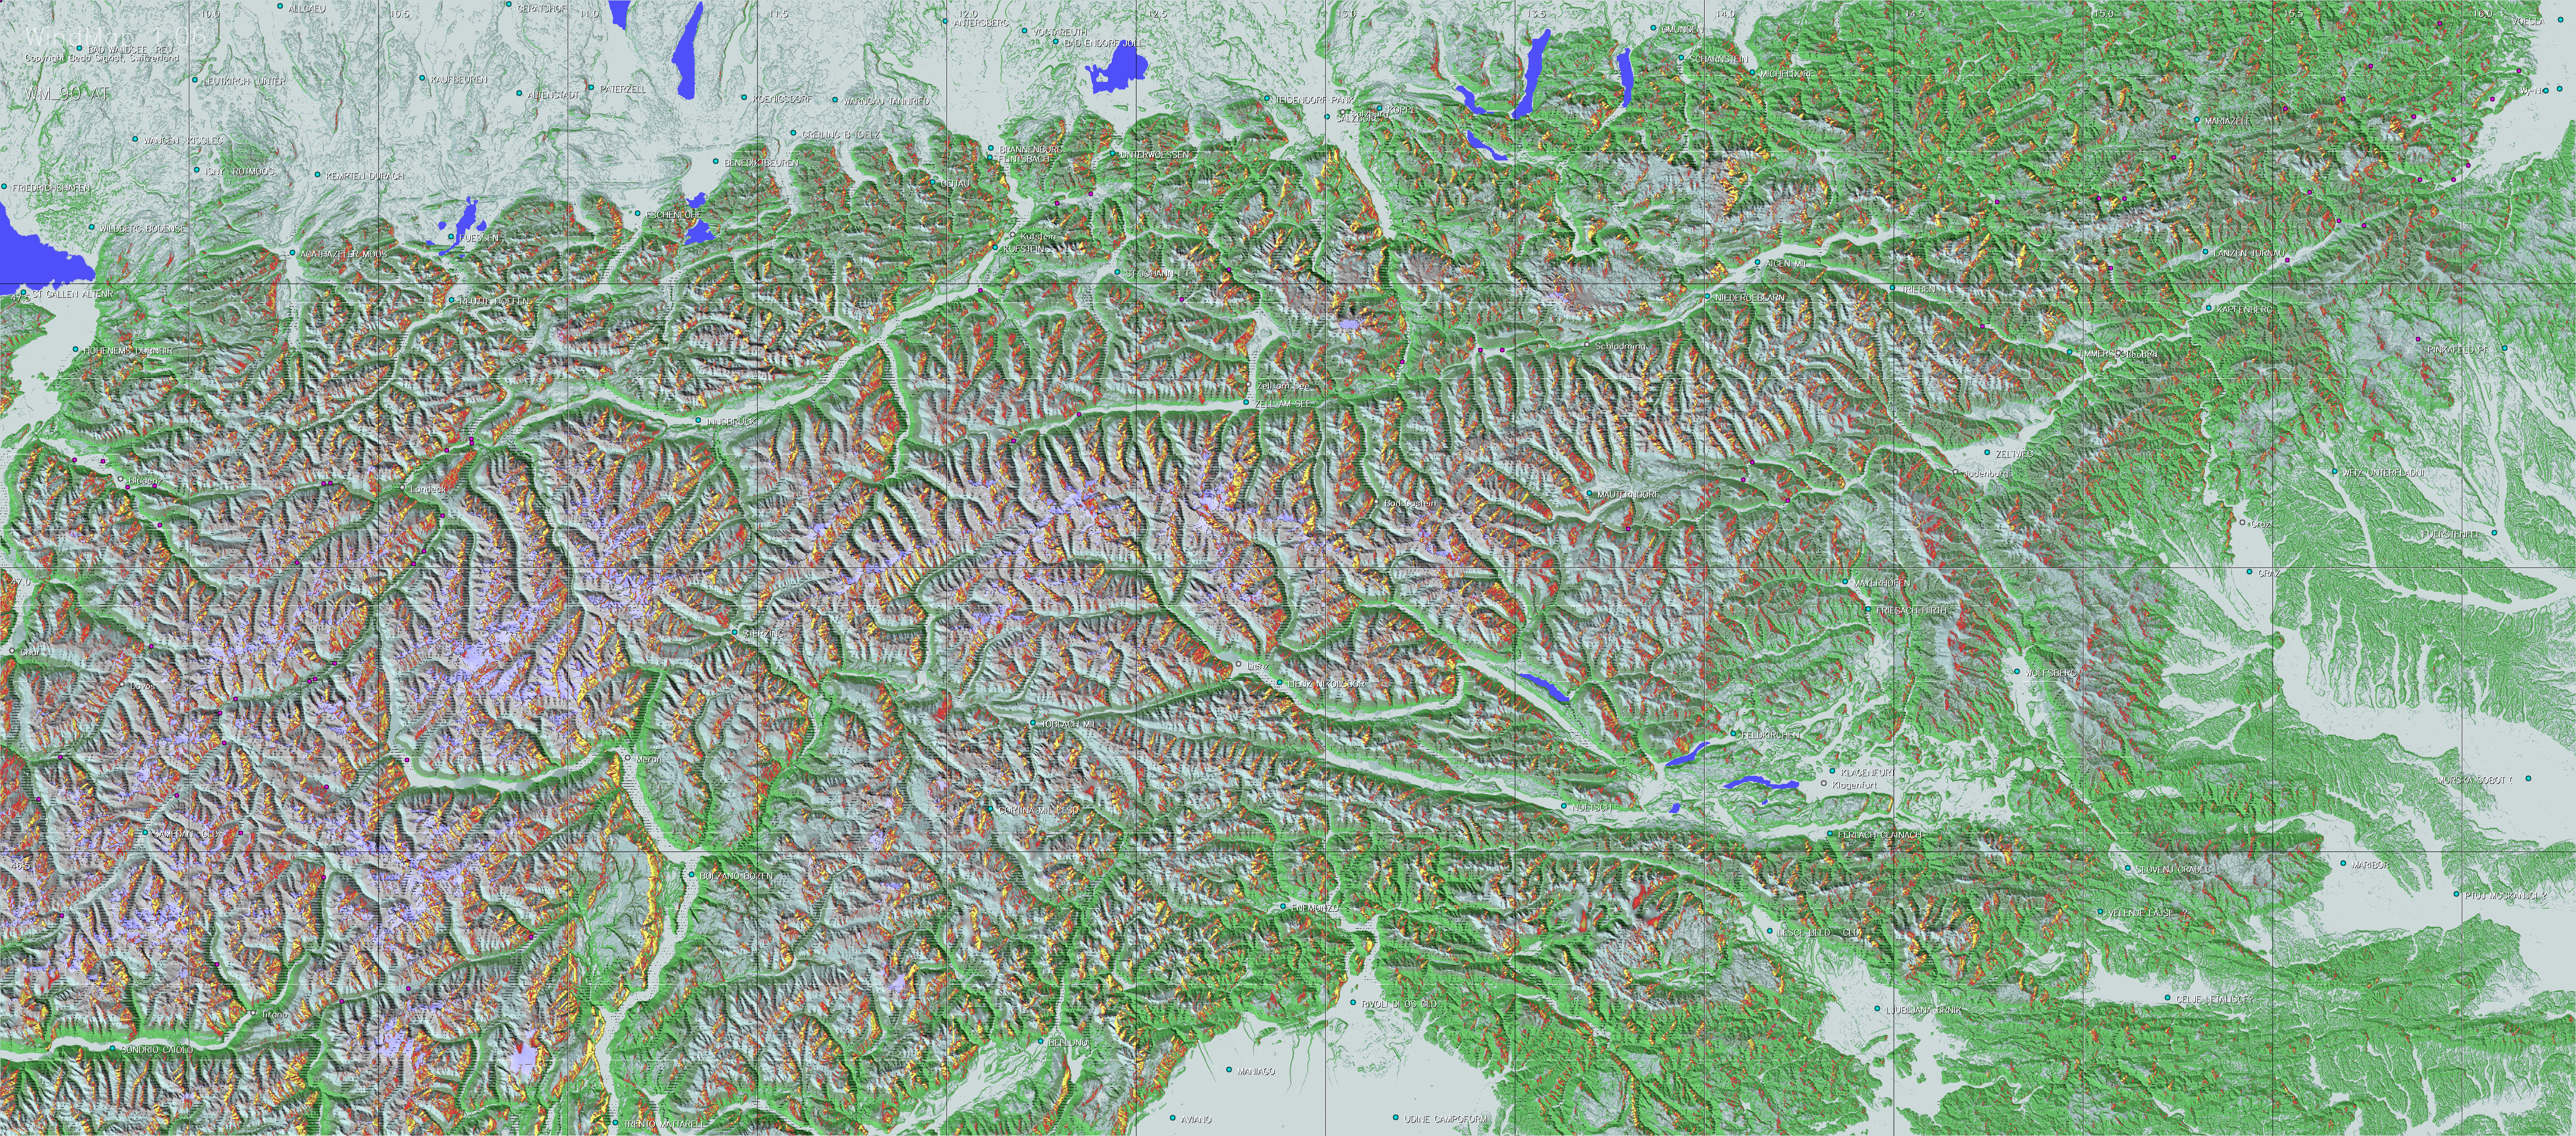
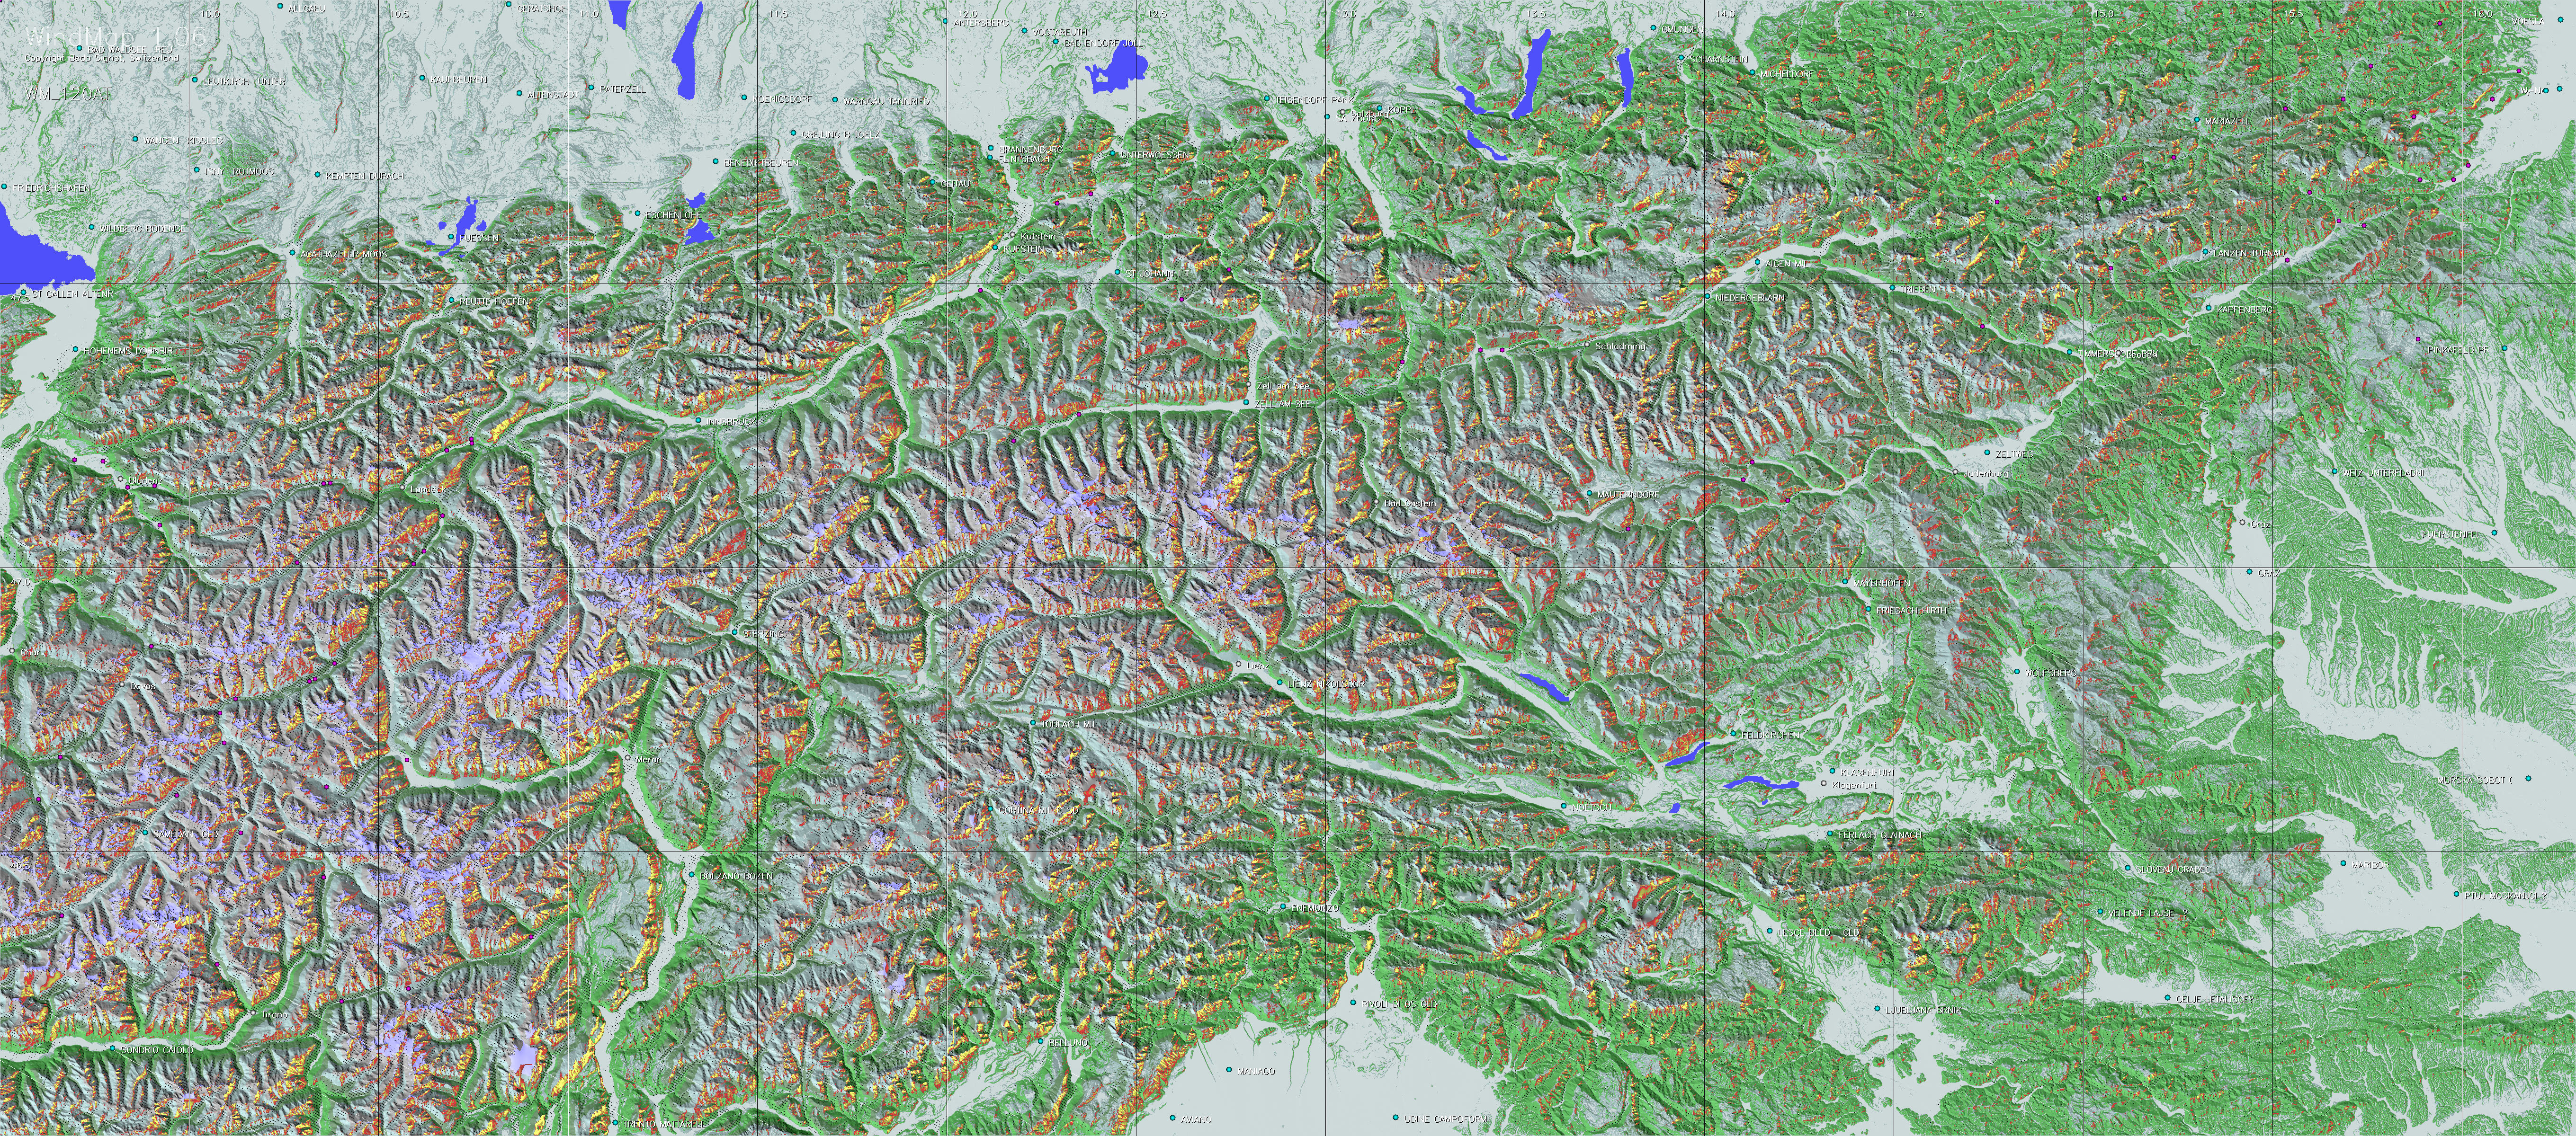
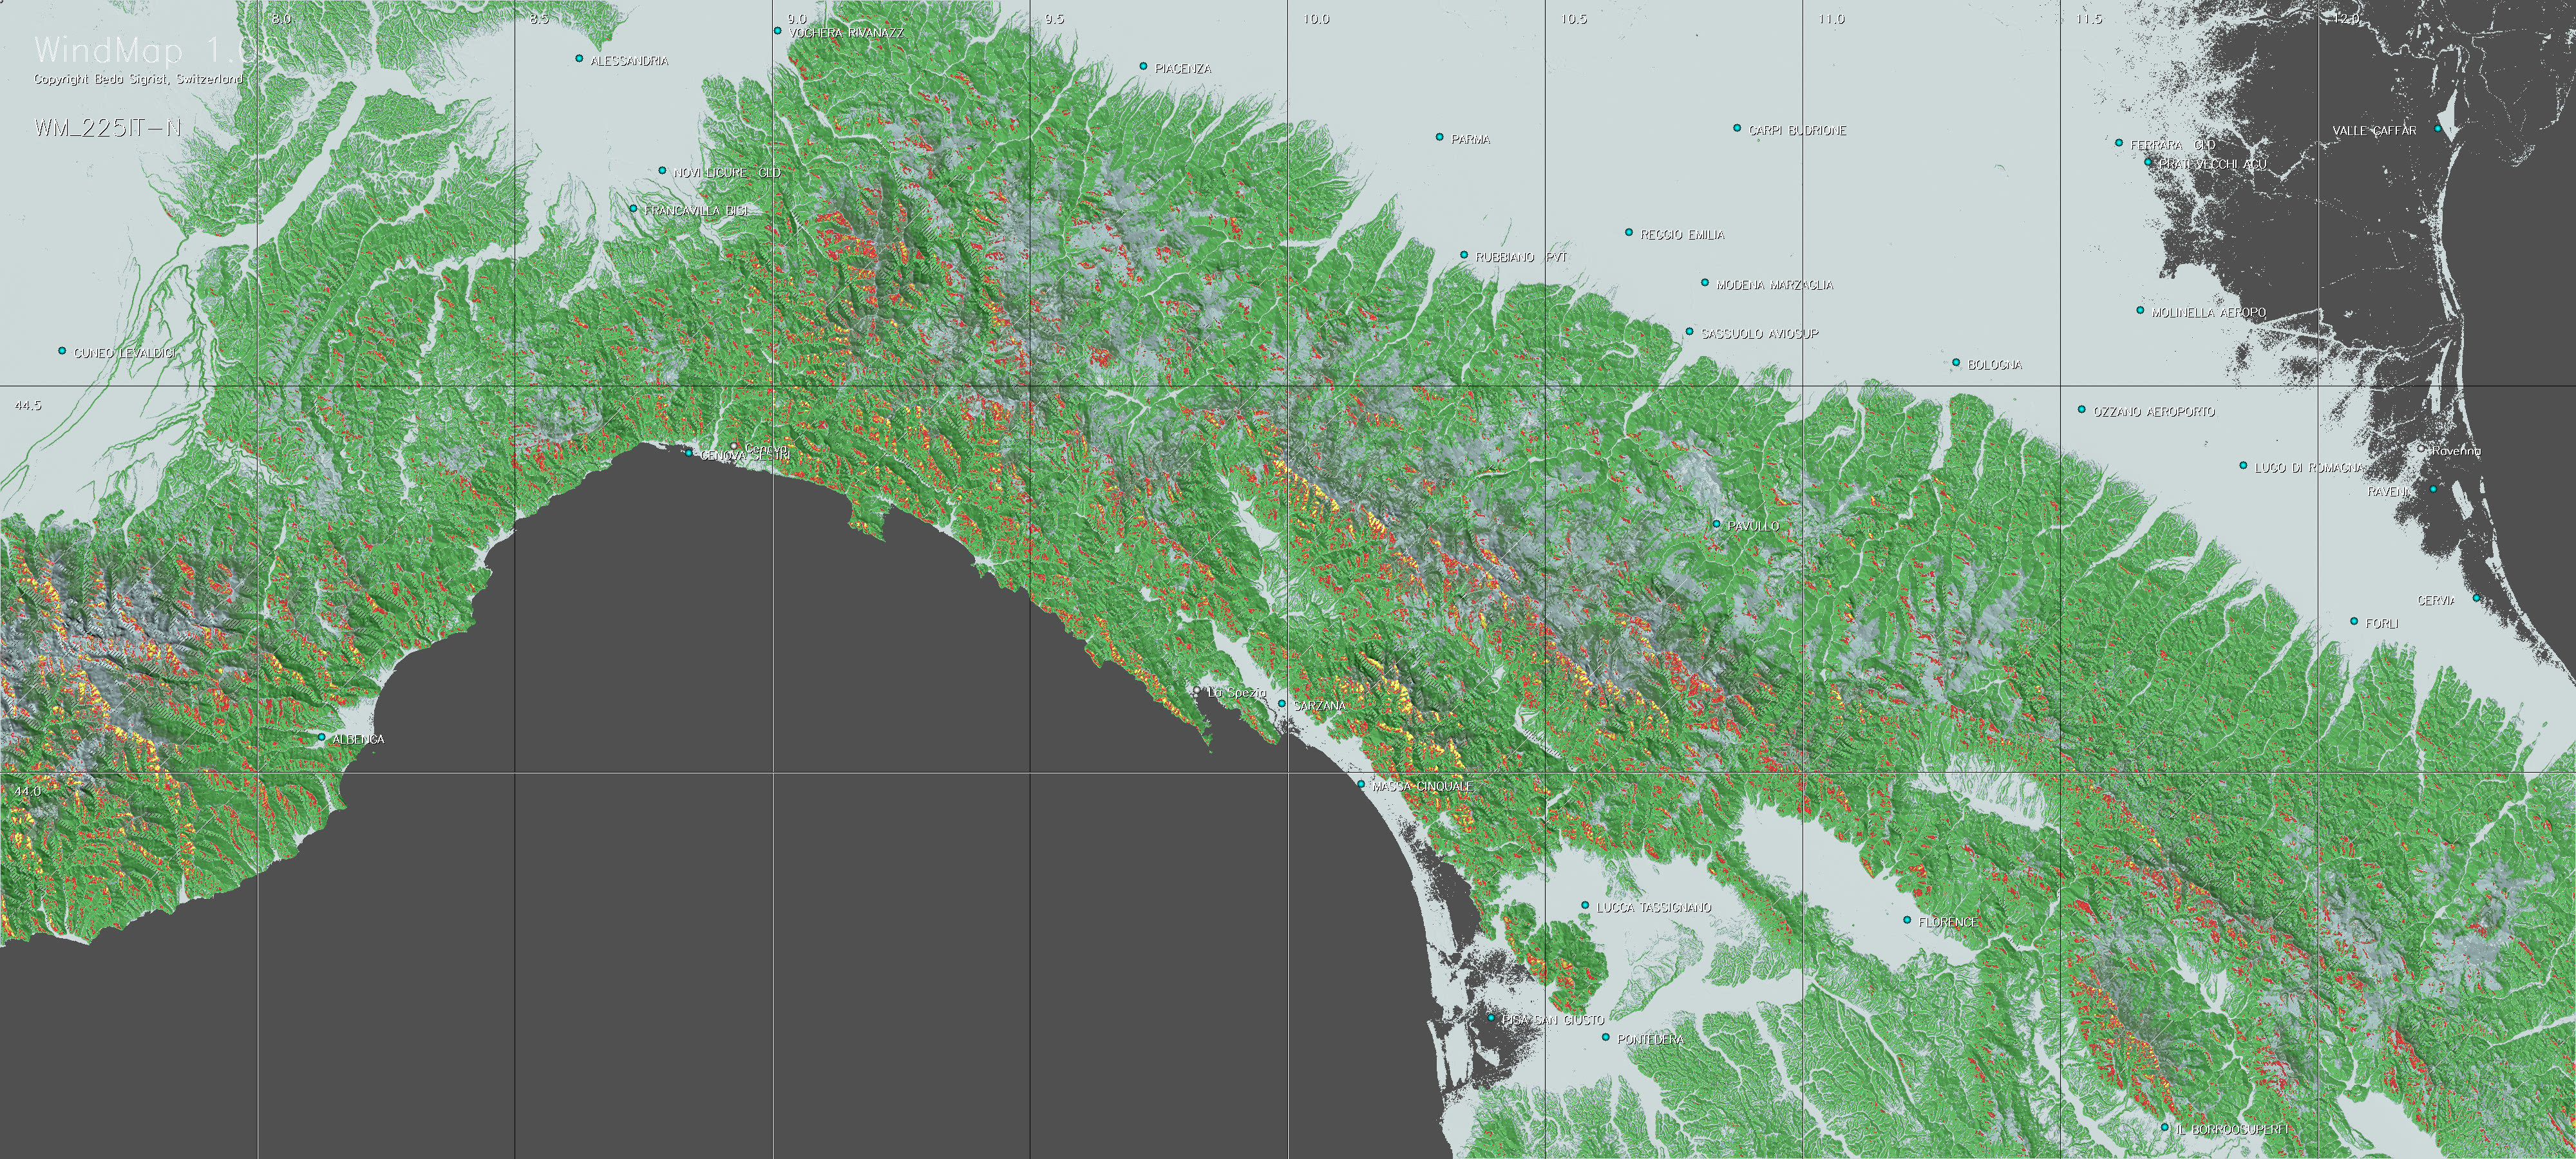
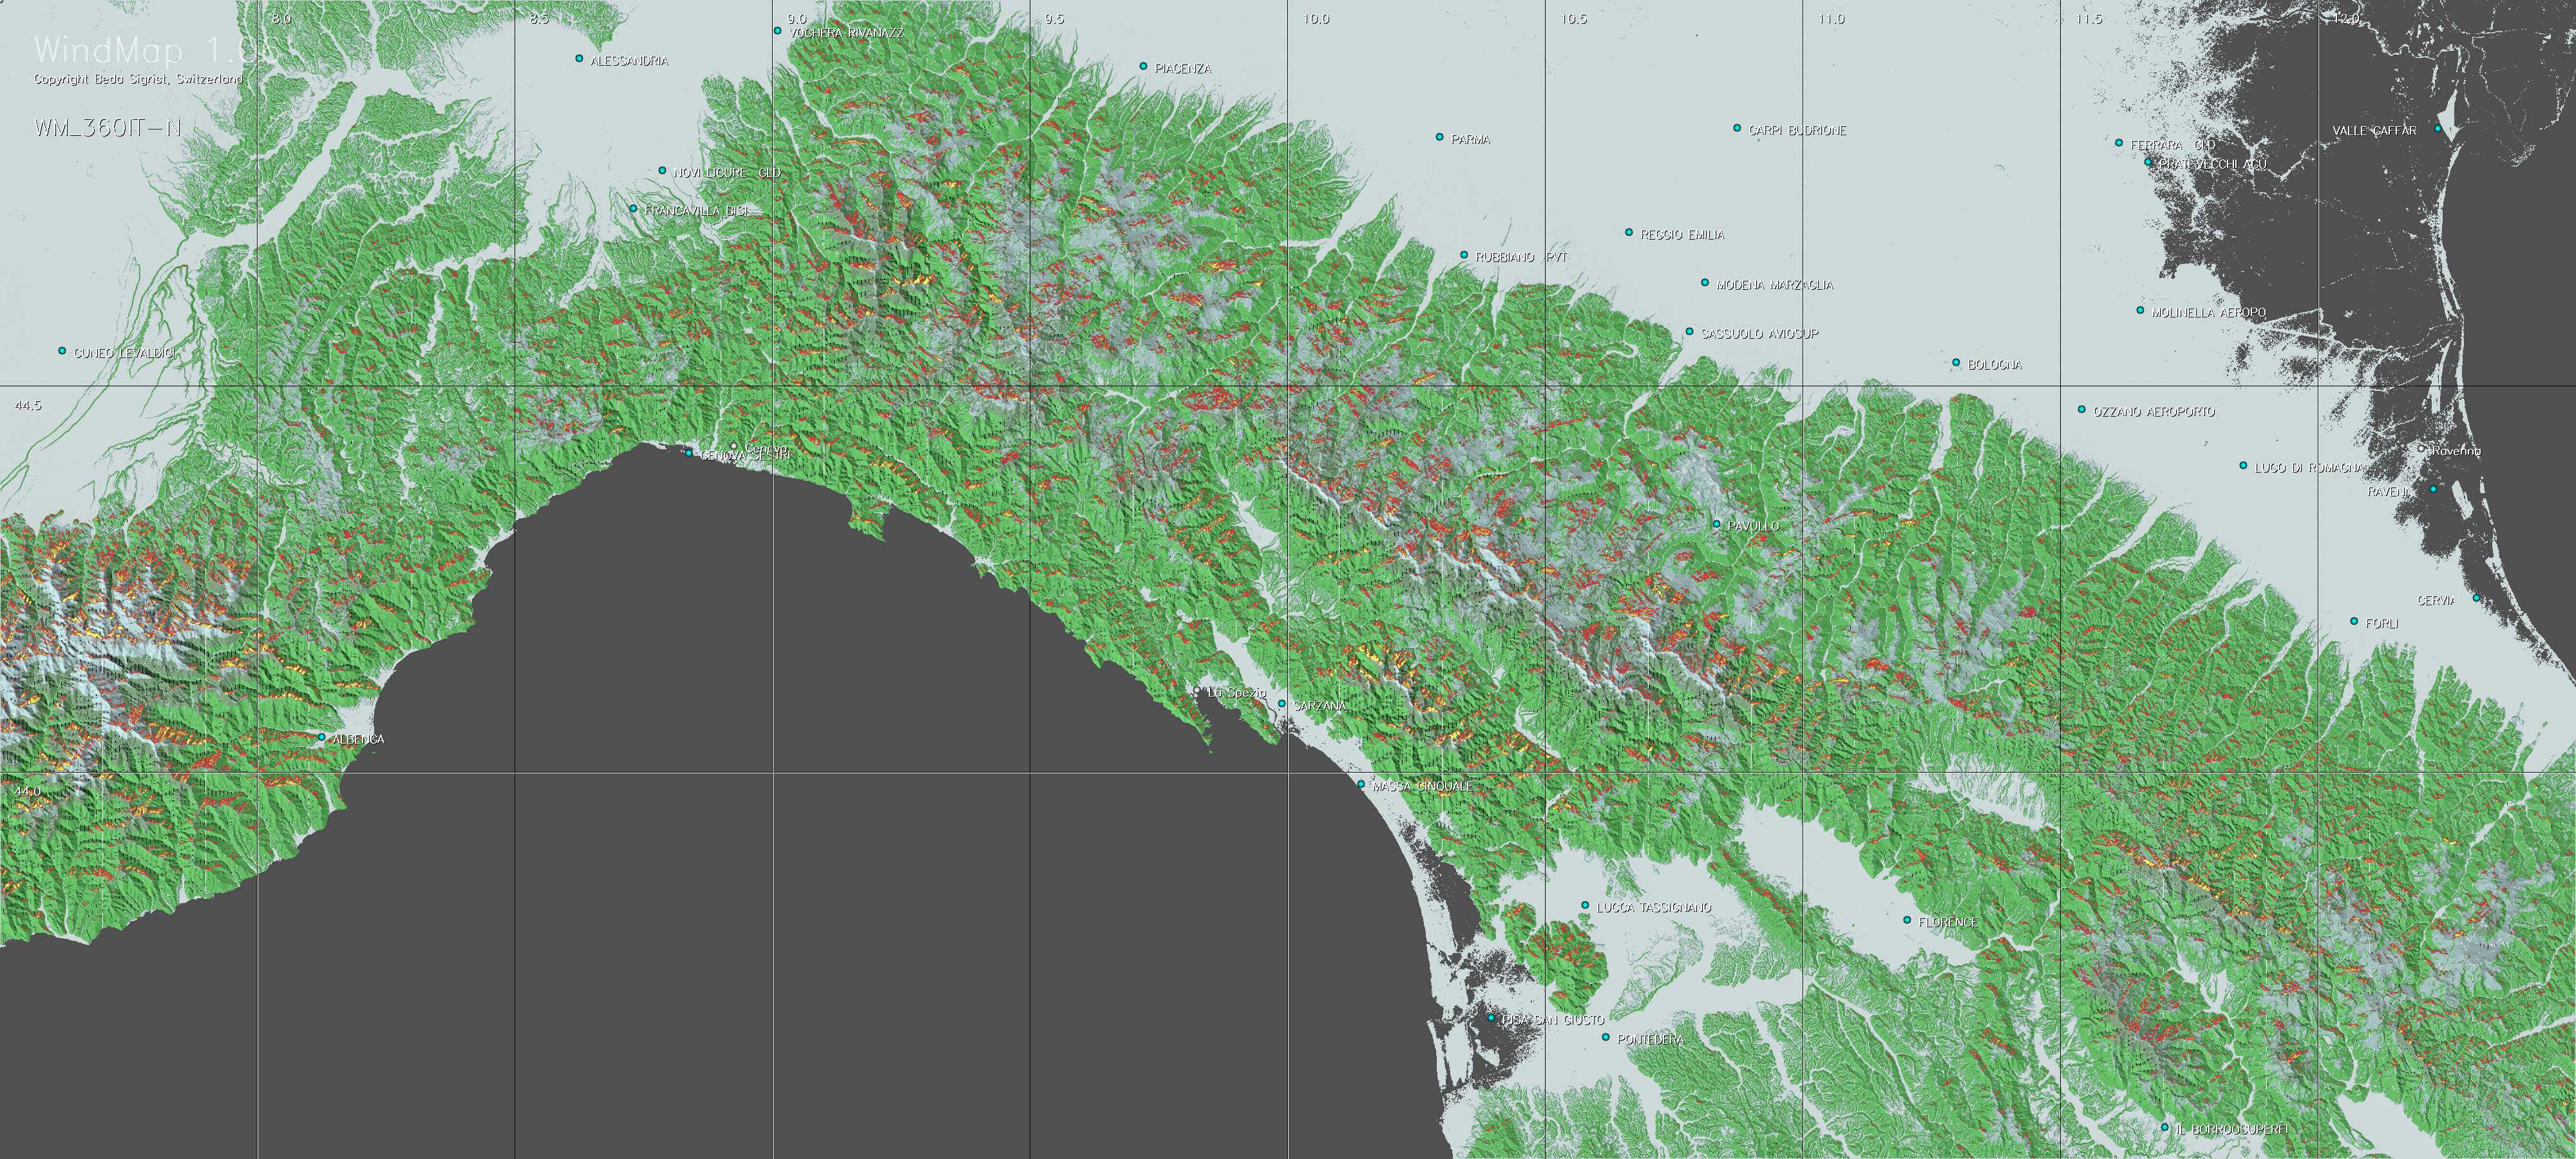
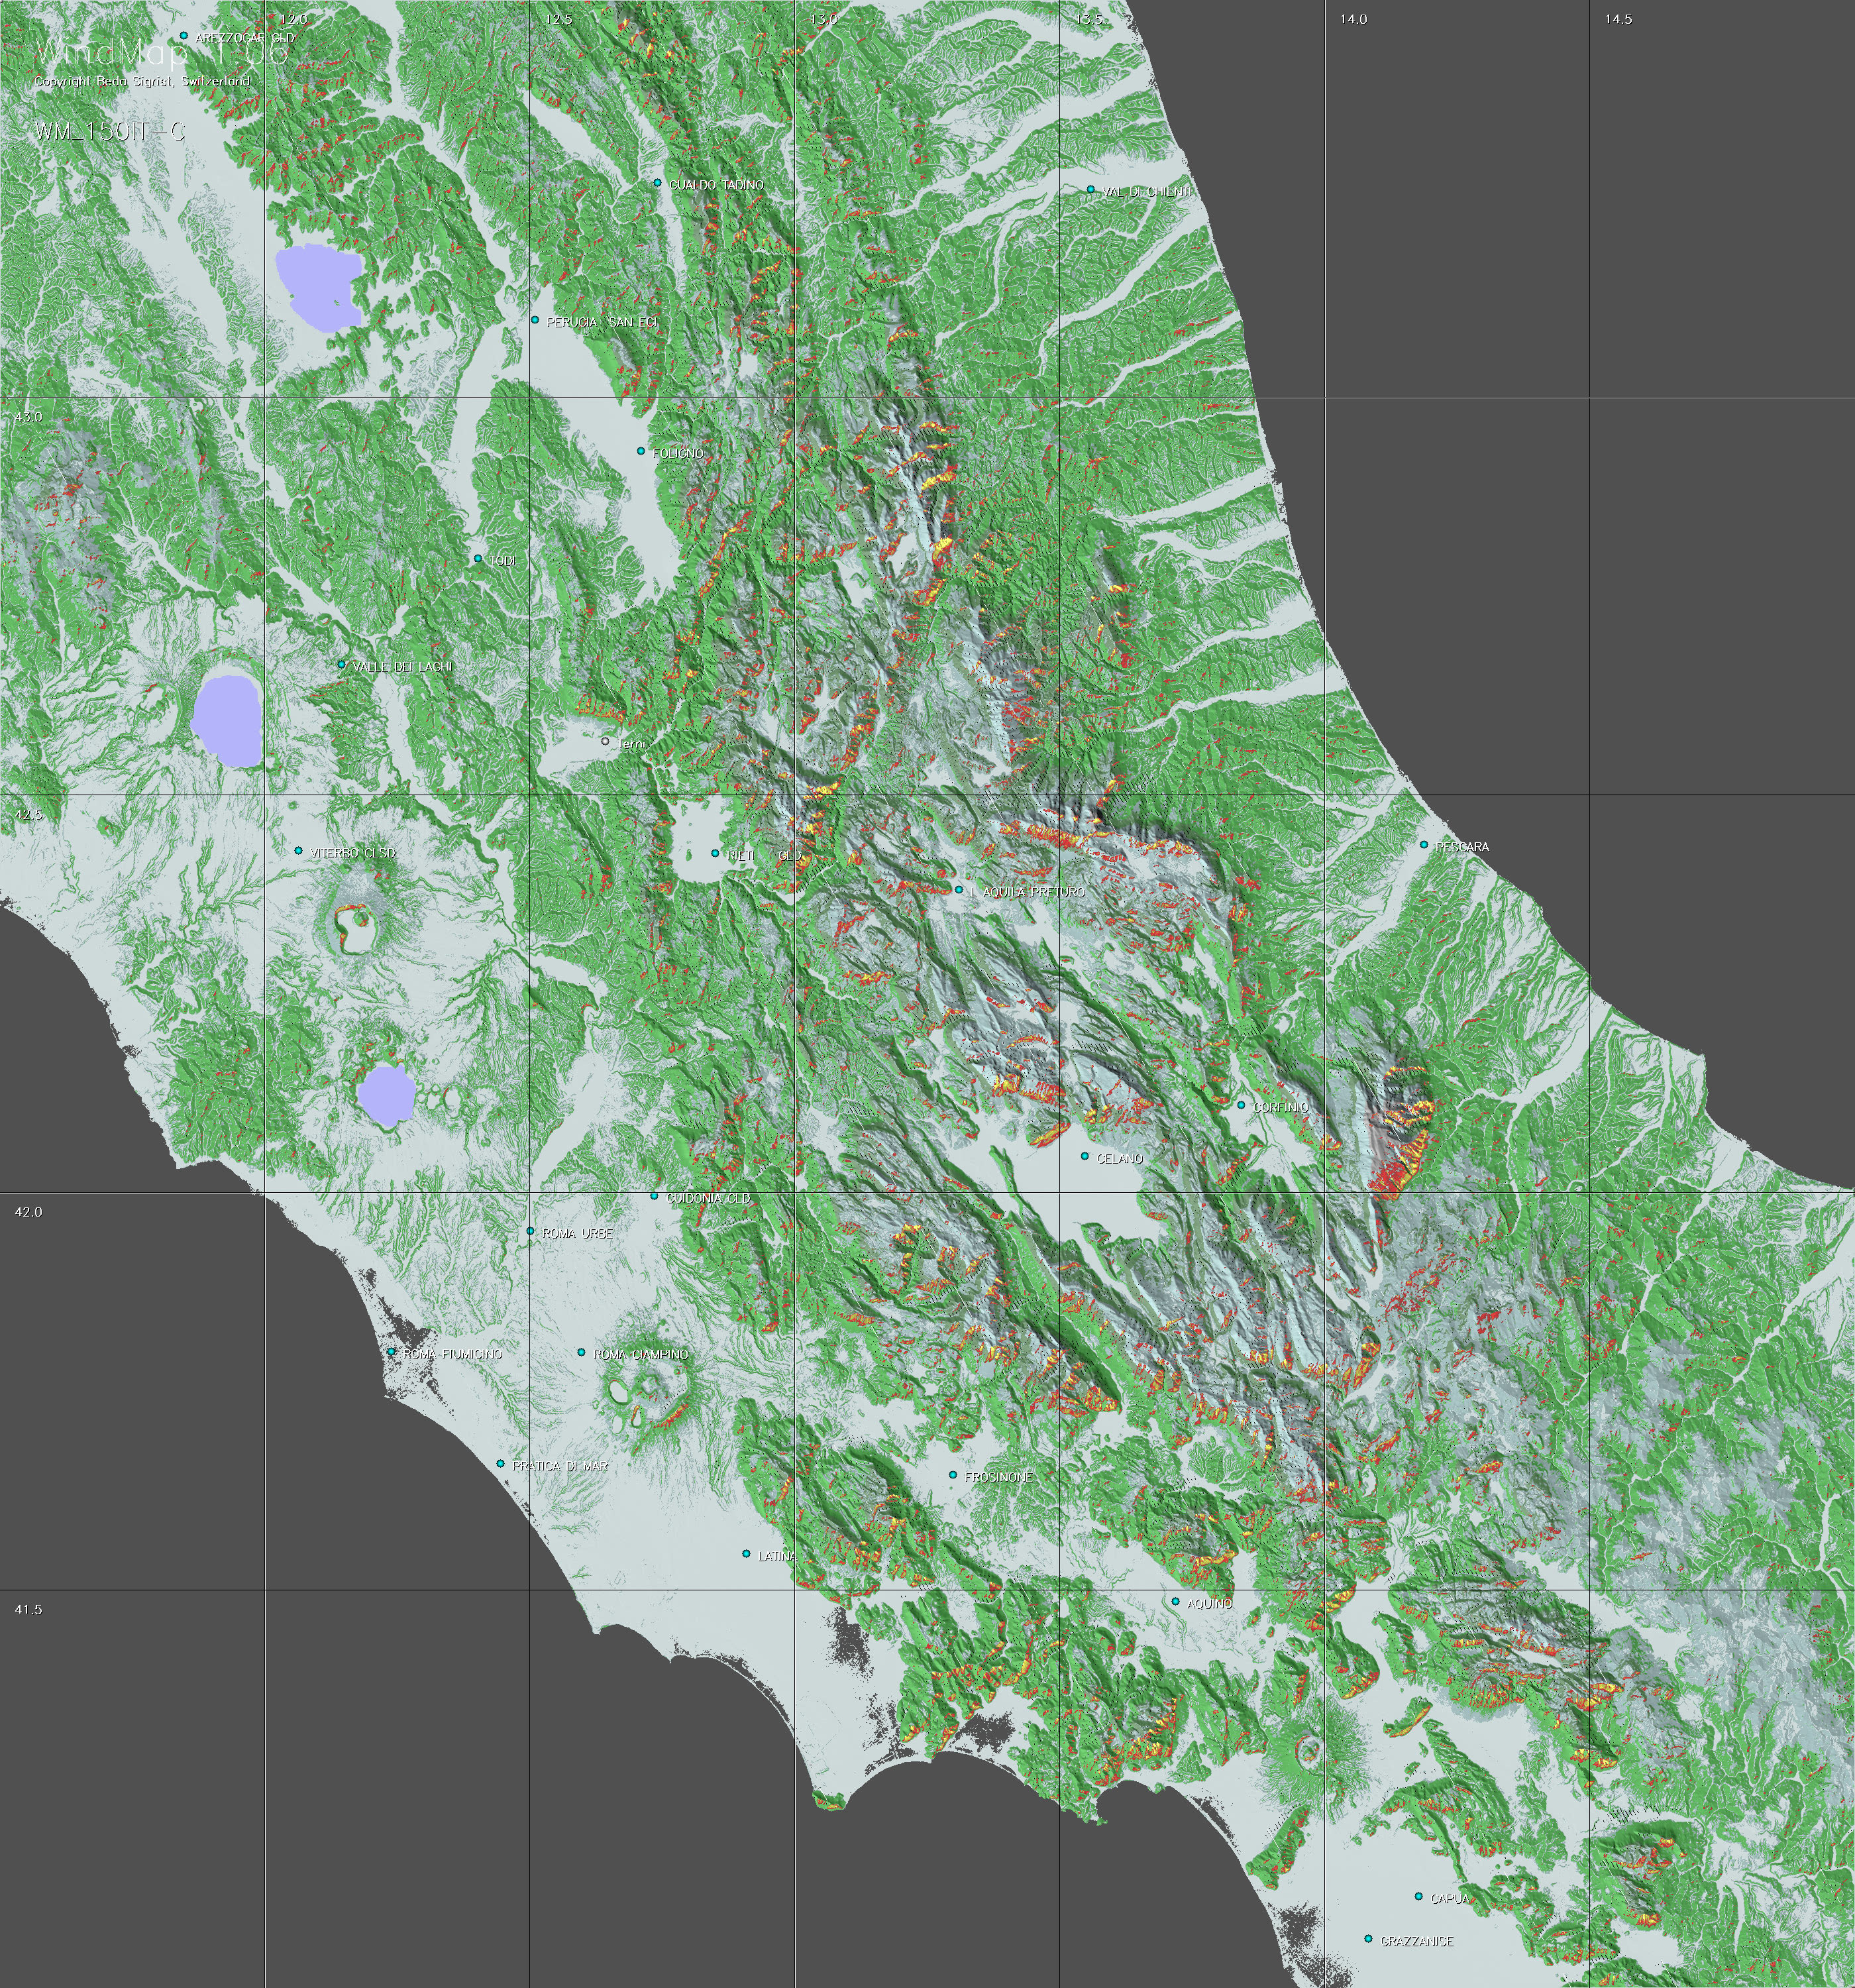
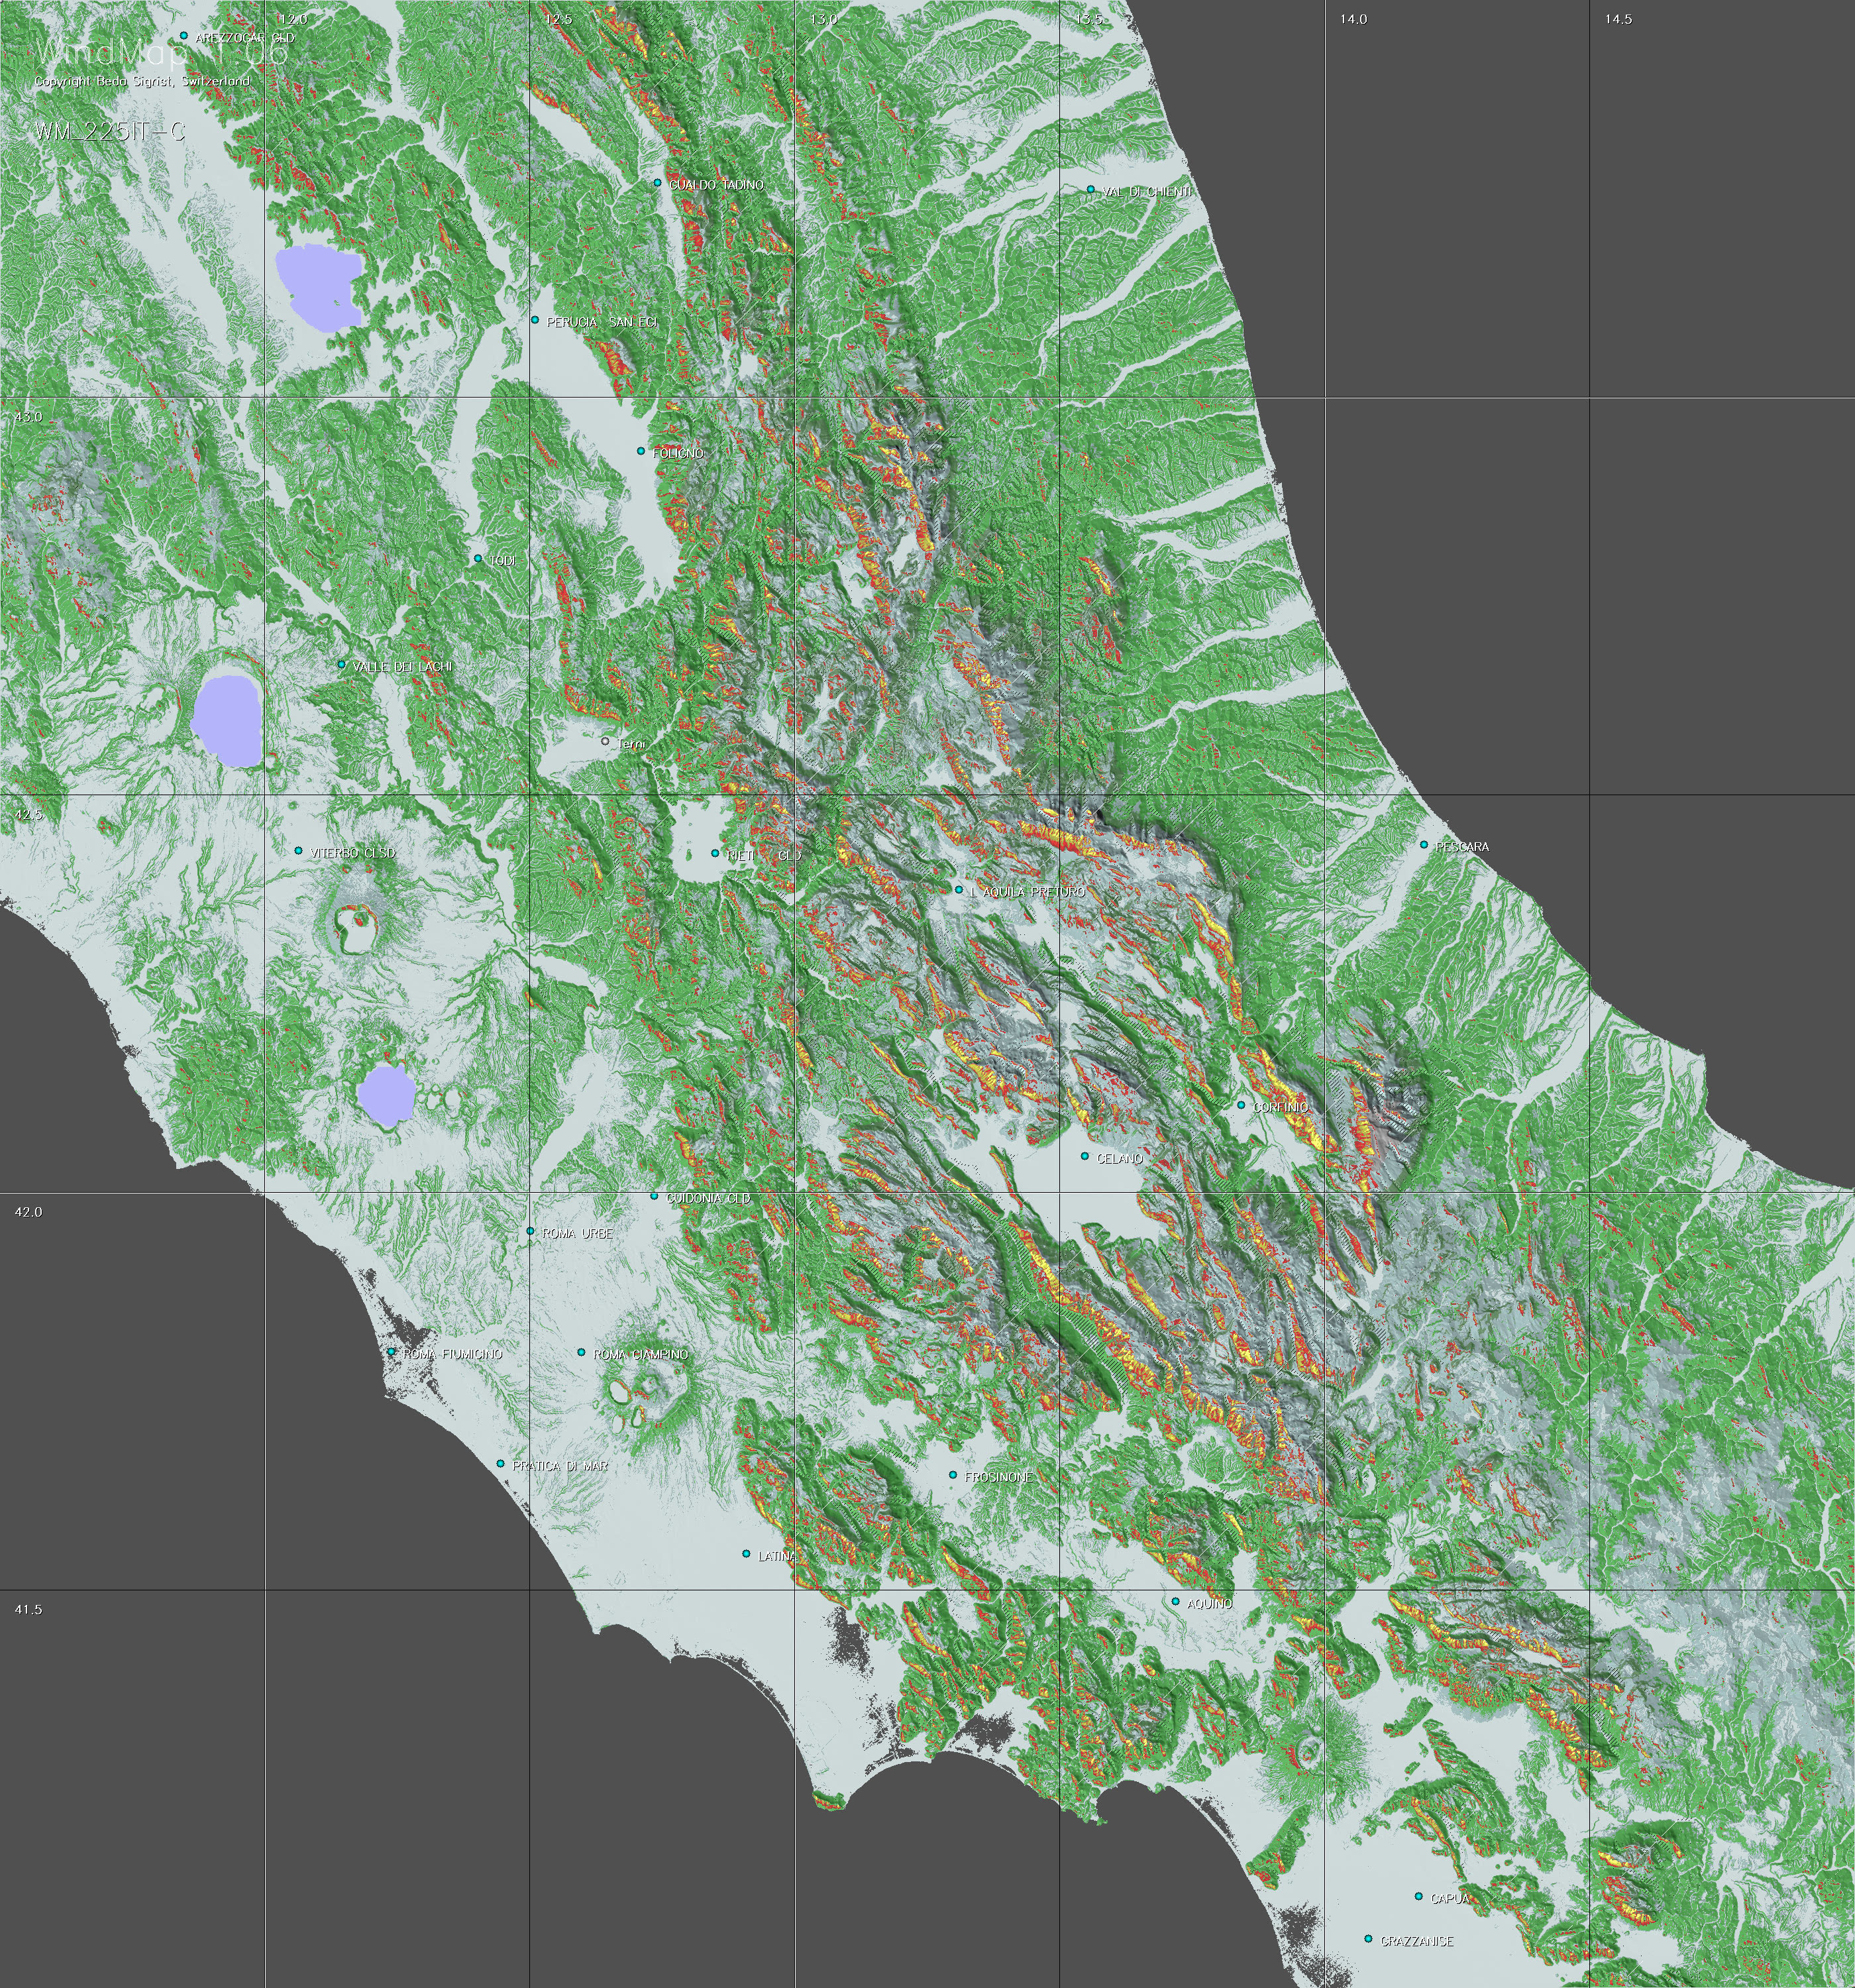
For every multiple of 15 degrees (e.g. wind from 195° in the case of the example), ridge wind maps may be downloaded from this site for numerous regions.
Before the flights WindMap
allows you to study the best itineraries, or to explain them to less
experienced pilots, particularly across less known regions. After the
flight, you may superimpose your flight tracks on these maps, typically
IGC-files (or kml-files with Google Earth), to find out where you might
have followed more promising paths. The maps may also be imported as
raster maps into some other flight analysis applications.
The Model |
a. Simple
ridge wind maps b. Maps considering channelled ridge wind |
a. Simple ridge wind maps
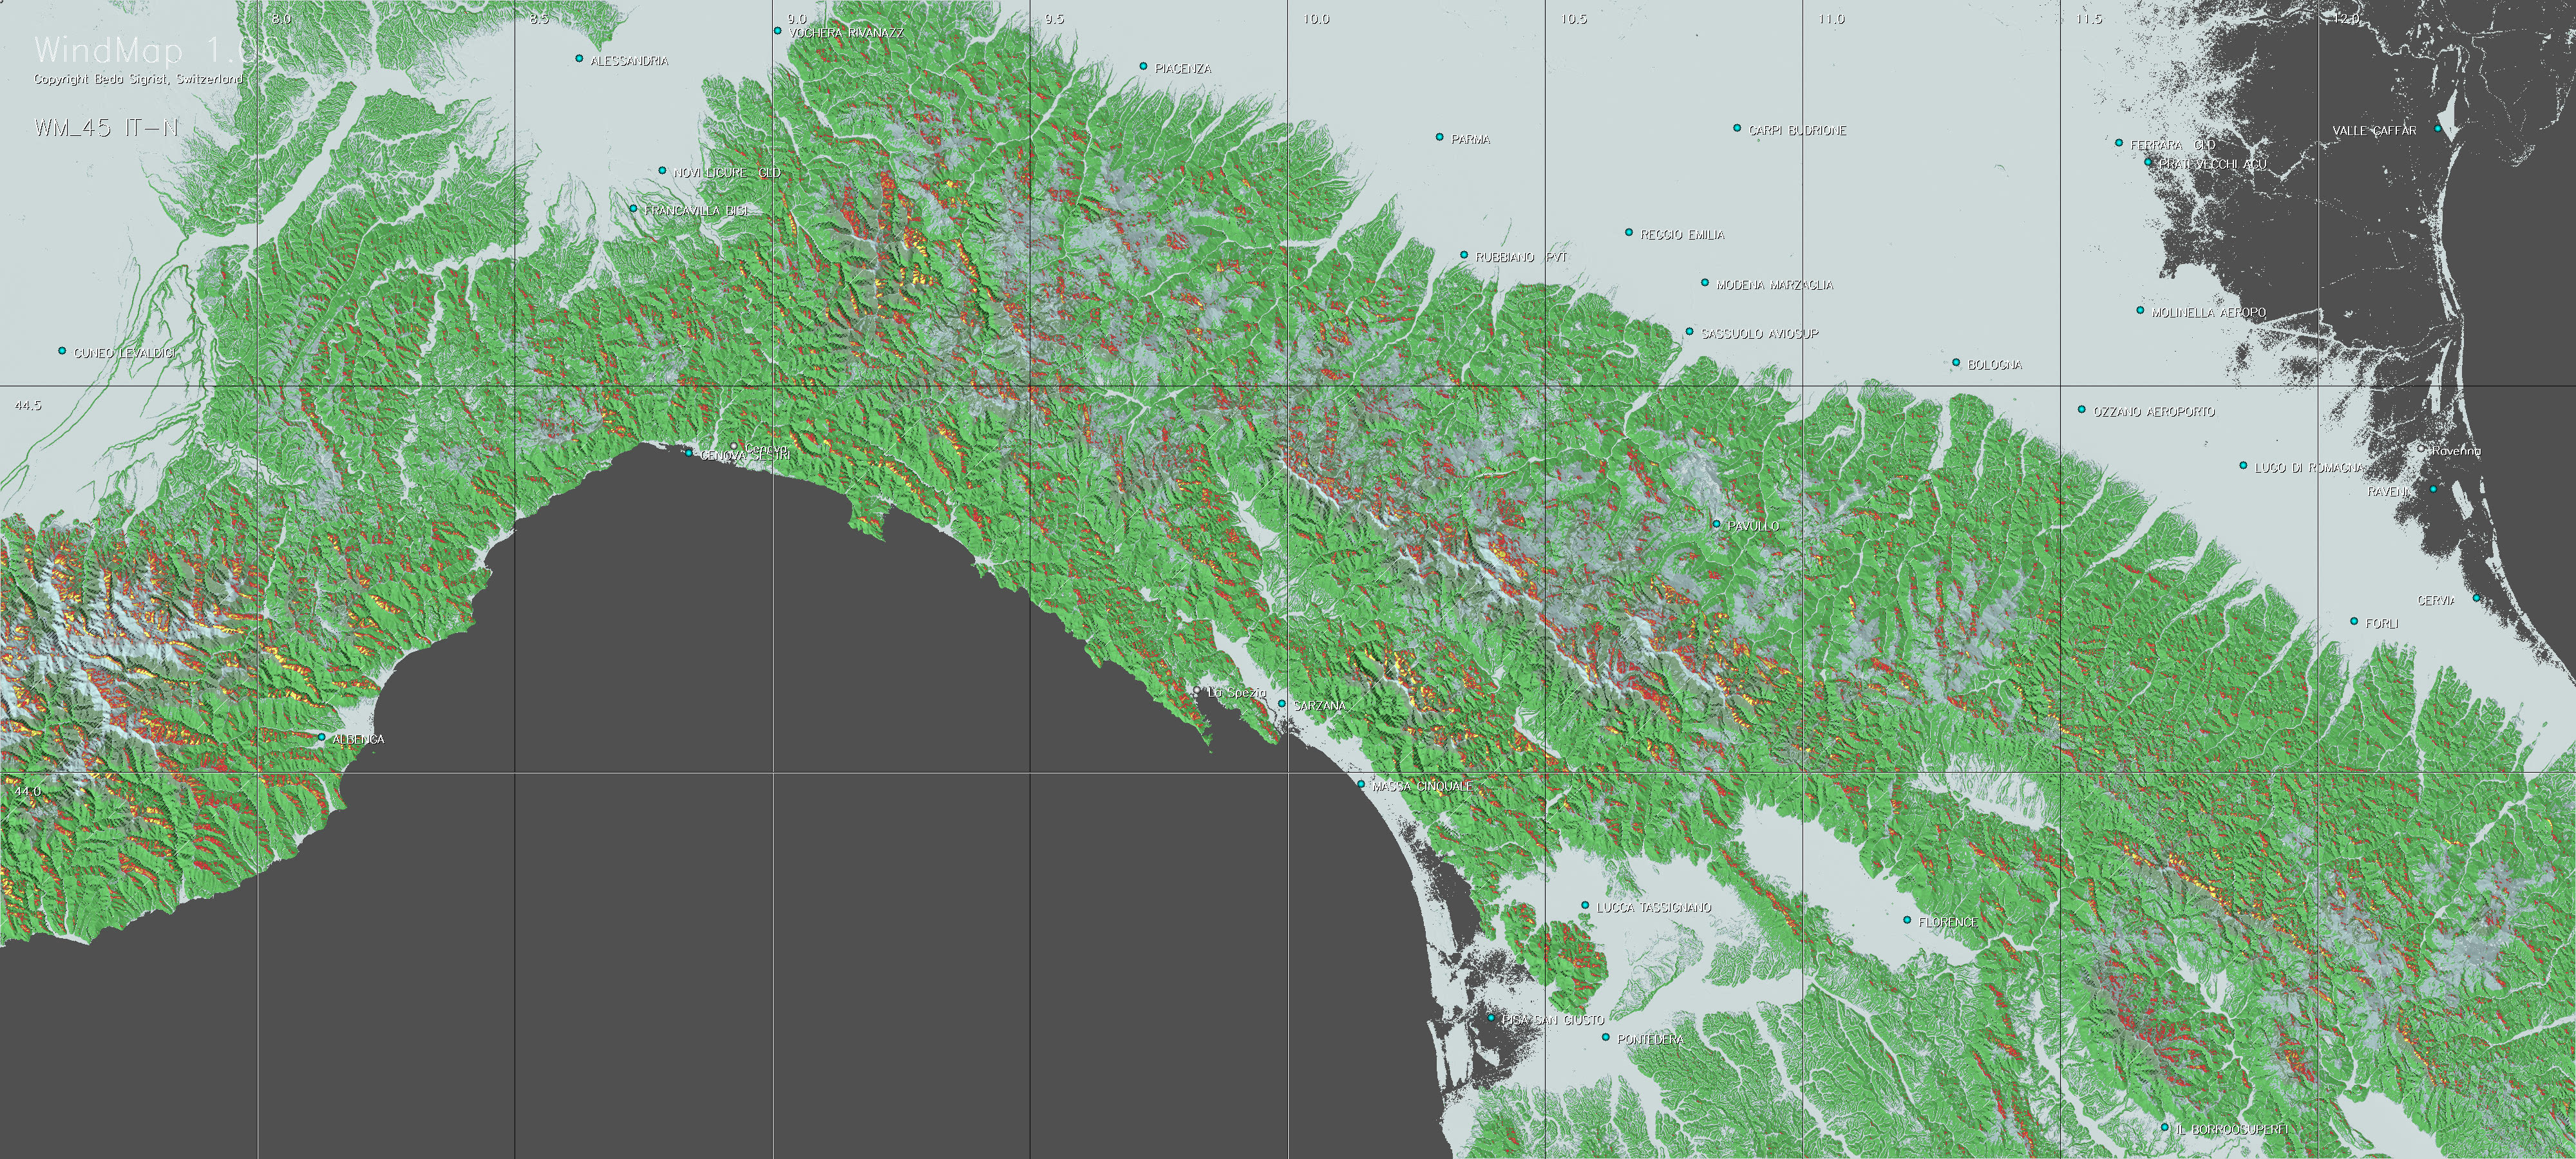
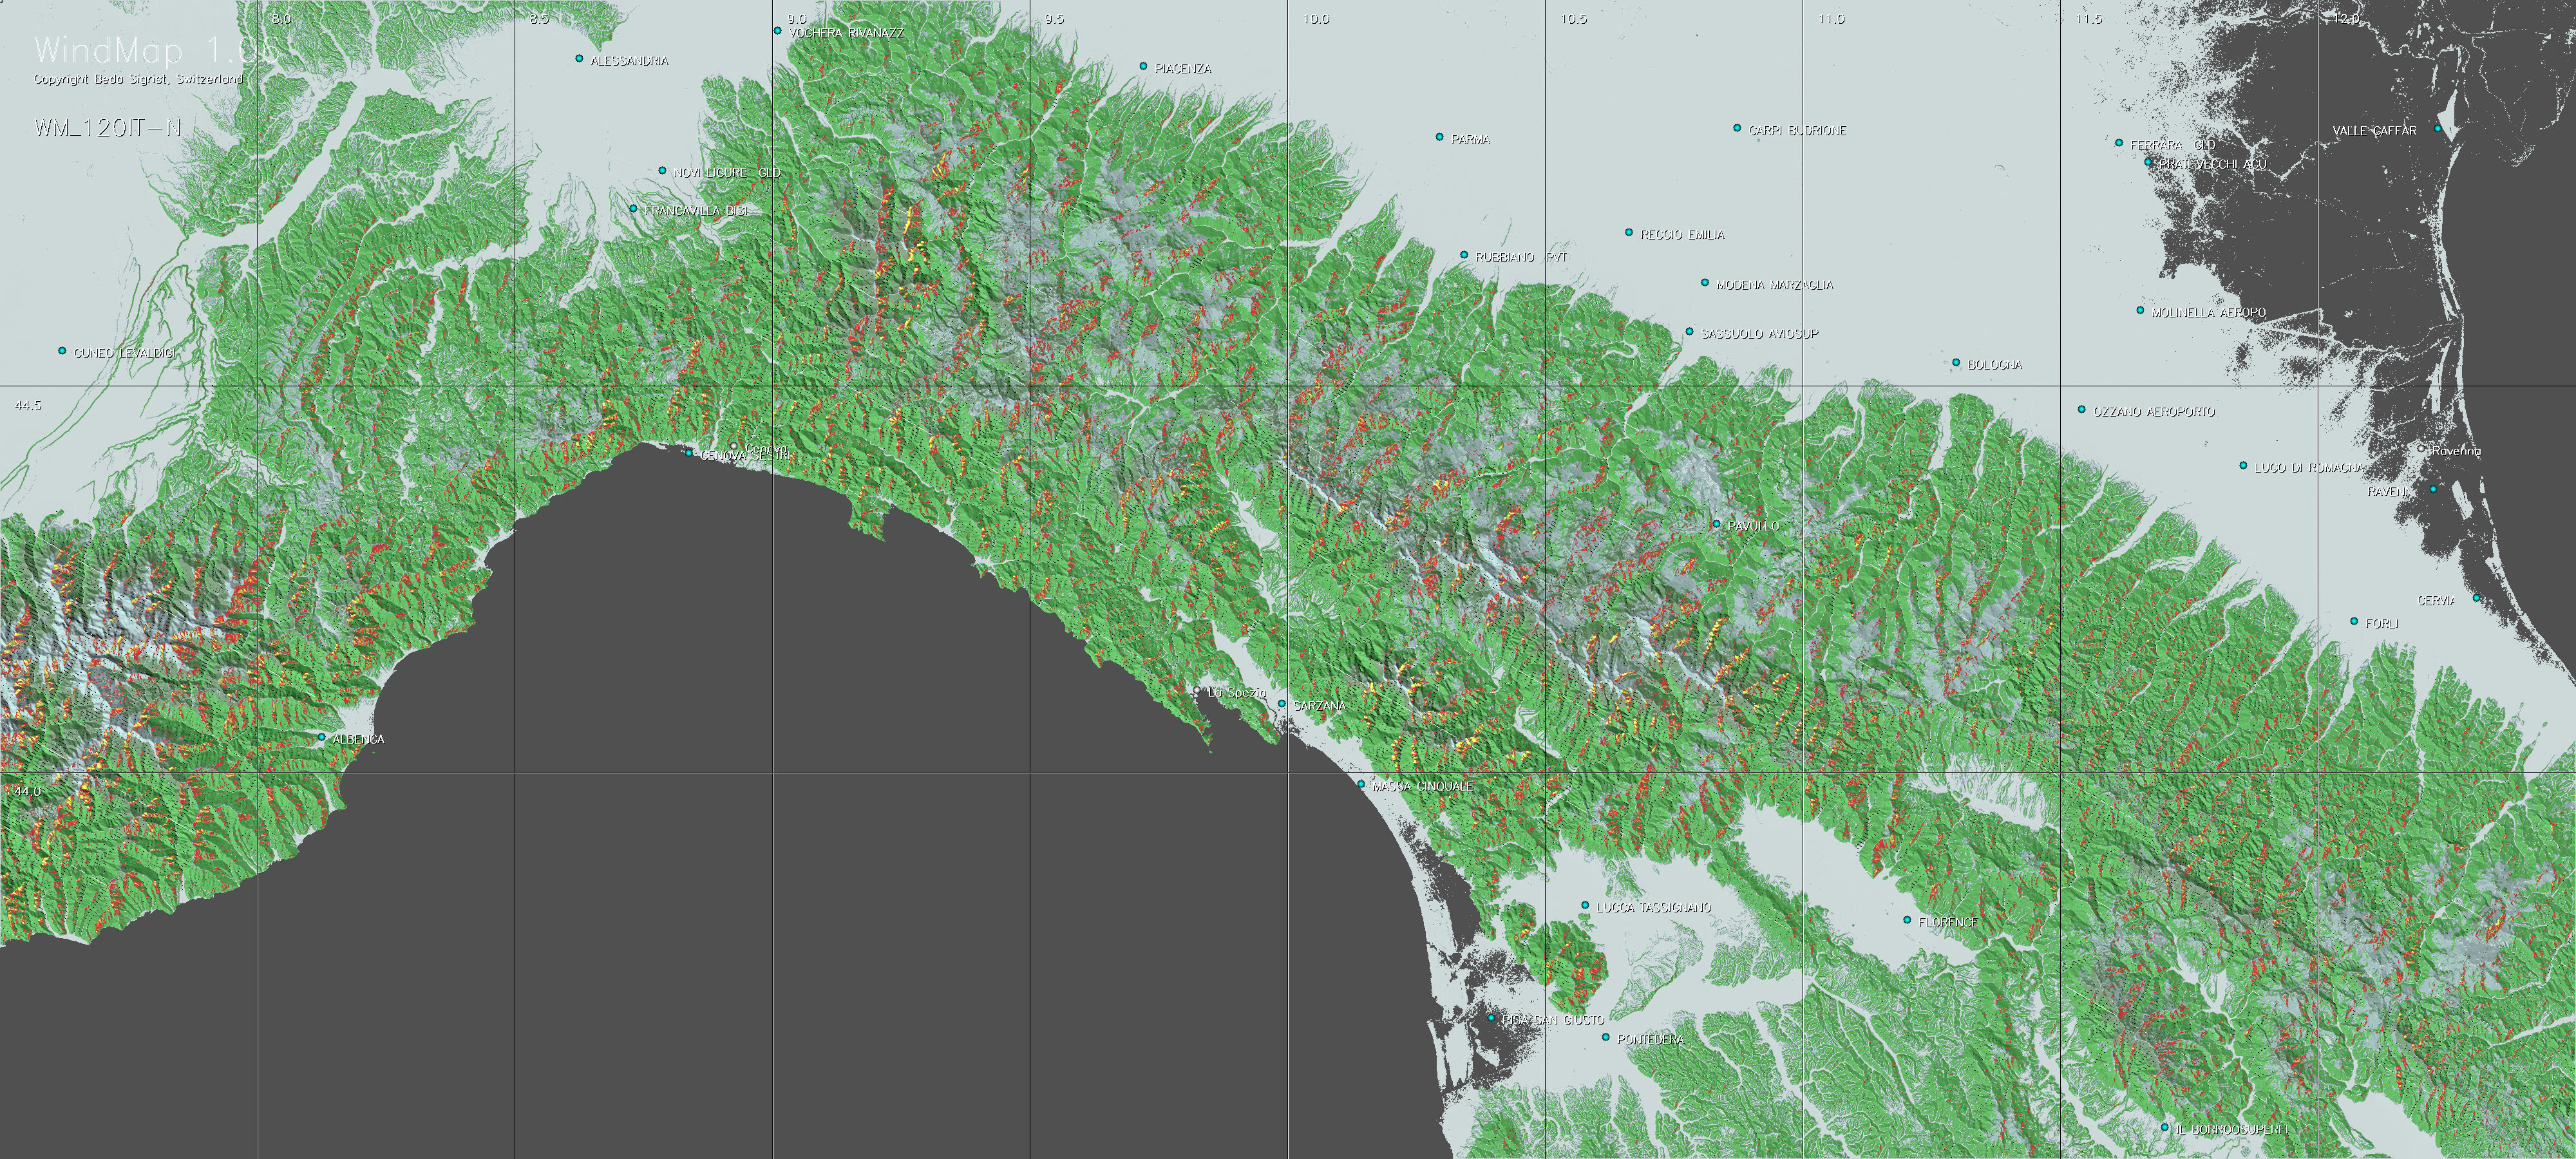
Digital elevation models (DEM), such as the worldwide 90m SRTM satellite models, provide a relatively detailed topological profile of the surface of the earth. Extracts of these files can be used to determine the special orientation of each surface cell of about 90 meters. If wind from a given direction blows against such a surface field, it will usually be diverted by the latter, basically in the direction of the intersection between the plane of the surface field and the plane determined by the original wind vector and its mirror on the surface plane. This is of course only applicable where the wind vector meets a surface element from above. The vertical component of the diverted wind is used as a measure of the upwind potential at the location of each surface field. A further factor of importance is the downwind area behind obstacles within which no upwinds can be expected. Based on empirical analyses WindMap assumes these areas to be determined by a shadow declining by 10 degrees in the direction of the wind. Despite its simplicity this model already leads to fairly realistic ridge wind maps, as illustrated on the sample map shown below.
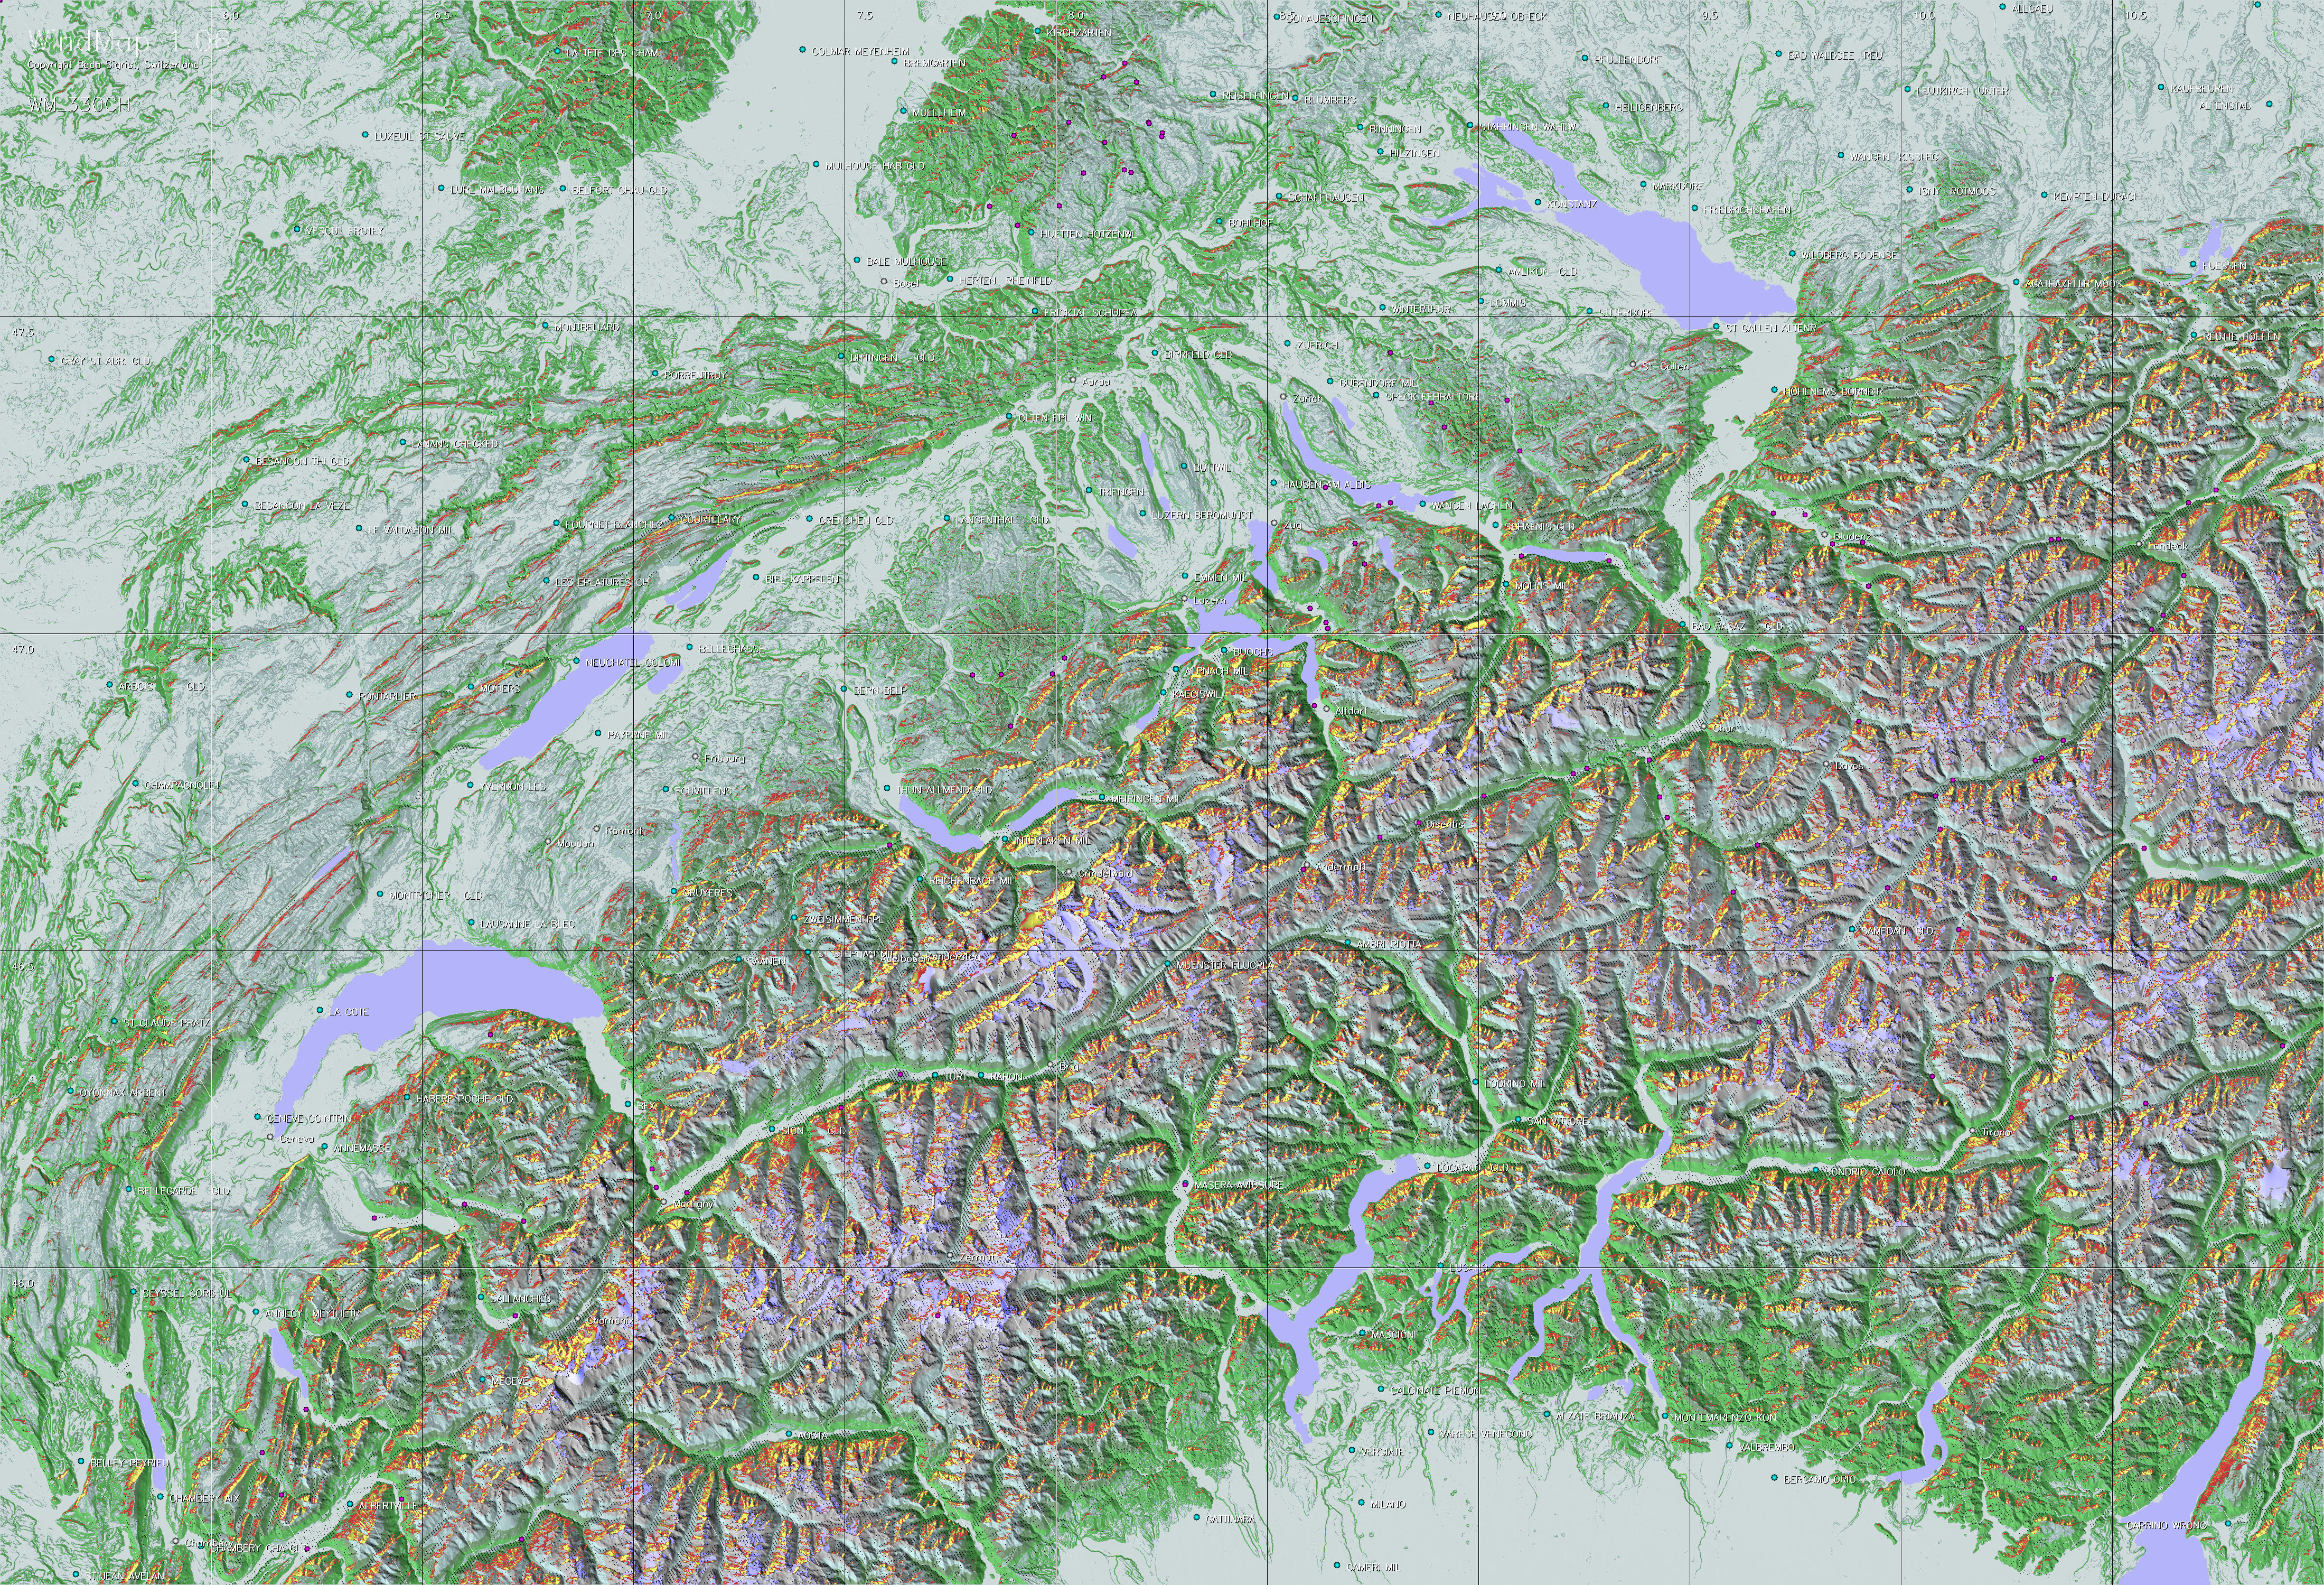
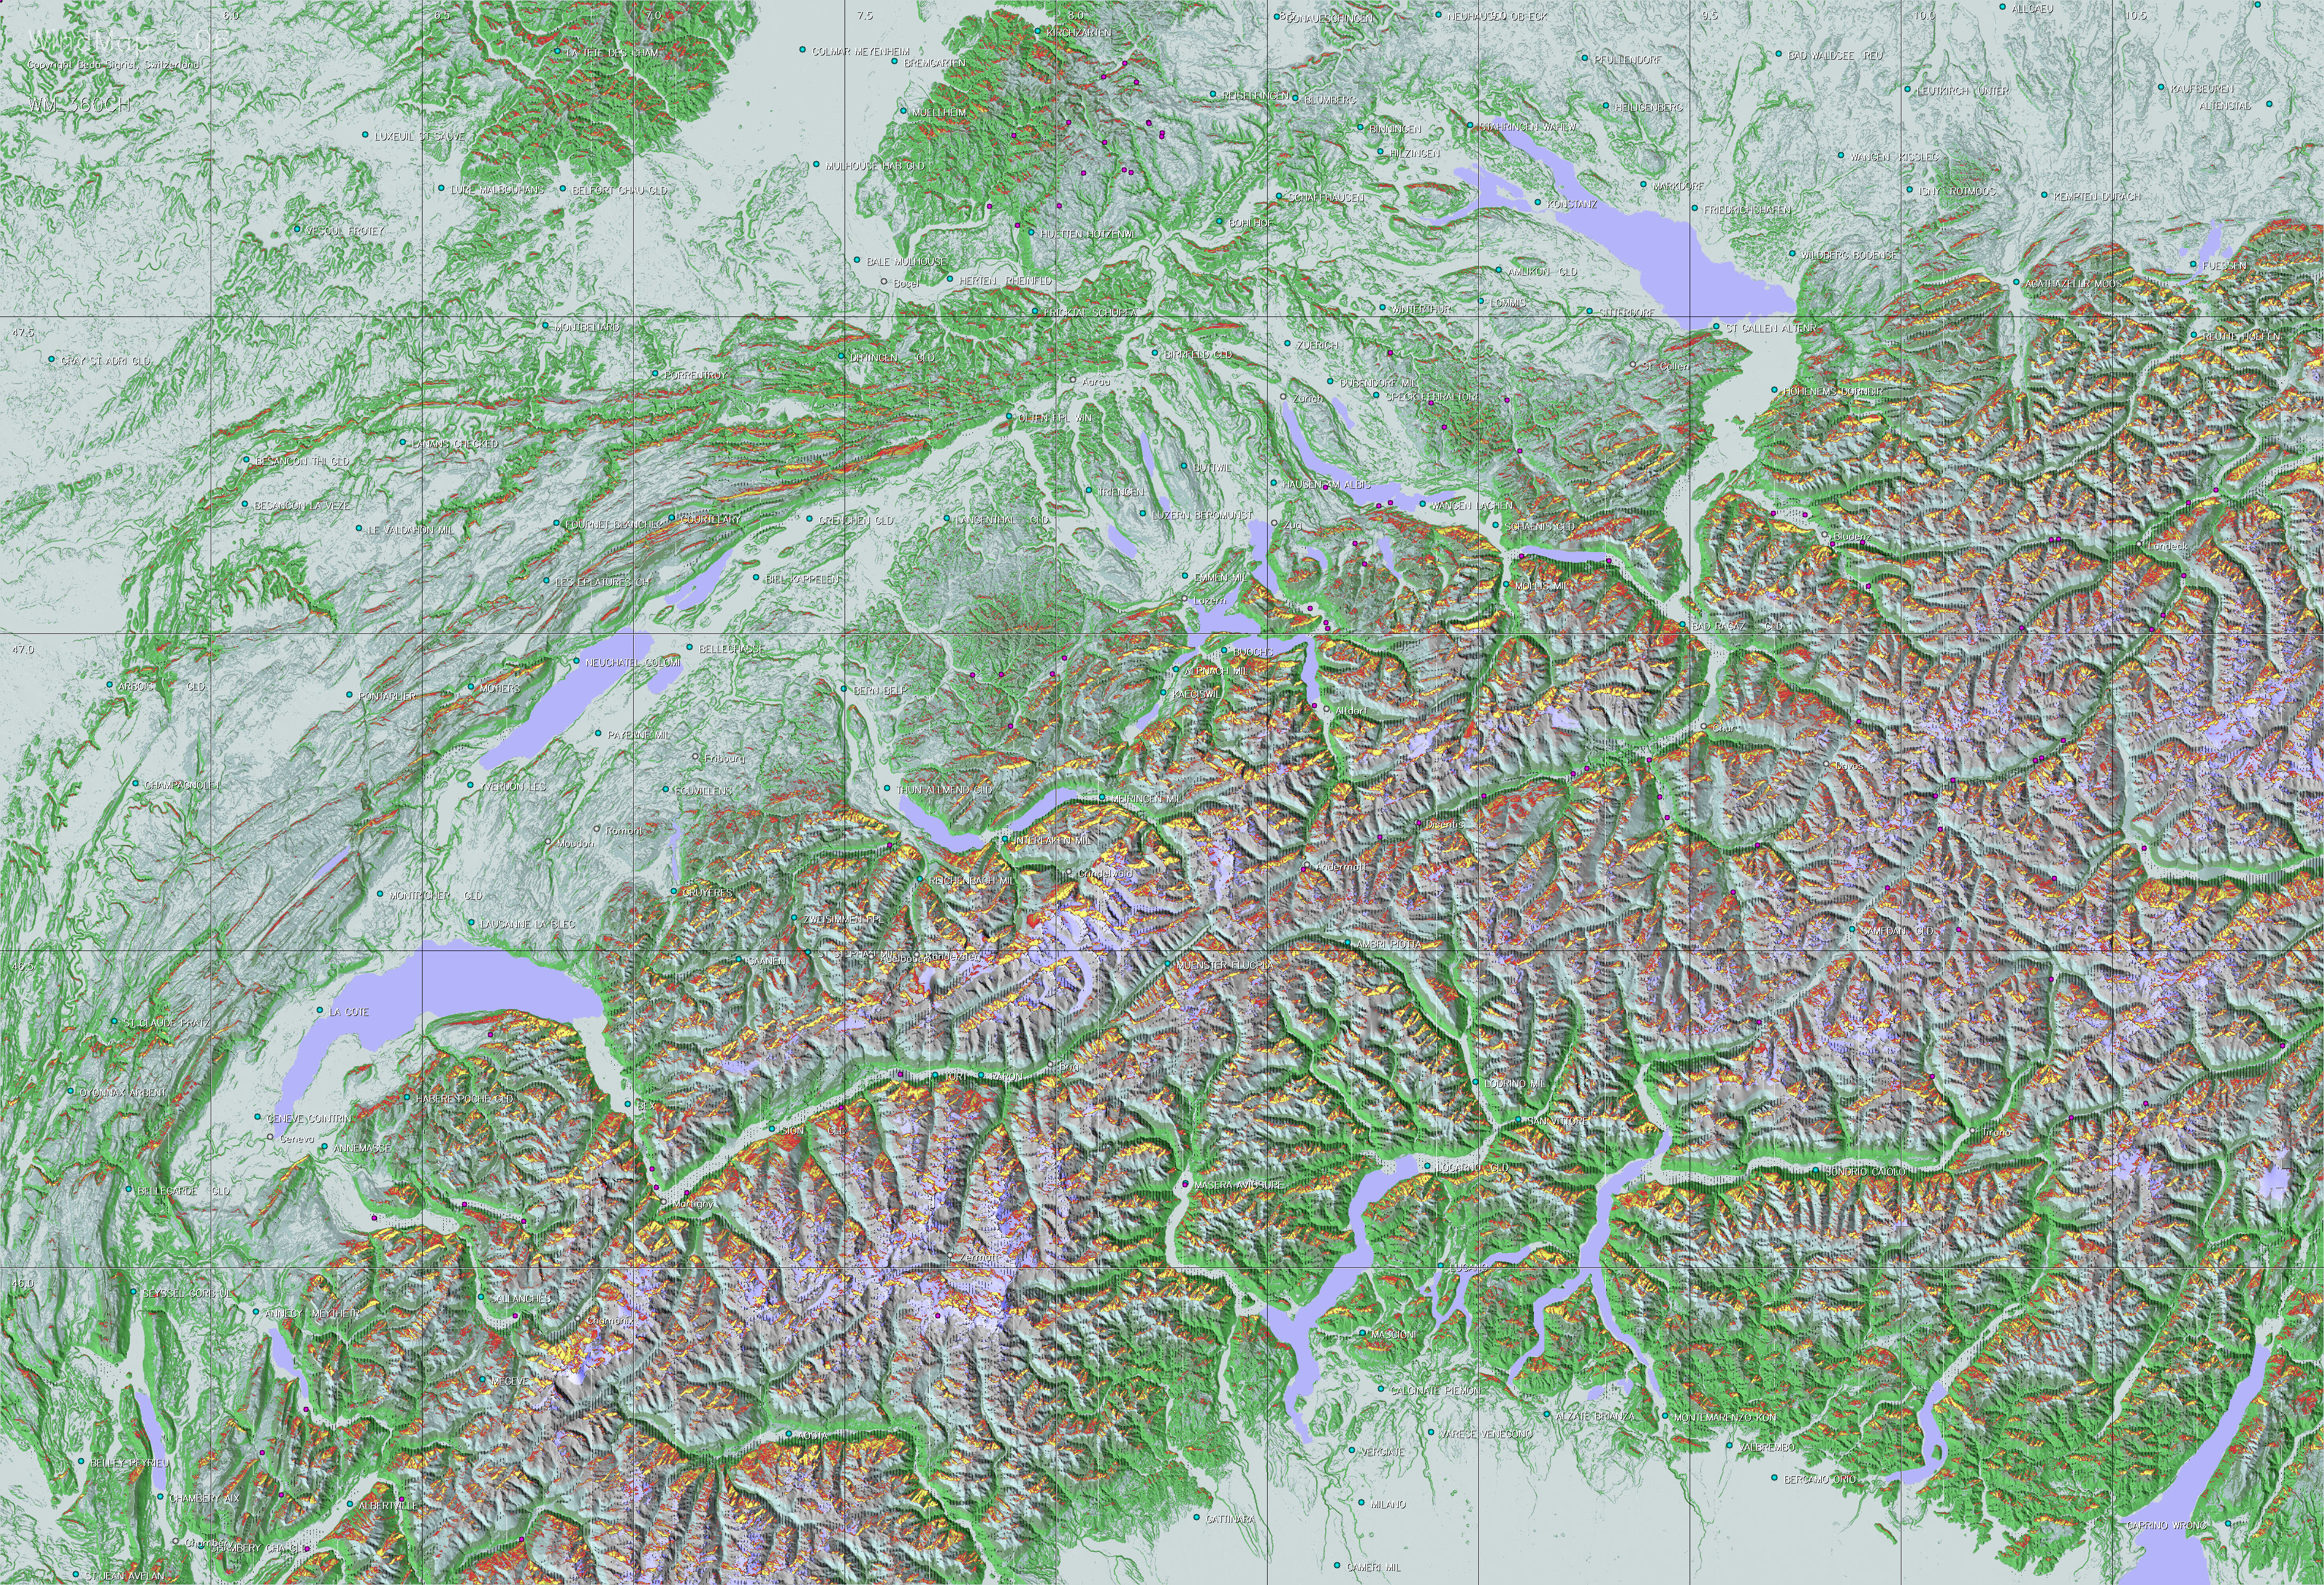
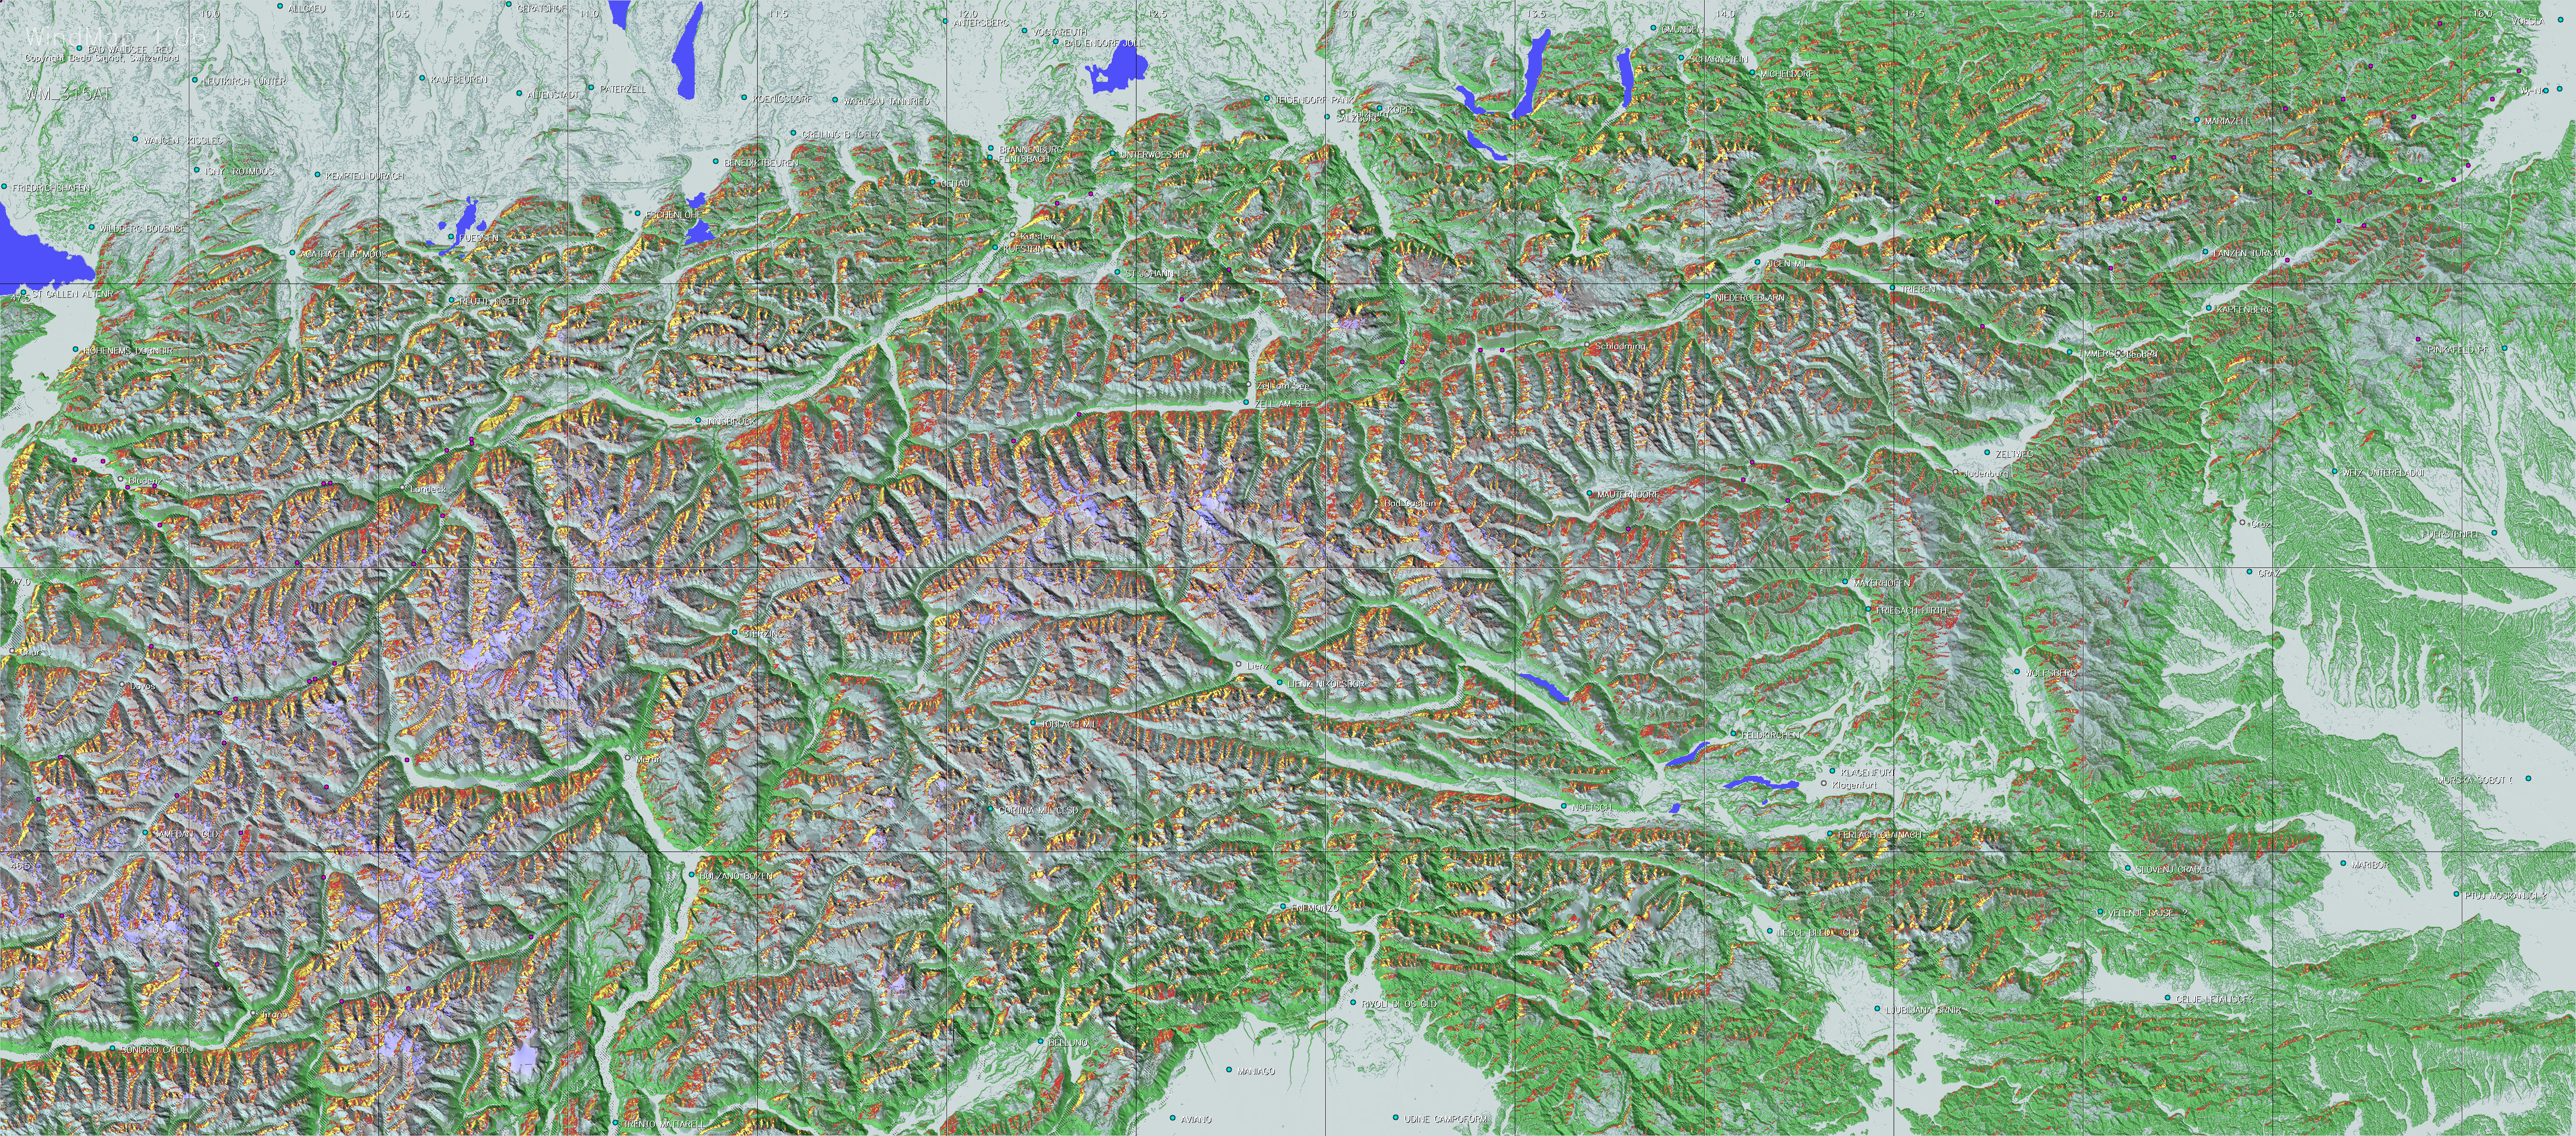
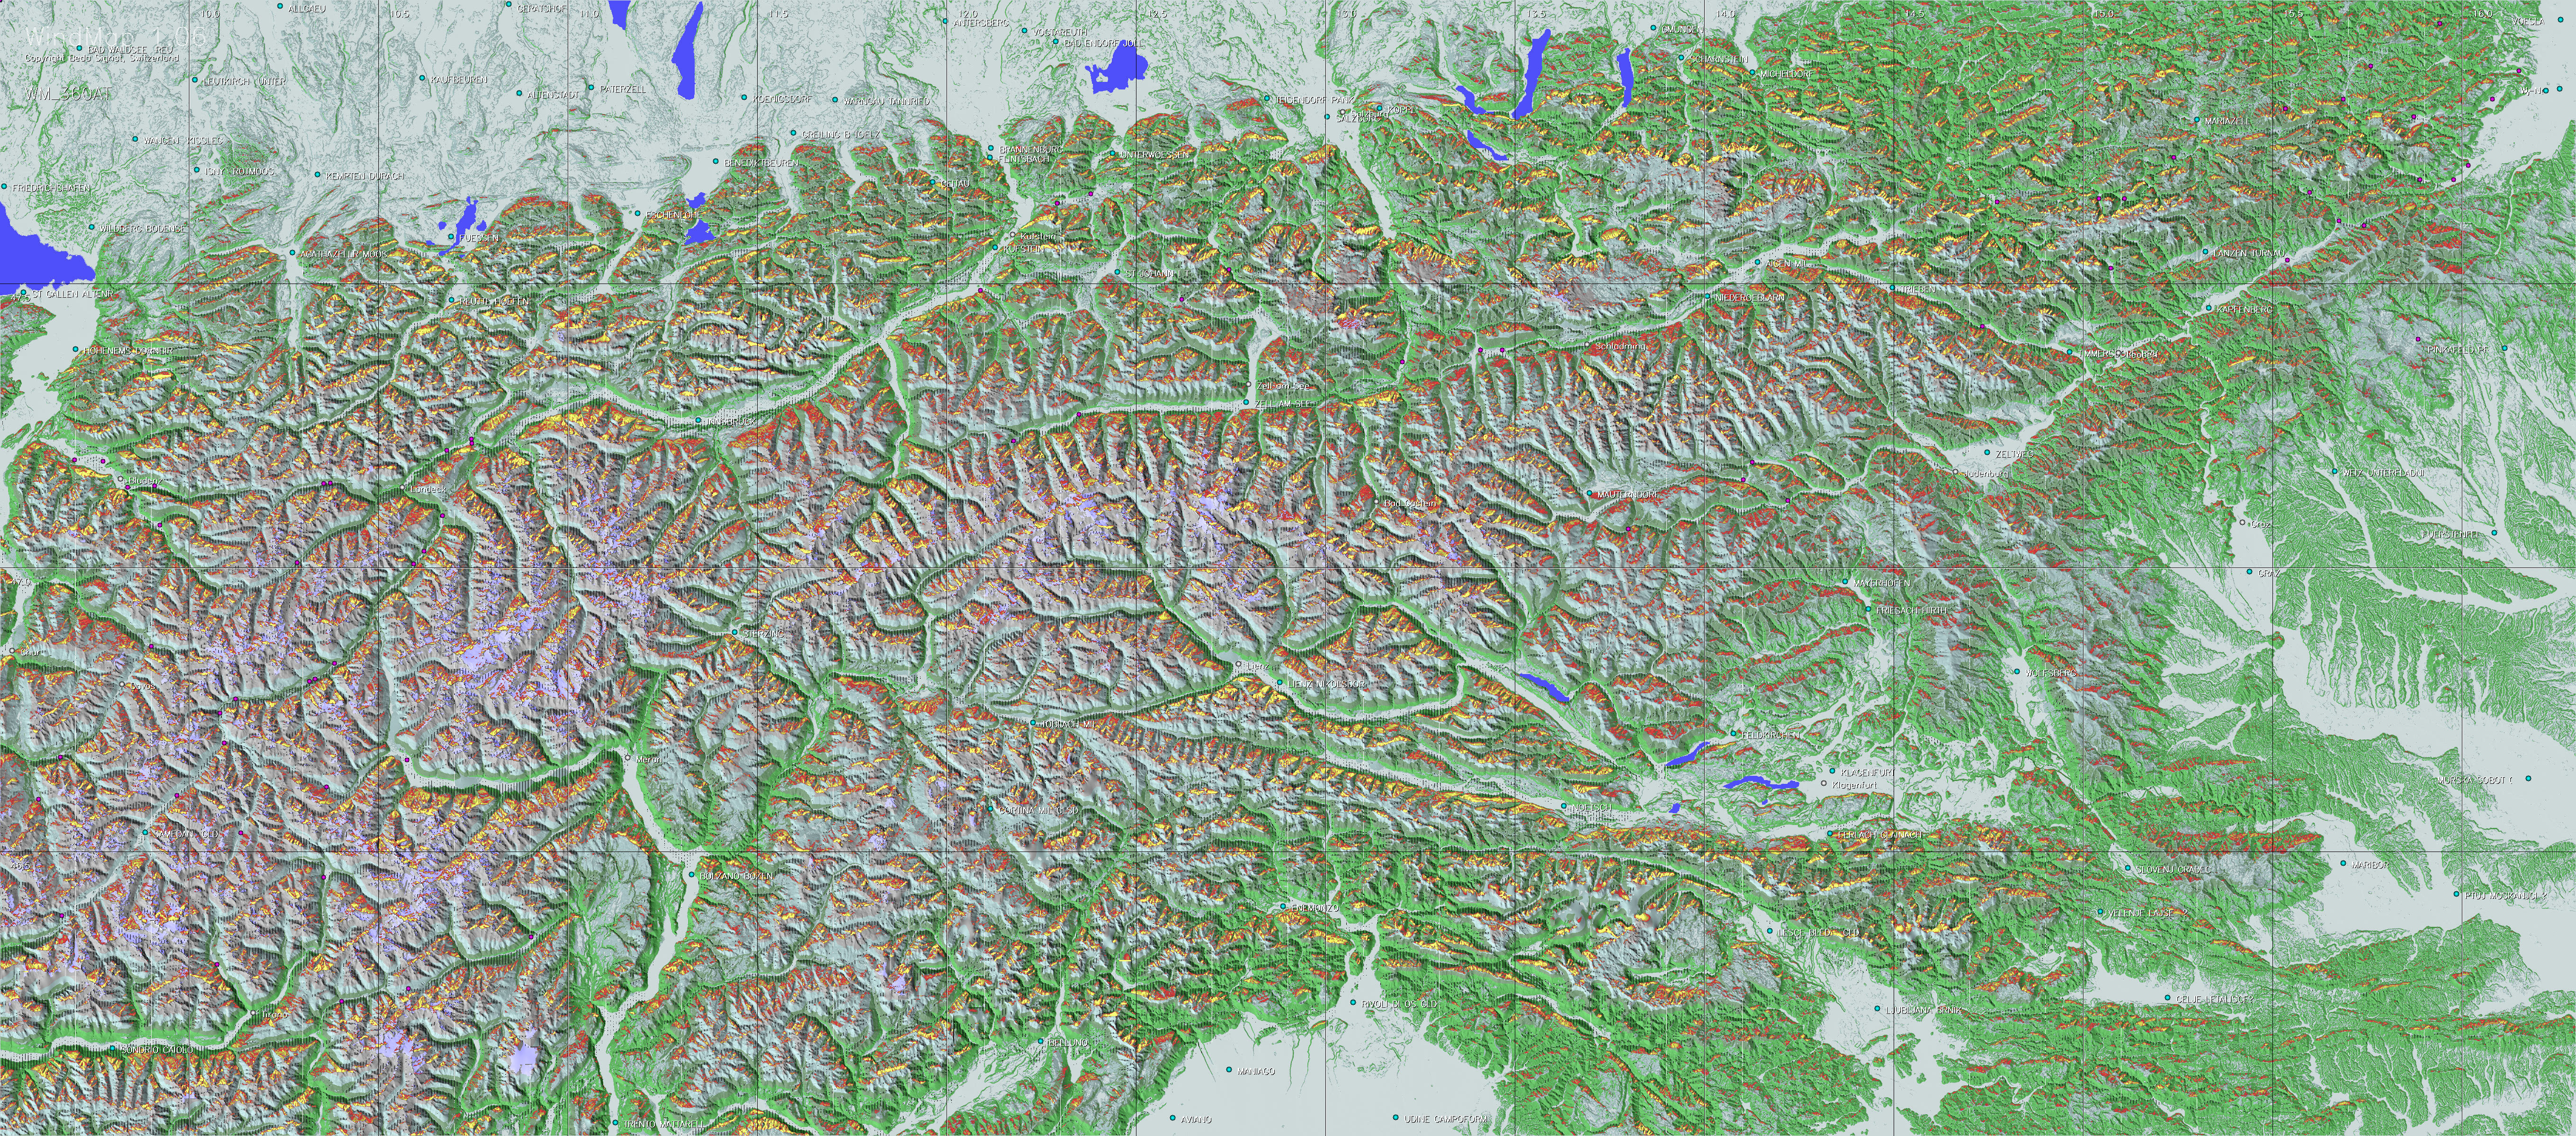
b. Maps considering channelled ridge winds
In the simple model the wind deflection is calculated independently for each surface element. In practice this is only partly valid, namely when adjacent surface elements have the same spacial orientation. However if wind blows up a narrowing valley, the air flow tends to be compressed and hence the wind normally accelerated. In the present, refined model, such compression effects have been considered over a local distance of about 400 meters. This has led to more pronounced maps, as can be seen when moving the cursor over the picture of the simple model below. The refined method has therefore been used for all maps offered on this site.
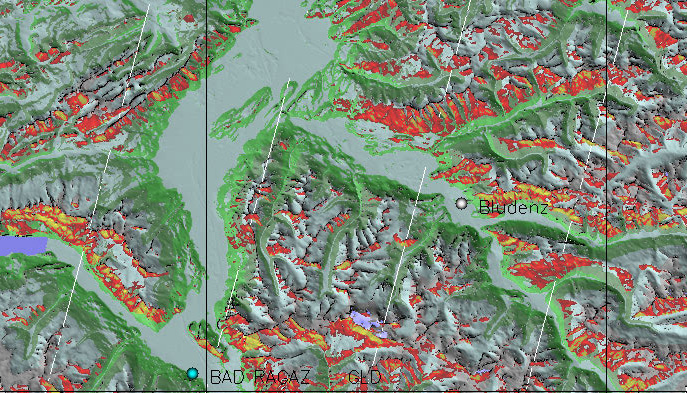
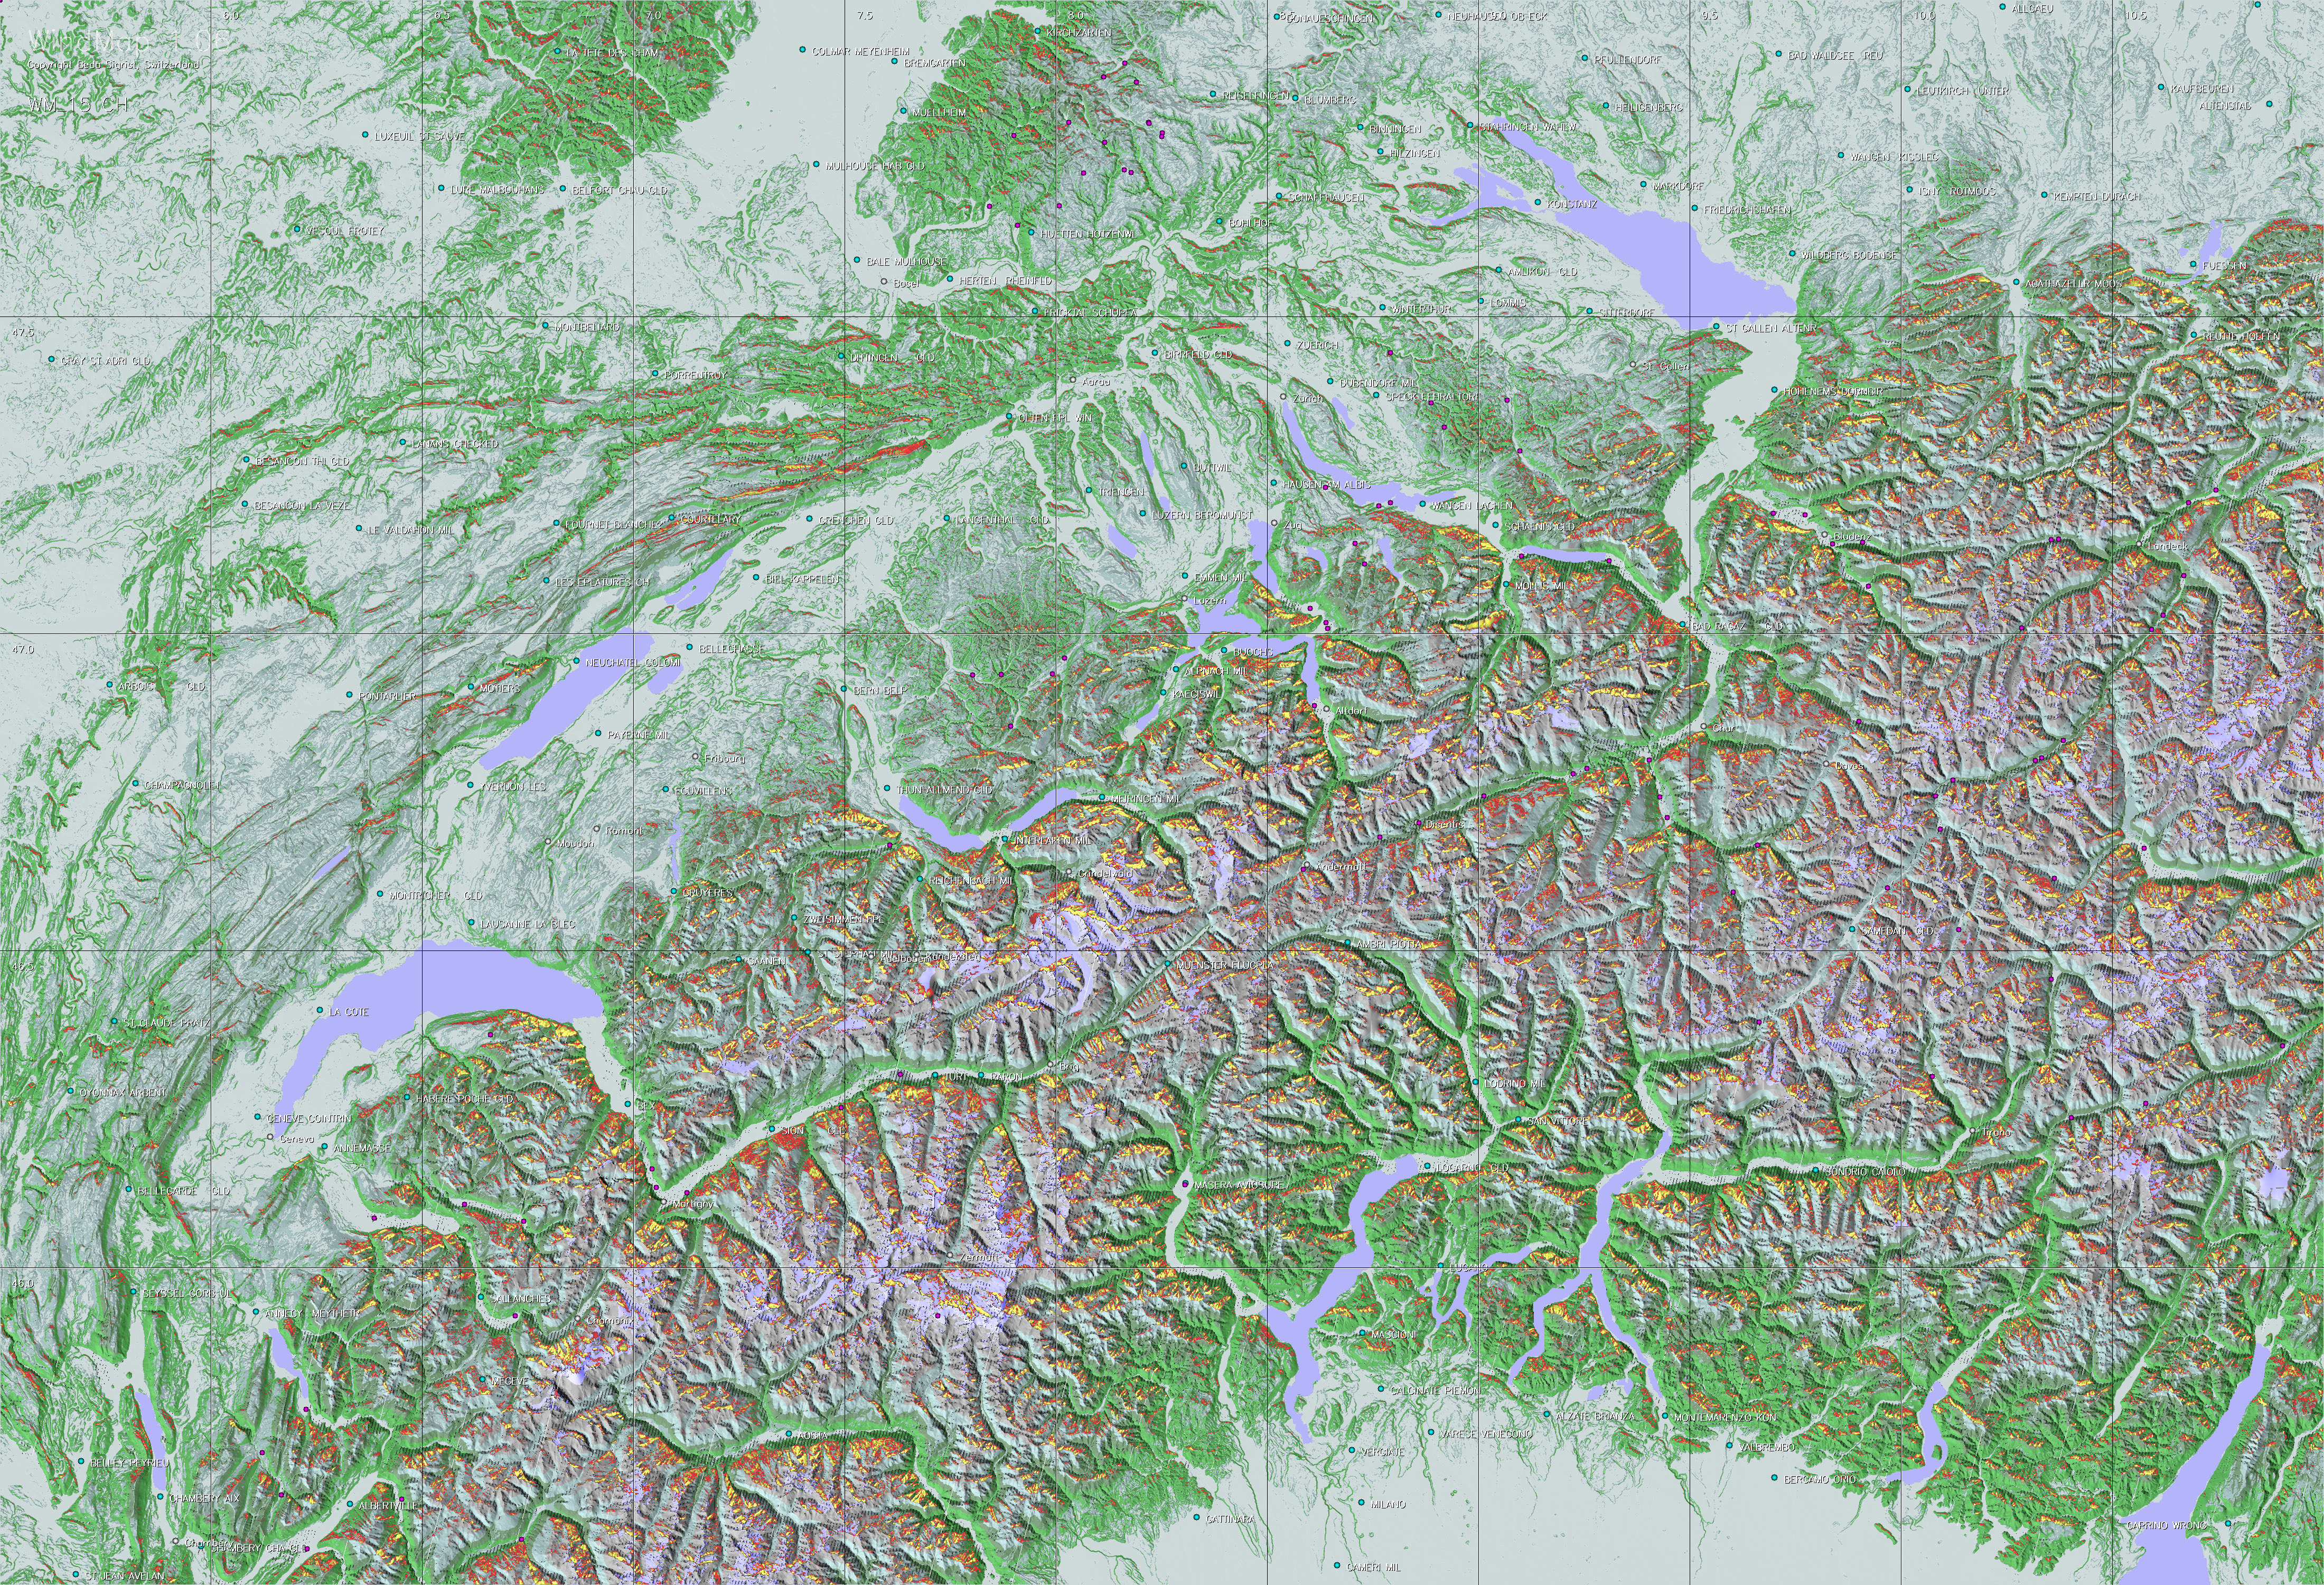
Region east of lake Walensee,
for wind from 195°, generated by the simple model.
Moving the cursor over the picture reveals the refined map with channelled
ridge winds.
Using the maps |
a. Selecting the right maps |
a. Selecting the right maps
|
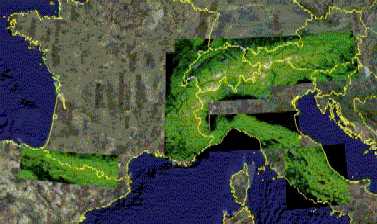
Depending on the extent of your flight you may have to select the maps of more than one country or region
|
|||||||||||||||||||||
|
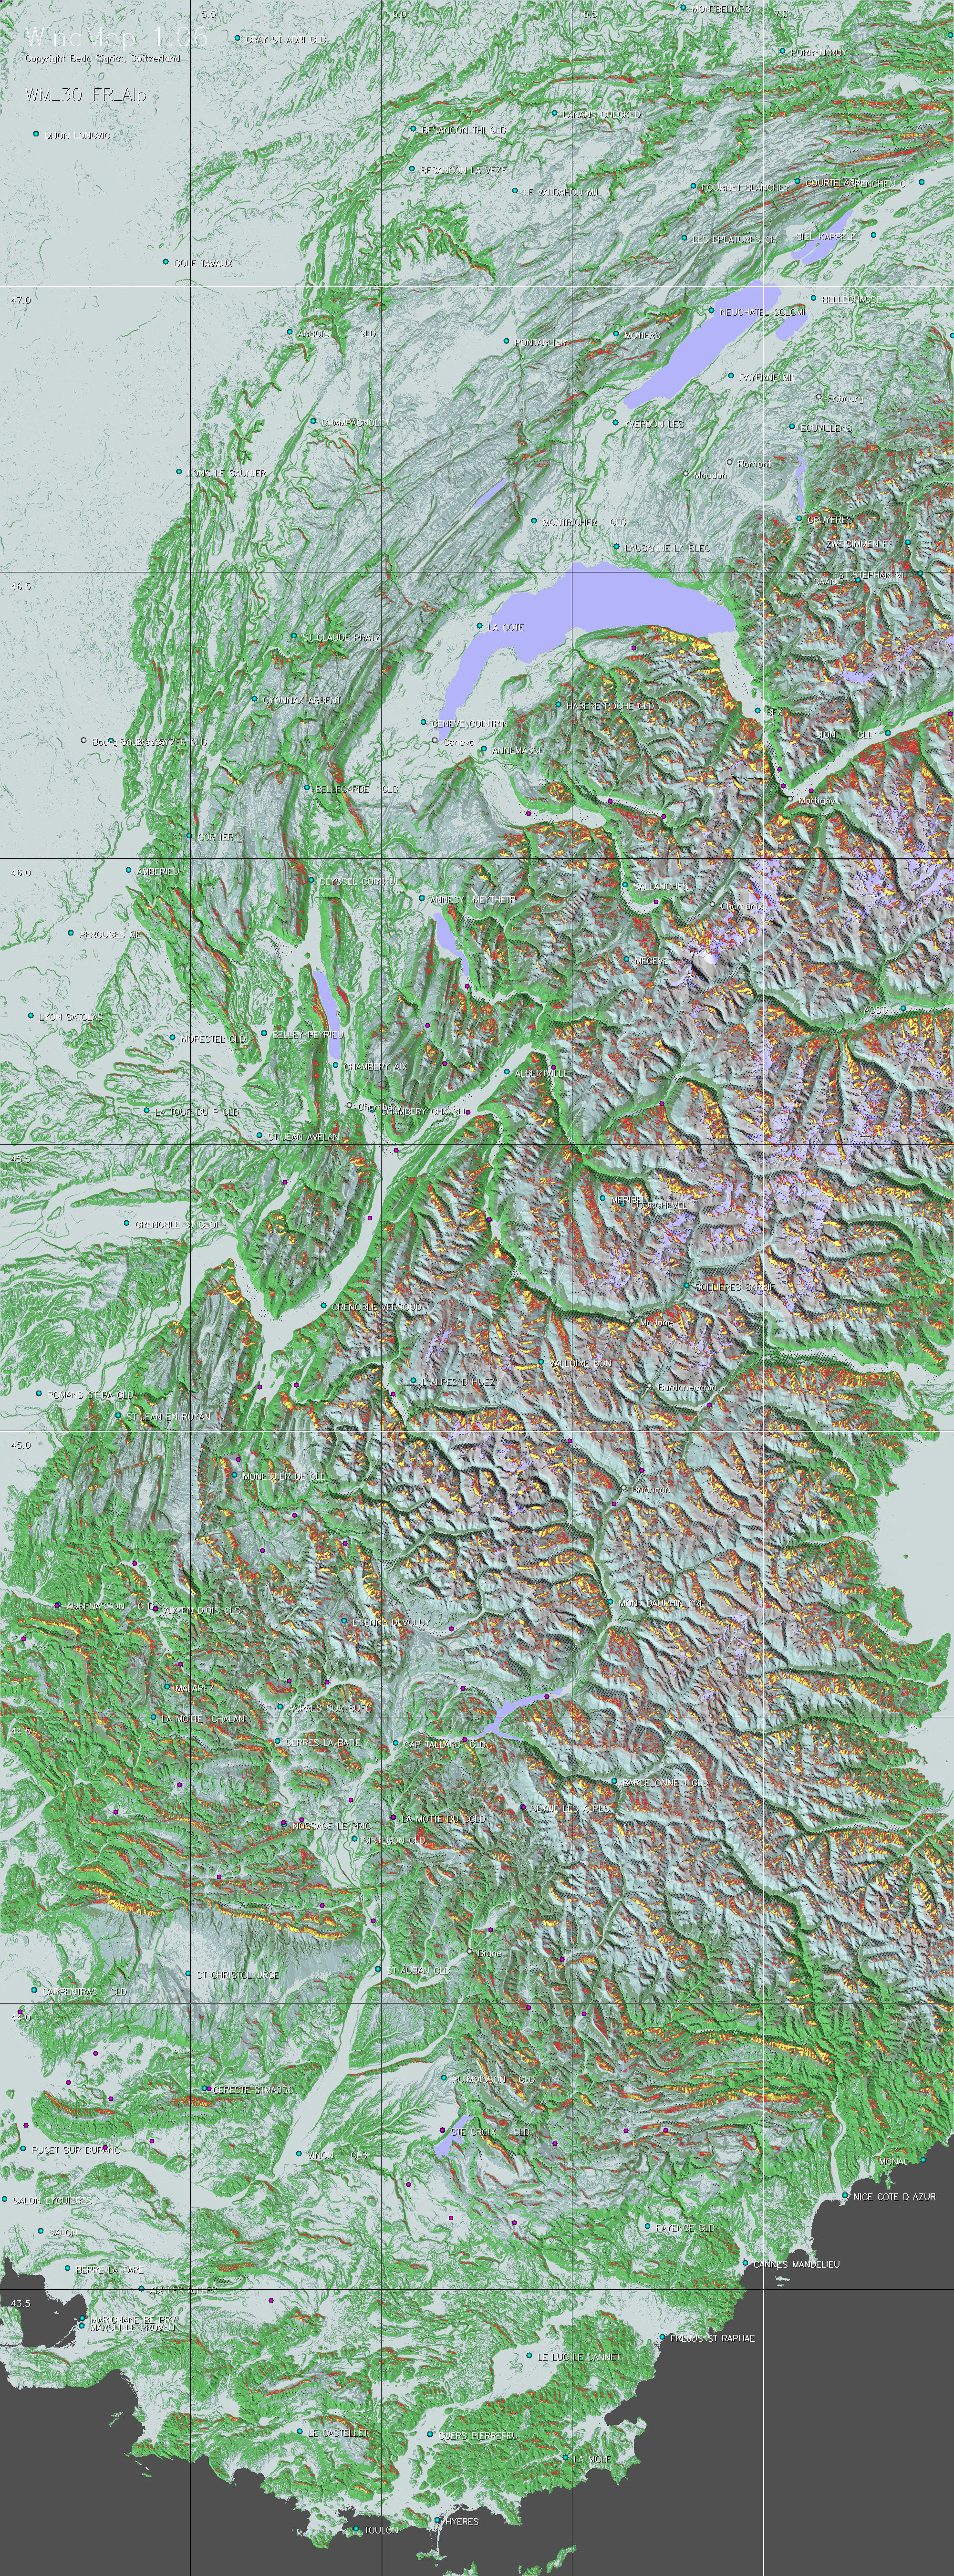
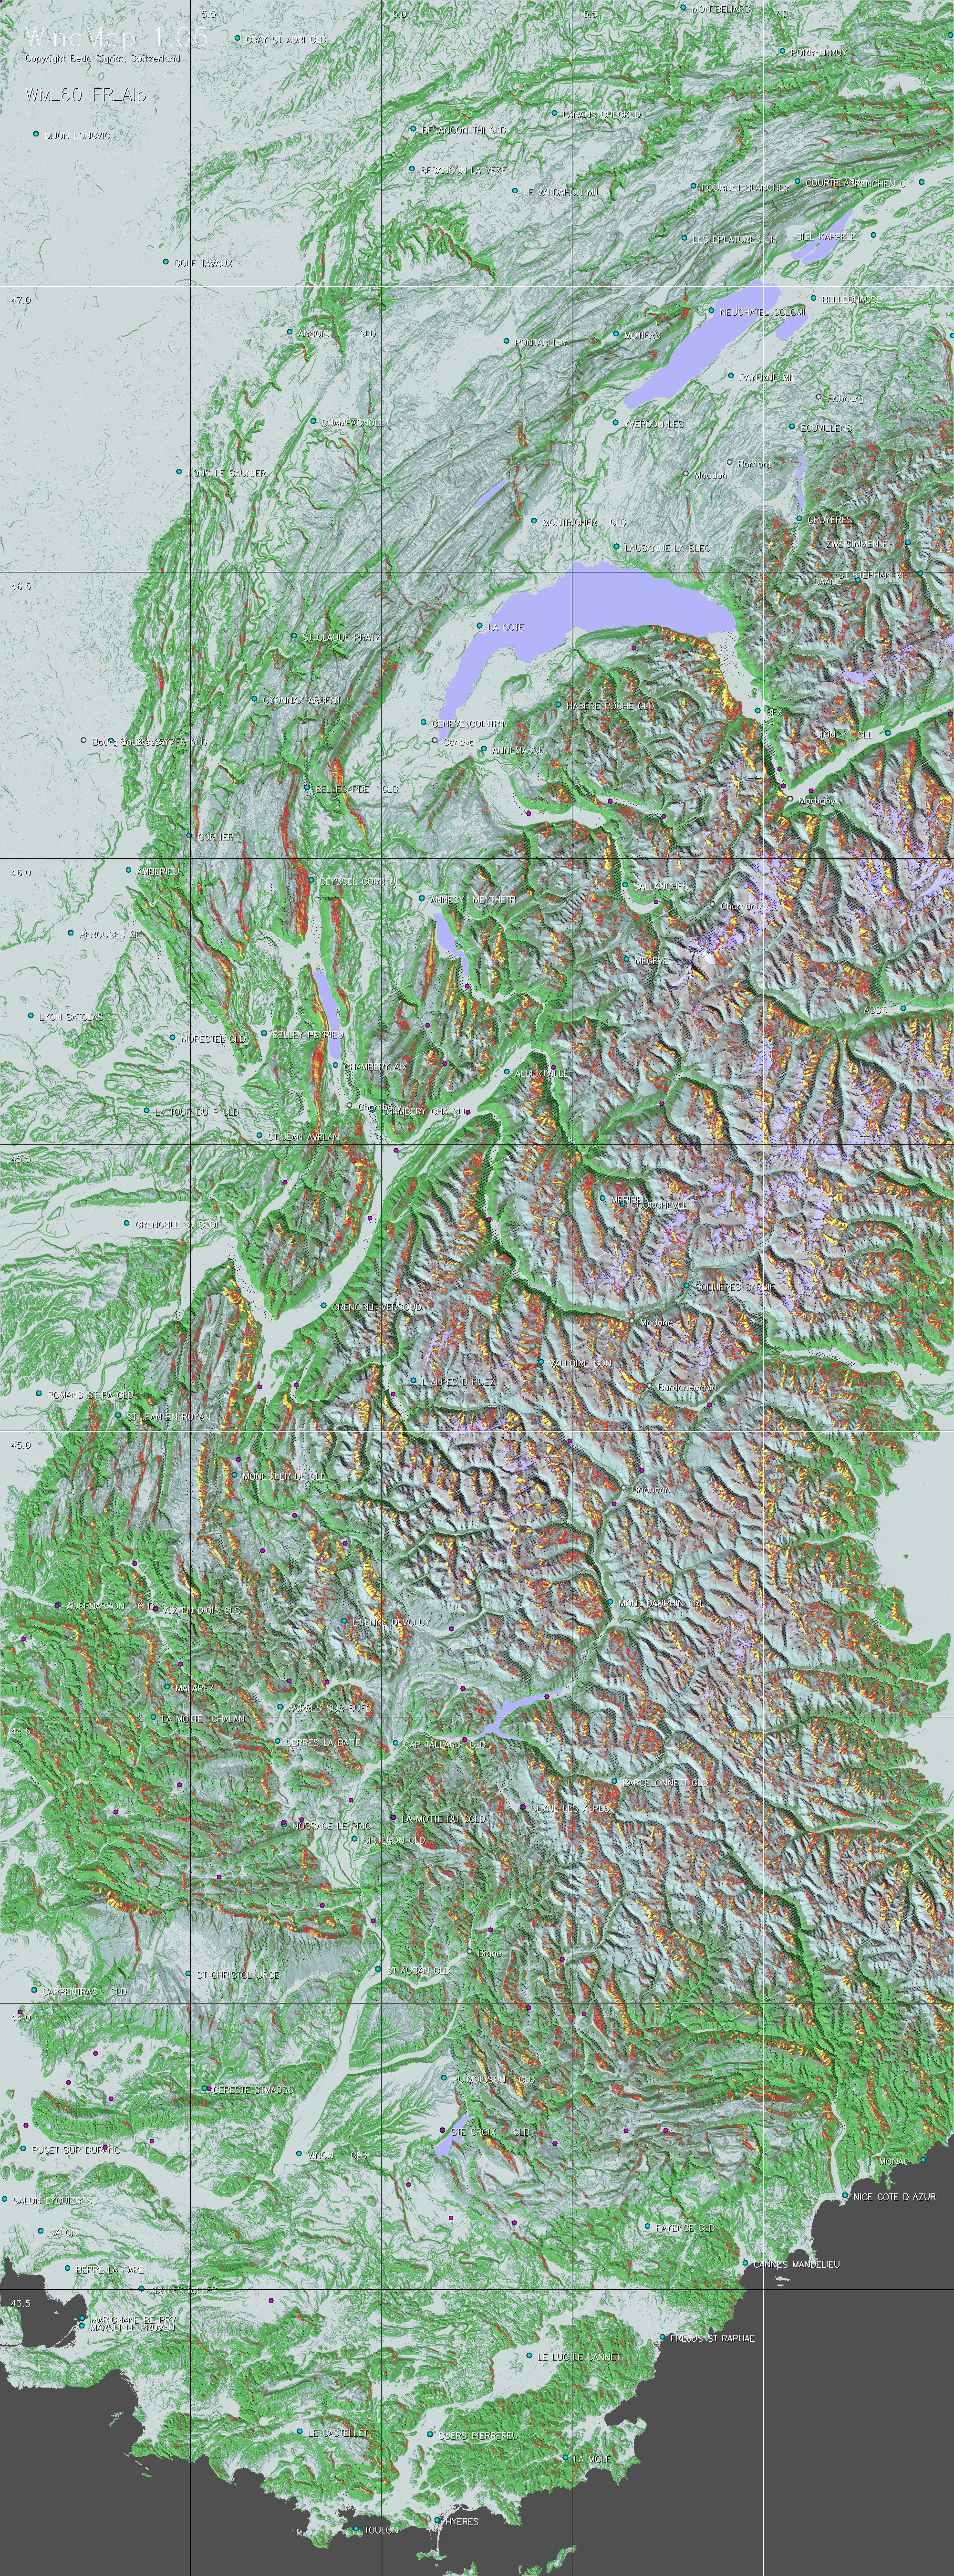
WindMap offers 24 maps per region, with 15° increments for the wind directions from 15° to 360°. Select the maps showing the main wind directions of your flight. The wind directions are included in the file name. |
b. Limitations of the WindMap approach
-
Limitations of radar maps: Radar reflection signals are not perfectly precise when scanning altitudes. They are rather unreliable when reflected by water or ice. This it why it is difficult to automatically identify lakes on the basis of radar scan data. In the present TherMap version many lake outlines have therefore been imported separately, but these imports had to be limited, due to the manual effort involved, and hence not all lakes are displayed. Ice covered surfaces may appear blurred. Fortunately neither of these limitations is of real importance for the use of the TherMap maps.
-
Changing wind direction: WindMap is based on a simple local model and each map is calculated for one single wind direction. Wind directions and strength can however change with the altitude and the geographical position. This can lead to atmospheric interactions not covered by the WindMap model and which the users must therefore interpret accordingly.
-
Other influences: Whilst one part of a distance flight may be determined by ridge winds another part may be dominated by thermals, with a blurred transition zone in between. In such cases it is advisable to study the corresponding maps for both, WindMap and TherMap. On the other hand during days with strong winds it is possible to meet upwinds at locations having no potential according to WindMap. This can be due to mountain waves or large scale channelling effects, none of which are considered in the WindMap model..
c. How to read the maps
-
Zooming: The maps should be zoomed at least to 100 percent. Original maps may contain around 20 megapixels, which corresponds to about 25 standard screens. The maps are worthwhile to be studied in detail, if necessary by zooming above 100 percent, due to their huge information content. For your convenience it is recommended to use viewers (e.g. MS Picture Manager®) permitting to maintain the zooming level and the selected window frame while paging between different images.
-
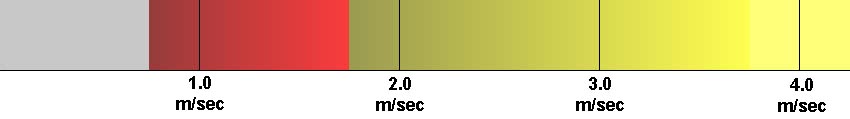
Colour coding: As a backdrop WindMap uses simple topographic maps illuminated more realistically from South-West. A basic wind speed of 6 m/sec has been assumed. Its vertical component must reach at least 25 percent of this, i.e. 1.5 m/sec, allowing a glider with a sinking speed of 0.75 m/sec to climb at about the same rate. Above this level the maps are coloured as follows: Zones with a moderate climbing potential are coloured from dark to light red (net climbing rates of 0.75 to 1.75 m/sec), whilst regions above this are coloured from beige to yellow. This is illustrated by the following colour diagram:
-
White lines: At regular intervals the maps show white lines in the direction of the wind . These lines only appear in downwind areas where no updrafts are expected. Slopes facing the wind are hatched if they are expected to be in the windshade of upwind terrains.
-
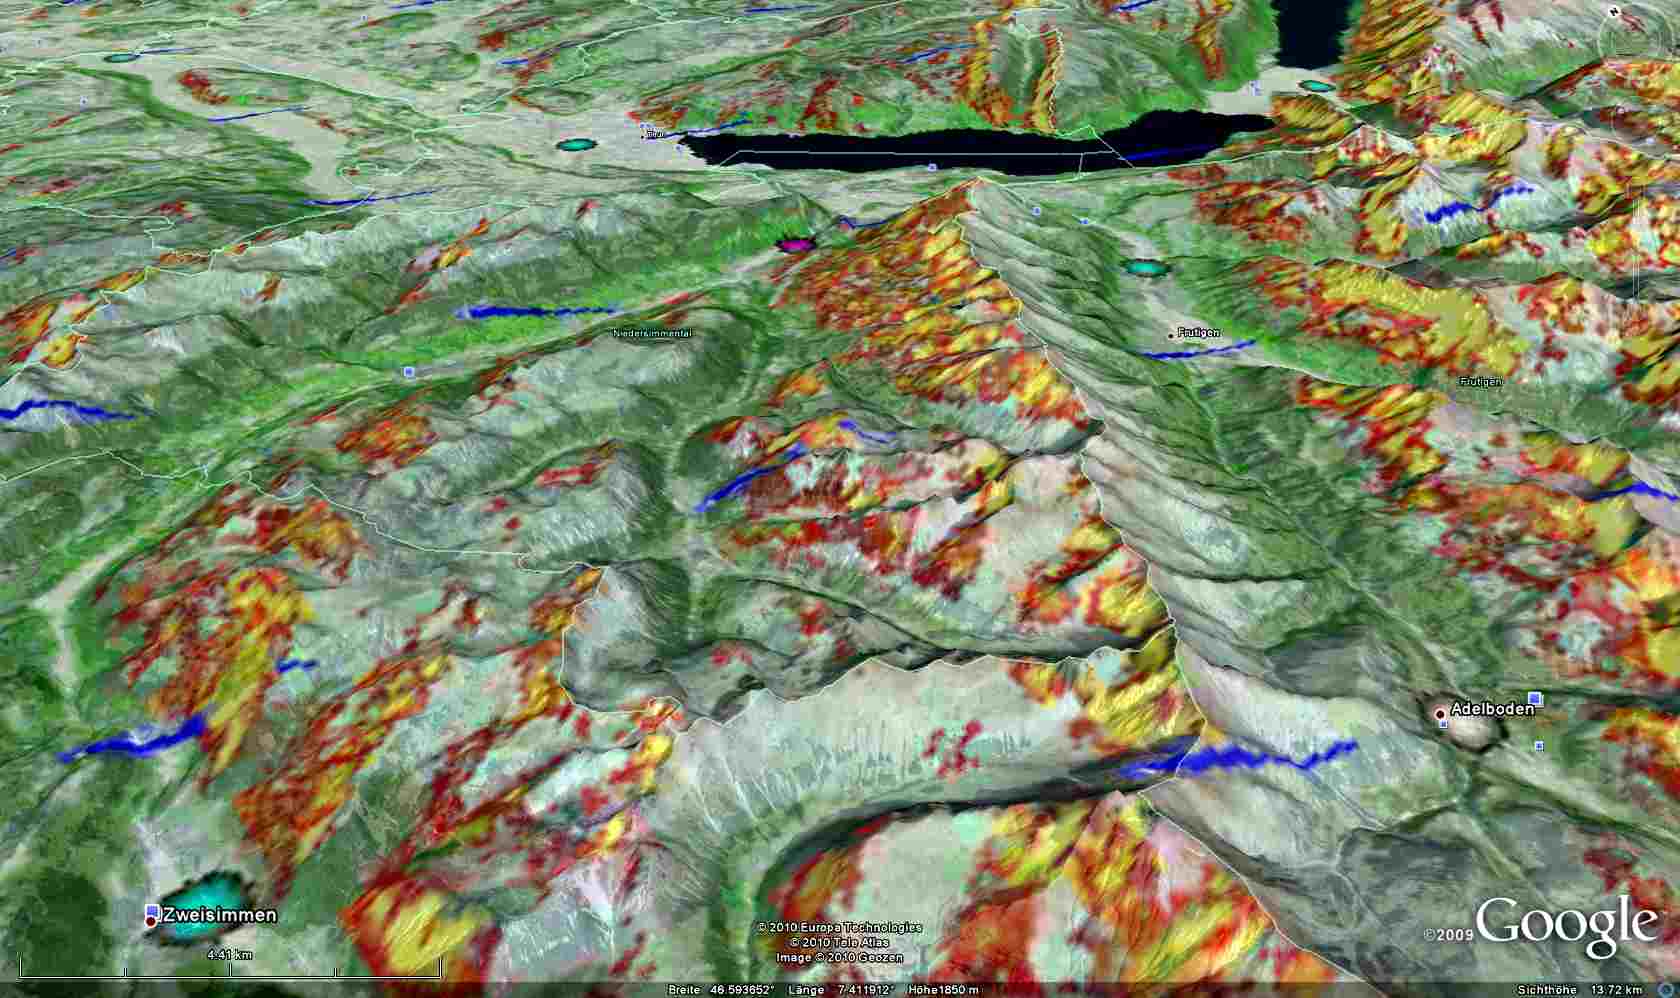
3D visualisation: Importing the corresponding TherMap maps into Google Earth® (KML Ground Overlays) or SeeYou® (raster maps) takes a few minutes, but this can facilitate the preparation or the retrospective analysis of flights, particularly when using the 3D mode. The advantage of Google Earth is that "flight" routes can be freely chosen, which is useful for flight preparations. For flight analyses the IGC records are frequently extracted via SeeYou, but can easily be converted to KML-format of Google Earth, which does not require importing the maps, but offers less possibilities for illustrating the flight path.
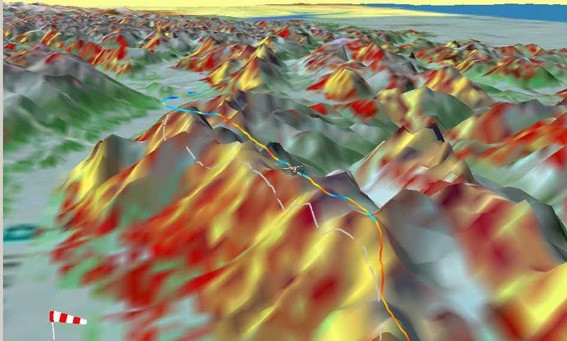
South Foehn wind near Innsbruck, Austria: WindMap
3D-view für 195° wind, with Variometer flighttrack (reproduced
with SeeYou©)
The picture also illustrates the high coincidence between the WindMap-potential
coloured on the surface and the recorded variometer values shown by
the track colour
d. Preflight and in-flight use of maps
-
Meteorology: Meteorological wind maps show that wind direction and strength change with time, location, and altitude. WindMap shows a different map for each wind direction and its use is only indicated if ridge winds predominate thermal updrafts. This requires the judgement of the user. Under these conditions the maps of WindMap can be a useful complementary tool to the meteorological forecasts.
-
Pre-checking planned flight paths: WindMap is best used before the flight to check ridge wind situations at the expected time of overflight.
-
In-flight use of WindMap: Consulting a map printout during the flight must not interfere with the necessary observation of the flight space. Tests with mobile navigation tools, into which TherMap hotspots had been imported, have shown that distraction from flight observation remains a critical issue, besides the limited readability of most navigation devices. Future devices may one day offer better readability. However even then, the mobile tools should be designed to automatically show the hotspots depending on the actual wind direction at a given location, to avoid distracting the pilot when manually selecting of the map file of the local wind direction.
e. Post-flight analysis using the maps
-
The wind direction of the maps used must be the same as that of the flight segment investigated. Digital flightlogs provided by IGC-files are very precise and may therefore permit to identify more easily where better itineraries might have been followed. In order to minimize their size. TherMap files are in JPG format.
-
As already mentioned, solution providers like GoogleEarth ® and SeeYou® offer functions to import WindMap files and to view them from above or in 3D. Goggle does not need to convert the files into another format. Where possible, it is also recommended to show the flight path in variometer option, in order to visualize the climbing and sinking phases of the flight. When importing the raster maps you have to enter the positions of the country maps used (NW and SE corner coordinates), as indicated under section a.
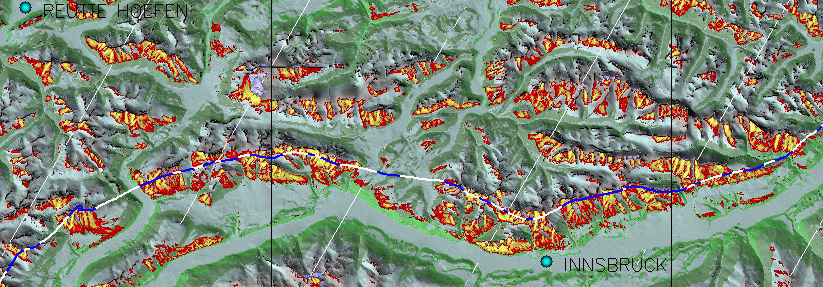
Example with foehn blowing from the
South near Innsbruck. For better contrast flight phases with significant
ridge winds are shown in blue.
The picture shows once again how well the WindMap model can represent
the updraft potential.This map has been produced with WindMap.
Select for the desired country region (Switzerland, French Alps, Austria, Pyrenees, North Apennine, Central Apennine) the field with the wind directions nearest to those of the flight (about 4-6 Mb per JPG map). Then either
-
double-click on the corresponding field to open, analyse and, if desired, save the corresponding map locally, or
-
right-click on the same field and request the target to be saved directly in a directory of your computer.
The copyright holder: Beda Sigrist, Switzerland
View maps in Google Earth
A 3D view may facilitate the perception of a given wind situation, as illustrated by this example. Users having installed Google Earth© on their PC (not on tablets or smartphones) can generate such perspectives themselves. WindMap is based on the same topographic data (SRTM) as Google Earth. You can view the WindMap files also in Google Earth, provided that you have installed this application on a desktop (not yet possible on Google Earth running on Android). This can be done as follows:
-
download the kmz-file of Windmap by right-clicking here and then saving the file on your computer.
-
upon clicking on the downloaded kmz-file Goggle Earth will open, showing the links to the WindMap files available on Google Earth.
Note that in order to avoid a significant loss of image resolution, the original charts have been cut into tiles of 2 square degrees which are referred to at the lowest level of the Google selection tree. Therefore the selection hierarchy looks as follows
WindMap-3D > Region > Region+Wind direction> Tile (coordinates of lower left corner)
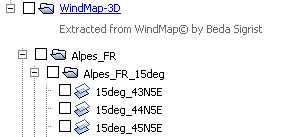
It is crucial to avoid making selections above "Region+Wind Direction", to prevent Google to superimpose pictures with different wind direction. The selctions appear as overlays on the Google screen. Picture transparency is set at 35 percent, but may be adjusted manually (right click on selection tile field > click on "Properties" > use transparency slider on top).
Who is behind WindMap?
Like TherMap,
WindMap is a private initiative of Dr. Beda Sigrist, a senior Swiss glider
pilot with a scientific background. Following the success of TherMap,
Dr. Hermann Trimmel and Olivier Liechti encouraged him to find out whether
it was not possible to also generate sensible ridge wind maps. Several
models were tried together with experienced competition pilots until the
present map collection was established. On this occasion, their invaluable
contributions are acknowledged, particularly those
of Stefan Leutenegger.
Can the application behind TherMap be purchased?
It would of course be interesting to have available directly the source
code needed to generate the maps. If the application itself was distributed,
the product would have to be wrapped up as a professional package and
update management procedures introduced to ensure that the users would
always have available the latest version. The resulting costs would require
a commercial approach. Apart from the much bigger effort, this would be
in conflict with the conditions set by SRTM, the distributor of the satellite
data, which is basically only made available for non-commercial use.
Can WindMap be extended to other regions, e.g. outside
Europe?
The development of WindMap, like TherMap, has also been the result
of intensive information exchange with experts and experienced pilots,
because the models represent only partly physical processes, the
other part being rather models of the perception of experienced pilots.
For any new region to be addressed it would therefore be crucial to have
such competent and experienced counterparts to properly adjust and validate
the models, if necessary. With such help from colleages of new territories
it would however be a pleasure to extend the scope of WindMap beyond the
present regions.
But even then, it cannot be guaranteed that the resulting maps would be of practical use. For instance using the WindMap model, ridge wind maps have also been tested for the fameous Appalachian ridges in the USA. Although it turned out that the maps reflected the updraft conditions quite well, it turned out that the skills of the most experienced pilots were mainly due to their ability to judge where and whether it was safe to "jump" between the usually low ridges. This skill appeared to be far more important for long distance flights than the ability to simply follow a given ridge. Since WindMap could not provide reliable guidance for ridge jumping, it has been decided not to publish WindMap for this region.
-
SRTM website: http://srtm.csi.cgiar.org/
-
SeeYou®: http://www.naviter.si/
-
A website offering also forecasted wind maps: Meteoblue
-
Meteorological panel of OSTIV
-
Google Earth: http://earth.google.com
Contact: If you have any comments, suggestions, or questions, you are welcome to directly contact the author Beda Sigrist by e-m@ail.